WEEK IN A NUTSHELL
WIN-dow to the week that was
Week In a Nutshell (WIN)
Week
ended
rd
3 Feb
Key WIN-dicators
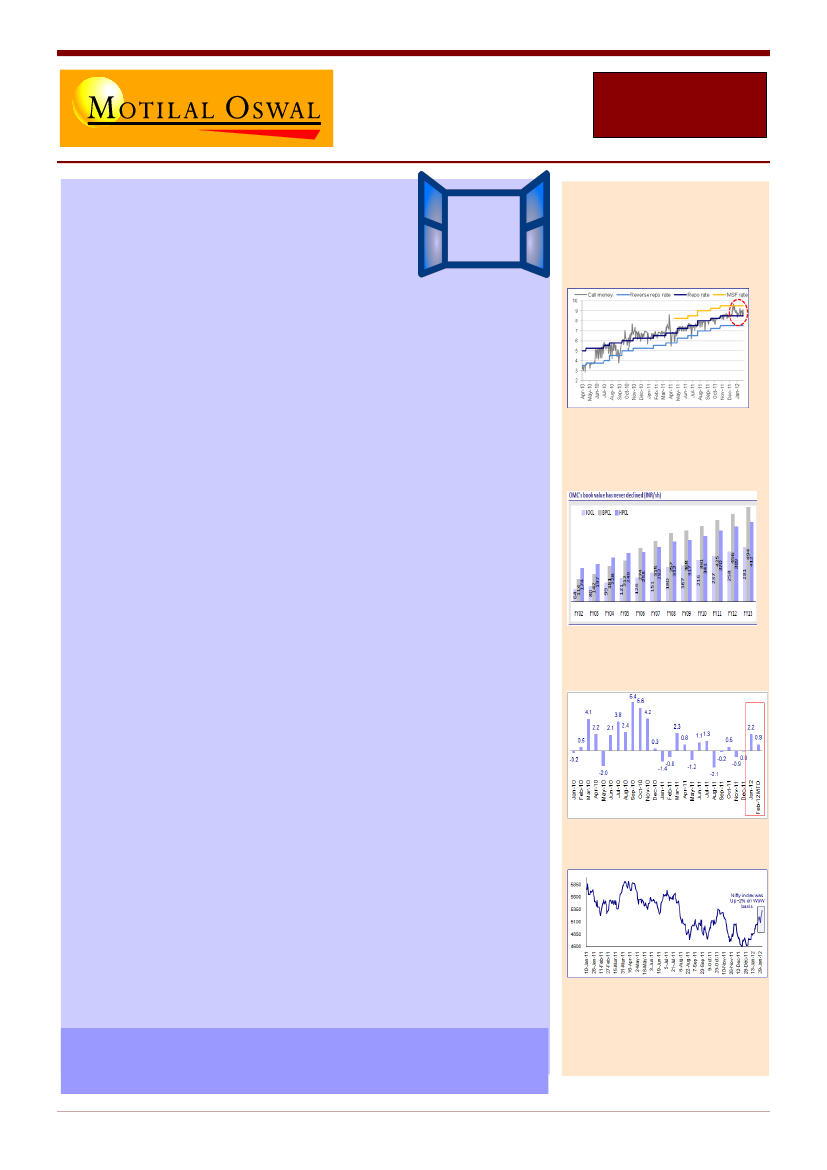
Call money rates still in the upper
corridor
Indian Equity Market continues to be the best performing market in
2012
with Nifty clocking its 5th consecutive weekly gain, led by YTD FII
inflows in excess of USD3bn. While this rally is not India specific, India
benefitted the most from rising flows into Emerging markets, coming out
of one of the worst months ever in December. The week also saw
Supreme Court deliver a landmark judgment cancelling ~120 telecom
licenses issued by government in 2008. This would likely reduce
competitive intensity and the sector would finally be served up the much
awaited consolidation. Banking Secretary clarified that the Banking sector
exposure to the affected parties is INR 100 Bn.
Monthy Auto Numbers:
Have the car volumes bottomed out? The
numbers seem to be indicating that; with both Tata Motors and Maruti
surprising positively. 2 Wheelers are trading market share but clearly this
year will be different and tougher. Can the 2 Wheeler stocks go the same
fate as the PV stocks? Inventory levels seem different for different
companies ranging from 15 to 40 days.
While the earnings have been largely in line with expectations till now
with
Nifty Companies reporting a PAT growth of 9.4% YoY,
we highlight a
few that stand out for the right and the wrong reasons:
-
ICICI Bank:
6% lower than est Opex, 19% lower than est provisioning
and higher Other Income (maiden dividend of INR1.5b from life
insurance sub) were the 3 key reasons for PAT (INR117.3b +20%YoY)
being 10% above our est. Adjusting for dividend, PAT was in line. 30bps
QoQ improvement in International NIM’s were a +ve surprise.
-
Titan:
PAT was impacted by by 5% decline in jewelry volumes and a
steep 590bp decline in watch business margins.
-
Crompton Greaves:
Worst possibly over, but wouldn’t jump in yet. Build
up of orders is a +Ve (Consol order-book stands at INR82b, up 17% YoY
on back of strong order flows in domestic power business).
We would also like to bring focus on Indian OMCs (BPCL, HPCL and IOC)
where there has been no erosion in BV but the stocks are trading at
significant discount to their 10-year historical averages. Also, in our
view, the Govt/ upstream will eventually compensate OMCs, ensuring
no erosion of BV. We have Buy ratings on the OMCs.
OMC book Values have never
declined
Monthly FII Investments
US$B
WoW - Nifty Change (+2.3%)
WWW – WIN Weekend Wisdom
Four most dangerous words in investing: “Its different
this time”.
WIN – Week In a Nutshell
1
3 Feb
2012