9 February 2012
3QFY12 Results Update | Sector: Financials
Dena Bank
BSE SENSEX
S&P CNX
17,707
Bloomberg
Equity Shares (m)
52-Week Range (INR)
1,6,12 Rel.Perf.(%)
M.Cap. (INR b)
M.Cap. (USD b)
5,368
DBNK IN
333.4
114/48
37/-7/-15
26.8
0.5
CMP: INR81
TP: INR144
Buy
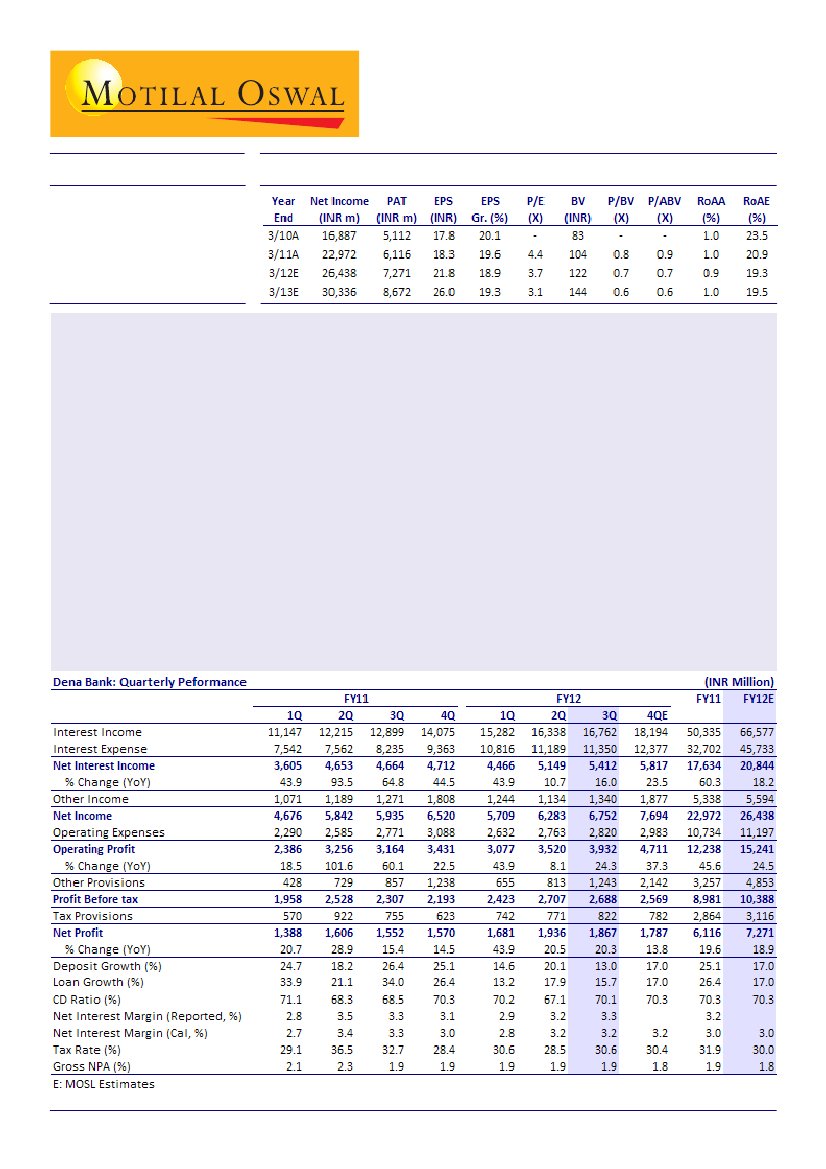
Dena Bank (DBNK) reported a PAT of ~INR1.9b for 3QFY12, up 20% YoY. Reported NIM improved 11bp QoQ to 3.3%,
led by ~300bp improvement in CD ratio and higher yield on loans (+22bp QoQ). Further, core fee income was
strong at 13% QoQ and 27% YoY, driving PAT.
Key highlights:
Strong loan growth:
Loans grew 11% QoQ and ~16% YoY to INR480b whereas deposits grew 6.4% QoQ and 13%
YoY to INR683b. CD ratio improved 300bp QoQ to 70%. Management has guided loan growth of 20%+ for FY12.
Slippages remain under check:
Slippages during the quarter stood at ~INR1.7b (annualized slippage ratio of
1.7% - stable QoQ). Slippages were broad-based and the bank expects asset quality to remain healthy.
Restructured loans at 3.8% of overall loans:
DBNK restructured loans of INR3.1b, of which INR1.3b can be
attributed to the restructuring of the Uttar Haryana SEB account. The management expects restructuring to
increase in 4QFY12, led by two large accounts - GTL (exposure of INR4b) and Rajasthan SEB. The bank has not
booked any NPV losses on the loans restructured during 9MFY12.
Likely to raise capital:
DBNK expects to raise capital by selling ~5% stake to LIC and expects the government to
infuse more capital. Cumulatively, it expects to raise INR5b from both sources. We have not yet factored this
into our estimates. CAR stood at 12.9% (including 9MFY12 profits), of which tier-I capital stood at ~9.8%.
Valuation and view:
We expect DBNK to report an EPS of INR21.8 in FY12 and INR26 in FY13. BV would be INR122
in FY12 and INR144 in FY13. The stock trades at 3.7x FY12E and 3.1x FY13E EPS, and 0.7x FY12E and 0.6x FY13E BV. RoA
and RoE are likely to be ~1% and 19%+, respectively over FY12/13. Maintain
Buy.
Alpesh Mehta
(Alpesh.Mehta@MotilalOswal.com); Tel: + 91 22 3982 5415
Sohail Halai
(Sohail.Halai@MotilalOswal.com); Tel: + 91 22 3982 5430

Dena Bank
Strong Loan growth led by SME segment
Loans grew 11% QoQ and ~16% YoY to INR480b whereas deposits grew 6.4% QoQ and
13% YoY to INR683b. Resultantly CD ratio improved 300bp QoQ to 70%. Incremental
loan growth was driven by 16% QoQ growth in SME segment (forming 21% of
incremental loan during the quarter). Retail loans were flattish QoQ and up 13% YoY
to INR66b. While YTD loan growth stood at ~6%. Management has guided for loan
growth of 20%+, implying sequential loan growth of 12%+ for 4QFY12. Management
mentioned key drivers for loan growth is expected to be SME and retail segment.
CASA ratio declines 70bp QoQ
CASA deposits grew 4% QoQ and 11% YoY to INR238b. Sequential growth in CASA
deposits was led by strong growth in CA deposits (+14% QoQ and 11% YoY) to INR55b.
SA deposits grew 2% QoQ and ~12% YoY. Consequently CASA ratio declined 70bp QoQ
to 34.9%.
NIM improve 11bp QoQ to 3.3%
NII grew 5%QoQ and 16% QoQ to INR5.4b. NIMs improved 11bp QoQ to 3.3% led by
~300bp improvement in CD ratio and higher yield on loans. While cost of deposits
increased 12bp QoQ to 7.1%, yield on loans were up 22bp QoQ 12.2%, which aided
margin expansion. Management guided for margins of 3%+ for FY12 as compared to
3.16% for 9MFY12 and 3.2% in FY11.
Strong fee income growth drives non-interest income
Non-interest income grew 5% QoQ and 18% YoY to INR1.3b. Core fee income grew
13% QoQ and 27% YoY to INR1.1b - a positive surprise. Trading profit was INR100m as
against INR40m a quarter ago and INR140m a year ago. Recoveries from written-off
accounts stood at INR153m as against INR128m in 2QFY12 and INR275m in 3QFY11.
Management mentioned that it expected some recoveries in 3QFY12 which did not
materialize and is now likely to come in 4QFY12, thereby income from recoveries
from written off accounts is expected to be strong in 4QFY12.
Slippages remain under check
Slippages during the quarter stood at INR1.7b (annualized slippage ratio of 1.7%) v/s
INR1.6b in 2QFY12. Management mentioned that slippages were broad based and it
does not see any stress in any particular segment. While it expects asset quality to be
healthy, exposure to SME segment needs to be watched. Recoveries and upgradations
during the quarter amounted to INR719m as compared to INR593m a quarter ago and
INR722m a year ago. Write offs during the quarter stood at INR469m v/s INR636m in
2QFY12 and INR560 in 3QFY11. In absolute terms GNPA and NNPA both increased 7%
QoQ to INR8.9b and INR5.2b respectively. While provision coverage ratio (calculated)
stood at 41% (stable QoQ), PCR including technical write-off was healthy at ~77%.
Restructured loans worth INR3.1b during the quarter
DBNK restructured loans worth INR3.1b during the quarter of which INR1.3b was on
account of restructuring of loans to Uttar Haryana SEB. Overall restructured loan book
stood at INR18.4b (3.8% of overall loans) of which cumulatively ~5% has slipped into
NPA. Management expects restructuring to increase in 4QFY12 and stated that it has
9 February 2012
2

Dena Bank
so far received application from two large accounts viz. - GTL (exposure of INR4b) and
Rajasthan SEB (overall exposure of INR11b - of which some short term loans likely to
get restructured in 4QFY12). Currently bank has not booked any NPV losses on loans
restructured during 9MFY12 and is likely to provide for the same in 4QFY12 (expected
NPV loss of INR500m).
Other highlights
Bank expects to raise capital by selling ~5% stake to LIC and further expects
government to infuse capital. Cumulatively it expects to raise INR5b from both
the sources. Currently we have not factored it in our estimates. CAR of the bank
stood at 12.9% (including 9M FY12 profits) of which Tier I stood at ~9.8%.
Banks exposure to power segment stood at INR44b (~9.2% of overall loans ) - of
which INR22b is towards generation segment, INR21b is on distribution segment
with rest to transmission segment.
Bank has exposure of INR2b towards Air India.
Valuation and view
Management has guided for margins of 3%+ for FY12 vs 3.16% for 9MFY12. We
model in a margin decline of 7bp for FY12 as against 3.2% in FY11 and expect it to
decline further by ~8bp in FY13. While asset quality has surprised positively, high
concentration in power segment (9.2% of overall loans) remains a concern. We
model in slippage ratio of ~1.6% and 1.8% for FY12 and FY13 and expect credit cost
to be 50bp and 65bp for FY12/13 respectively.
We expect DBNK to report an EPS of INR21.8 in FY12 and INR26 in FY13. BV would
be INR122 in FY12 and INR144 in FY13. The stock trades at 3.7x FY12E and 3.1x FY13E
EPS, and 0.7x FY12E and 0.6x FY13E BV. RoA and RoE are likely to be ~1% and 19%+
over FY12/13. In our view, valuations are attractive. Maintain
Buy
with a target
price of INR144 (1x FY13E BV).
Dena Bank: One year forward P/E
Dena Bank: One year forward P/BV
9 February 2012
3

Dena Bank
Quaterly trends
Strong loan growth QoQ
CD ratio improves 300bp QoQ (%)
Management has guided for loan growth of 20%+,
implying sequential loan growth of 12%+ for 4QFY12
Bank utilized excess liquidity built in balance sheet
CASA ratio declines 70bp QoQ (%)
Reported margin improve 11bp QoQ (%)
CASA deposits grew 4% QoQ and 11% YoY to INR238b
Improvement in CD ratio (+300bp QoQ) and re-pricing of
loans (+22bp QoQ) led to improvement in margins
Slippages under control (%)
Asset Quality remains healthy
Annualized slippage ratio of 1.7% - stable QoQ
GNPAs and NNPAs up 7% QoQ
9 February 2012
4

Dena Bank
Quarterly Snapshot
FY11
1Q
Profit and Loss (INR m)
Net Interest Income
3,605
Other Income
1,071
Trading profits
99
Recoveries
179
Others (Non core)
793
Total Income
4,676
Operating Expenses
2,290
Employee
1,446
Others
844
Operating Profits
2,386
Provisions
428
PBT
1,958
Taxes
570
PAT
1,388
Asset Quality
GNPA
8,011
NNPA
5,612
GNPA (%)
2.1
NNPA (%)
1.5
PCR (Calculated, %)
30
PCR (Reported, %)
76
Slippages
2,400
Slippage Ratio
3.4
Prov. for NPA in qtr
449
Credit Cost
0.5
Ratios (%)
Fees to Total Income
17.0
Cost to Core Income
52.1
Tax Rate
29.1
CASA Reported
36.9
Loan/Deposit
71.1
CAR
11.9
Margins - Reported (%)
Yield on loans
9.7
Cost of Deposits
5.7
NIM
2.8
Margins Cumulative- Reported (%)
Yield on loans
9.7
Cost of Deposits
5.7
NIM
2.8
Balance sheet (INR b)
Deposits
533
of which CASA Deposits
196
Gross Advances
379
Investments
162
HTM
144
AFS
18
AFS Duration (Modified)
4.8
Franchise
Branches
1,237
ATMs
421
For %age change QoQ and YoY is
2Q
3Q
4Q
1Q
2Q
FY12
3Q
Variation (%)
QoQ
YoY
Cumulative Numbers
9M
9M
YoY
FY11
FY12 Gr (%)
12,922
3,531
238
725
2,568
16,453
7,646
4,879
2,767
8,807
2,014
6,793
2,247
4,546
8,033
5,191
2
1
35
76
15,027
3,717
154
384
3,180
18,744
8,214
5,016
3,198
10,530
2,712
7,819
2,334
5,484
8,853
5,240
2
1
41
77
16
5
-35
-47
24
14
7
3
16
20
35
15
4
21
10
1
-9
-16
544
47
4,653
1,189
-1
272
919
5,842
2,585
1,625
960
3,256
729
2,528
922
1,606
8,257
5,378
2.3
1.5
35
75
1,426
1.9
651
0.7
15.7
46.4
36.5
39.1
68.3
12.3
10.3
5.5
3.5
10.0
5.6
3.2
535
209
365
172
149
23
3.9
1,257
441
bp
4,664
1,271
140
275
856
5,935
2,771
1,808
963
3,164
857
2,307
755
1,552
8,033
5,191
1.9
1.3
35
76
1,058
1.4
503
0.5
14.4
50.2
32.7
35.4
68.5
11.1
10.3
5.8
3.3
10.1
5.7
3.2
605
214
414
179
152
28
3.8
1,284
473
4,712
1,808
3
621
1,184
6,520
3,088
2,003
1,085
3,431
1,238
2,193
623
1,570
8,422
5,490
1.9
1.2
35
75
2,703
3.0
1,210
1.1
18.2
52.4
28.4
35.4
70.3
13.4
10.5
6.0
3.1
10.2
5.8
3.2
642
227
452
189
157
32
2.4
1,291
496
4,466
1,244
14
102
1,128
5,709
2,632
1,681
951
3,077
655
2,423
742
1,681
7,972
4,582
1.9
1.1
43
78
1,483
1.6
222
0.2
19.7
47.1
30.6
35.2
70.2
13.1
11.3
6.7
2.9
11.3
6.7
2.9
611
222
429
198
169
29
4.0
1,297
507
5,150
1,134
40
128
966
6,284
2,763
1,626
1,136
3,521
813
2,708
771
1,937
8,305
4,910
1.9
1.2
41
77
1,561
1.7
650
0.6
15.4
45.2
28.5
35.6
67.1
12.6
12.0
7.0
3.2
11.6
6.8
3.1
642
229
431
217
168
49
3.2
1,298
520
5,412
1,340
100
153
1,087
6,752
2,820
1,708
1,112
3,932
1,243
2,688
822
1,867
8,853
5,240
1.9
1.1
41
77
1,735
1.7
685
0.6
16.1
43.4
30.6
34.9
70.1
11.6
12.2
7.1
3.3
11.8
6.9
3.2
683
238
479
206
172
34
3.7
1,307
535
5
18
N.A.
20
13
7
2
5
-2
12
53
-1
7
-4
7
7
-8
-5
-6
-58
11
-3
5
0
16
5
-29
-44
27
14
2
-6
15
24
45
17
9
20
10
1
-9
-16
544
47
64
31
36
9
15.6
49.4
33.1
17.0
45.1
29.9
22
12
11
18
8
10
6
4
11
-5
2
-31
186
134
6
171
127
-4
13
11
16
15
14
21
10
6
3
12
7
3
172
127
-5
9
15
23
62
Source: Company/MOSL
9 February 2012
5

Dena Bank
Stock Info
EPS: MOSL forecast v/s consensus (INR)
MOSL
Forecast
21.8
26.0
Consensus
Forecast
21.4
25.5
Variation
(%)
2.2
2.0
1-year Sensex rebased
Dena Bank
120
100
80
Sens ex - Rebas ed
FY12
FY13
Shareholding pattern (%)
Promoter
Domestic Inst
Foreign
Others
Dec-11
58.0
7.6
12.3
22.1
Sep-11
58.0
8.0
13.5
20.5
Dec-10
51.2
9.8
17.4
21.7
60
40
Feb-11
Ma y-11
Aug-11
Nov-11
Feb-12
9 February 2012
6

Dena Bank
Financials and Valuation
9 February 2012
7

Dena Bank
Financials and Valuation
9 February 2012
8

Dena Bank
N O T E S
9 February 2012
9

Disclosures
This report is for personal information of the authorized recipient and does not construe to be any investment, legal or taxation advice to you. This research report does not constitute an offer, invitation or inducement
to invest in securities or other investments and Motilal Oswal Securities Limited (hereinafter referred as MOSt) is not soliciting any action based upon it. This report is not for public distribution and has been
furnished to you solely for your information and should not be reproduced or redistributed to any other person in any form.
Unauthorized disclosure, use, dissemination or copying (either whole or partial) of this information, is prohibited. The person accessing this information specifically agrees to exempt MOSt or any of its affiliates
or employees from, any and all responsibility/liability arising from such misuse and agrees not to hold MOSt or any of its affiliates or employees responsible for any such misuse and further agrees to hold MOSt
or any of its affiliates or employees free and harmless from all losses, costs, damages, expenses that may be suffered by the person accessing this information due to any errors and delays.
The information contained herein is based on publicly available data or other sources believed to be reliable. While we would endeavour to update the information herein on reasonable basis, MOSt and/or its
affiliates are under no obligation to update the information. Also there may be regulatory, compliance, or other reasons that may prevent MOSt and/or its affiliates from doing so. MOSt or any of its affiliates or
employees shall not be in any way responsible and liable for any loss or damage that may arise to any person from any inadvertent error in the information contained in this report . MOSt or any of its affiliates
or employees do not provide, at any time, any express or implied warranty of any kind, regarding any matter pertaining to this report, including without limitation the implied warranties of merchantability, fitness
for a particular purpose, and non-infringement. The recipients of this report should rely on their own investigations.
This report is intended for distribution to institutional investors. Recipients who are not institutional investors should seek advice of their independent financial advisor prior to taking any investment decision
based on this report or for any necessary explanation of its contents.
MOSt and/or its affiliates and/or employees may have interests/positions, financial or otherwise in the securities mentioned in this report. To enhance transparency, MOSt has incorporated a Disclosure of Interest
Statement in this document. This should, however, not be treated as endorsement of the views expressed in the report.
Disclosure of Interest Statement
1. Analyst ownership of the stock
2. Group/Directors ownership of the stock
3. Broking relationship with company covered
4. Investment Banking relationship with company covered
Dena Bank
No
No
No
No
Analyst Certification
The views expressed in this research report accurately reflect the personal views of the analyst(s) about the subject securities or issues, and no part of the compensation of the research analyst(s) was, is, or
will be directly or indirectly related to the specific recommendations and views expressed by research analyst(s) in this report. The research analysts, strategists, or research associates principally responsible
for preparation of MOSt research receive compensation based upon various factors, including quality of research, investor client feedback, stock picking, competitive factors and firm revenues.
Regional Disclosures (outside India)
This report is not directed or intended for distribution to or use by any person or entity resident in a state, country or any jurisdiction, where such distribution, publication, availability or use would be contrary to
law, regulation or which would subject MOSt & its group companies to registration or licensing requirements within such jurisdictions.
For U.K.
This report is intended for distribution only to persons having professional experience in matters relating to investments as described in Article 19 of the Financial Services and Markets Act 2000 (Financial
Promotion) Order 2005 (referred to as "investment professionals"). This document must not be acted on or relied on by persons who are not investment professionals. Any investment or investment activity to
which this document relates is only available to investment professionals and will be engaged in only with such persons.
For U.S.
MOSt is not a registered broker-dealer in the United States (U.S.) and, therefore, is not subject to U.S. rules. In reliance on the exemption from registration provided by Rule 15a-6 of the U.S. Securities Exchange
Act of 1934, as amended (the "Exchange Act") and interpretations thereof by the U.S. Securities and Exchange Commission ("SEC") in order to conduct business with Institutional Investors based in the U.S.,
Motilal Oswal has entered into a chaperoning agreement with a U.S. registered broker-dealer, Marco Polo Securities Inc. ("Marco Polo").
This report is intended for distribution only to "Major Institutional Investors" as defined by Rule 15a-6(b)(4) of the Exchange Act and interpretations thereof by SEC (henceforth referred to as "major institutional
investors"). This document must not be acted on or relied on by persons who are not major institutional investors. Any investment or investment activity to which this document relates is only available to major
institutional investors and will be engaged in only with major institutional investors.
The Research Analysts contributing to the report may not be registered /qualified as research analyst with FINRA. Such research analyst may not be associated persons of the U.S. registered broker-dealer, Marco
Polo and therefore, may not be subject to NASD rule 2711 and NYSE Rule 472 restrictions on communication with a subject company, public appearances and trading securities held by a research analyst account.
Motilal Oswal Securities Ltd
3rd Floor, Hoechst House, Nariman Point, Mumbai 400 021
Phone: (91-22) 39825500 Fax: (91-22) 22885038. E-mail: reports@motilaloswal.com