14 February 2012
3QFY12 Results Update | Sector: Utilities
CESC
BSE SENSEX
17,773
Bloomberg
Equity Shares (m)
52-Week Range (INR)
1,6,12 Rel. Perf. (%)
M.Cap. (INR b)
M.Cap. (USD b)
S&P CNX
5,5390
CESC IN
125.6
364/186
9/-22/-9
33.9
0.7
CMP: INR270
TP: INR454
Buy
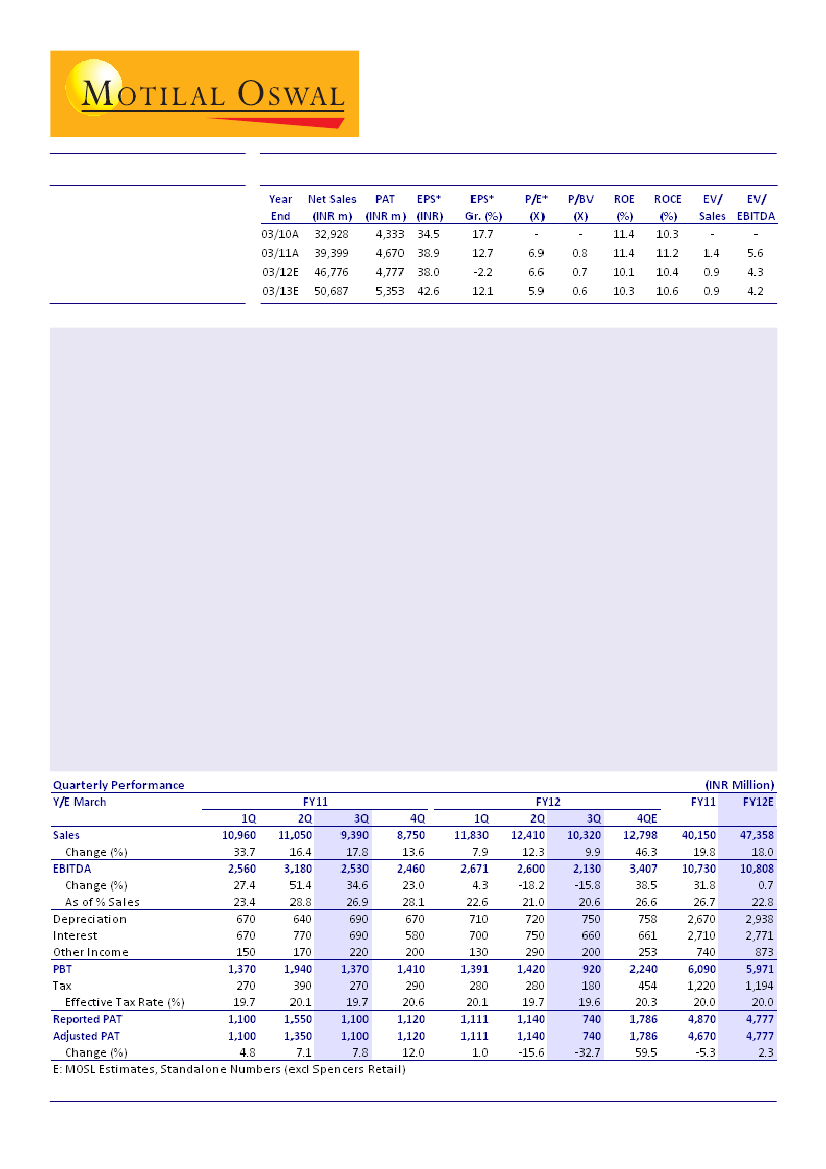
* Excl Spencers; fully diluted
Results below estimates:
CESC's reported 3QFY12 PAT at INR740m (down 33% YoY) was much lower than our
estimate of INR1.5b. We had factored in a hike in tariff rates, which is not yet approved and to that extent
recurring PAT would have been lower by INR0.8-1b. Our interaction with the management indicated under-
recoveries of "non-fuel" items (fuel increase is passed through on monthly basis). Pending tariff order (TO)
approval, management has created a provision to the extent of INR350m, on the back of conservative policy
and prudence.
Consolidation at Spencer continues:
Spencer's total area under operation stood at 1.02msf, up 0.02msf MoM.
For YTDFY12, Spencer has added 0.07msf, despite closing 21 daily and express stores. Sales increased during
the quarter as indicated by robust revenues of INR1,087/sf/month in 9MFY12 compared to INR1,066/sf/month
in 1HFY12. Store-level EBIDTA has also registered an increase 3QFY12, deduced from 9MFY12 EBIDTA of INR35/
sf/month compared 1HFY12 EBIDTA of INR31/sf/month. For 9MFY12, store-level EBITDA was INR311m against
INR194m in 9MFY11.
Steady progress for projects under construction:
CESC is currently constructing 1.2GW of power projects (current
installed capacity of 1.2GW) and has obtained major clearances/placed equipment orders for the entire
capacity. It is also working on ~6GW of projects. It has consolidated its power business holdings through a
wholly-owned subsidiary, CESC Infrastructure, which in turn owns Haldia Energy (600-MW coast-based project).
Haldia Energy owns Dhariwal Infrastructure (which operates the 600-MW Chandrapur project in Maharashtra).
This provides the company a platform to induct a financial investor for meeting the funding requirements of
the power business.
Valuations and view:
We expect CESC to report a standalone PAT of INR4.8b in FY12 (up 2% YoY) and INR5.3b in
FY13 (up 12% YoY). The stock quotes at PER of 6x FY13E on a standalone basis. Maintain
Buy.
Nalin Bhatt
(NalinBhatt@MotilalOswal.com) +91 22 3982 5429
Satyam Agarwal
(AgarwalS@MotilalOswal.com)
/
Vishal Periwal
(Vishal.Periwal@MotilalOswal.com)

CESC
3QFY12 results lower than estimates on account of under recoveries
CESC reported 3QFY12 PAT at INR740m (down 33% YoY) lower than our estimates
of INR1.5b. Our estimates has factored in a tariff hike, which is not yet approved
and to that extent, the recurring PAT would have been lower by INR0.8-1b. Our
interaction with the management indicated under recoveries of "non-fuel" items
(fuel being pass through on monthly basis). Pending TO approval, the management
has created a provision to the extent of ~INR350m, on the back of conservative
policy and prudence.
CESC accounts for normative increase in its "non-fuel" items considering deemed
revenue being allowed under its regulated nature of business. However, it does
not account for any increase in regulated earnings till such time the tariff order
(TO) is approved by commission. We understand that the tariff petition has been
filed and final hearing is already over, and TO is expected soon. We believe that
these provision would be reversed as TO is approved, based on hike in tariff
granted by commission, along with increase in regulated earnings.
During 3QFY12 fuel cost for CESC increased by 22% YoY and 6% QoQ and stood at
INR2.0/unit. Increase is led by full impact of price hike by CIL, particularly Grade
A/B by ECL. CESC currently procures ~40% of its requirement from CIL (largely
higher grade coal).
Average realization for the quarter stood at INR4.6/unit v/s INR4.3/unit YoY. Higher
realization is led by higher power purchase cost during the quarter (pass through).
Power purchase cost for the 3QFY12 stood at INR1.1b, up12% YoY and 50% QoQ.
Operating factors maintained
Power generation stood at 2.2Us during 3QFY12, up 2% YoY while sales stood at
2.4BUs units (up 5% YoY), while average PLF for the plant stood at 87% v/s 83%
YoY.PLF for Budge Budge stands at 90% (vs 85% YoY), Titagarh at 74% (vs 79% YoY),
and Southern project at 88% (vs 78% YoY).
CESC purchased ~90MUs in 3Q to meet the power demand for the Kolkatta region,
power demand grew by 3% YoY to 2.3BUs.
Generation/PLF move up YoY
Demand growth has been muted (%)
Power export typically higher in 1H (MUs)
Source: Company/MOSL
14 February 2012
2

CESC
Spencer: Consolidation drive continue, 9M numbers indicate better
realisation/EBIDTA for 3Q
As at 3QFY12, Spencer's total area under operation stood at 1.02msf, up 0.02msf
MoM. In YTDFY12, Spencer has added 0.07msf. Addition during the quarter has
mainly come from hyper store where-in it added 1 store, while it closed 1 Daily/
Express stores. For YTDFY12, Spencer has added 4 Hyper, 2 Super store and has
closed 11 daily and 10 express store. As at 3QFY12 Spencer operated 195 Stores v/
s 210 stores as at FY11.
Sales for Spencer have seen an uptick for 3Q, which can be seen from 9MFY12
revenues at INR1,087/sft/month v/s INR1,066/sq.ft/month for 1HFY12. Over the
same period same store sales has increased to INR1,159/sq.ft/month v/s INR1,146/
sq.ft/month.
Store level EBIDTA has seen slight uptick in 3QFY12, seen from 9MFY12 EBIDTA at
INR35/sft/month v/s 1HFY12 levels of INR31/sft/month. In 9MFY12 Store level
EBITDA stood at INR311m v/s INR194m YoY.
Post consolidation, Spencer area under operation up
Revenue momentum seem to be holding up (INR/sft/month)
Source: Company/MOSL
Valuations and view
We expect CESC to report standalone net profit of INR4.8b in FY12E (up 2% YoY)
and INR5.3b in FY13 (up 12% YoY).
Stock quotes at PER of 6x FY13E on standalone basis. Maintain
Buy.
CESC: SOTP Calculations
Business
Segment
Regulated Business
Real Estate
Spencer Retail
CESC Infrastructure
- Chandrapur 600MW
- Haldia 600MW
Cash
Total
Power Generation
& Distribution
Real Estate
Retail Chain
Power Generation
Method
FY12E PER (x)
NPV
FY11 EV/Sales
DCF, COE of 13.5%
DCF, COE of 15.0%
FY11 Book Value
Valuation
multiple
8.0
-
1.0
Value
Value
(INR m) (INR/sh)
32,239
1,490
5,396
7,125
5,171
1,954
10,763
57,013
257
12
43
57
41
16
86
454
Rationale
At discount to industry average
NPV of Mall project
At discount to industry average
Projects have entered
construction phase, FY11 BV of
equity investments at INR7.3b
Source: Company/MOSL
14 February 2012
3

CESC
CESC: an investment profile
Company description
CESC, an RPG Group Company is one of the oldest
integrated power utilities in India with presence in
mining, generation, and distribution of power. Installed
generation capacity stands at 1.2GW and distribution
network encompasses 2.3m consumers in Kolkata and
Howrah region. 1.2GW of generation projects are under
construction and additional 4.3GW of projects are in
pipeline. CESC has presence in retail business "Spencer"
which has 0.95msf area under operations.
Key investment risk
Continued losses at Spencer retail and funding
through standalone cashflows of CESC.
Fuel availability for Chandrapur project and partially
for Haldia project.
Recent development
Tariff order approval for Kolkata distribution
business in 2QFY12 got delayed and is now expected
in 4QFY12
Sales for Spencer have seen an uptick for 3Q, as
indicated by robust revenues for 9MFY12 at INR1,087/
sft/month v/s INR1,066/sq.ft/month for 1HFY12.
Key investment positives
Assured return from existing generation /
distribution business provides steady cash flows
(regulated profit at INR4b+ pa)
1.2GW project has entered construction phase and
company has made equity investments of INR7b+ .
Consolidation and restructuring at Spencers has led
to reduction in operational losses to INR1.7b in FY11,
vs INR2.1b in FY10. Further reduction in losses/value
unlocking opportunity is possible.
Project pipeline of 6GW provides growth
opportunity going forward.
Valuation and view
We expect CESC to report standalone net profit of
INR4.8b in FY12E (up 2% YoY) and INR5.3b in FY13 (up
12% YoY).
Stock quotes at PER of 6x FY13E on standalone basis.
Maintain
Buy.
EPS: Most forecast v/s consensus (INR)
MOSL
Forecast
38.0
42.6
Consensus
Forecast
29.0
37.7
Variation
(%)
30.9
13.0
Target price and recommendation
Current
Price (INR)
270
Target
Price (INR)
454
Upside
(%)
68.1
Reco.
Buy
FY12
FY13
Stock performance (1 year)
CESC
380
320
Sens ex - Reba s ed
Shareholding pattern (%)
Dec-11
Promoter
Domestic Inst
Foreign
Others
52.5
16.6
18.2
12.8
Sep-11
52.5
17.0
18.4
12.2
Dec-10
52.5
16.6
19.5
11.4
260
200
140
Feb-11
May-11
Aug-11
Nov-11
Feb-12
14 February 2012
4

CESC
Financials and Valuations
14 February 2012
5

Disclosures
This report is for personal information of the authorized recipient and does not construe to be any investment, legal or taxation advice to you. This research report does not constitute an offer, invitation or inducement
to invest in securities or other investments and Motilal Oswal Securities Limited (hereinafter referred as MOSt) is not soliciting any action based upon it. This report is not for public distribution and has been
furnished to you solely for your information and should not be reproduced or redistributed to any other person in any form.
Unauthorized disclosure, use, dissemination or copying (either whole or partial) of this information, is prohibited. The person accessing this information specifically agrees to exempt MOSt or any of its affiliates
or employees from, any and all responsibility/liability arising from such misuse and agrees not to hold MOSt or any of its affiliates or employees responsible for any such misuse and further agrees to hold MOSt
or any of its affiliates or employees free and harmless from all losses, costs, damages, expenses that may be suffered by the person accessing this information due to any errors and delays.
The information contained herein is based on publicly available data or other sources believed to be reliable. While we would endeavour to update the information herein on reasonable basis, MOSt and/or its
affiliates are under no obligation to update the information. Also there may be regulatory, compliance, or other reasons that may prevent MOSt and/or its affiliates from doing so. MOSt or any of its affiliates or
employees shall not be in any way responsible and liable for any loss or damage that may arise to any person from any inadvertent error in the information contained in this report . MOSt or any of its affiliates
or employees do not provide, at any time, any express or implied warranty of any kind, regarding any matter pertaining to this report, including without limitation the implied warranties of merchantability, fitness
for a particular purpose, and non-infringement. The recipients of this report should rely on their own investigations.
This report is intended for distribution to institutional investors. Recipients who are not institutional investors should seek advice of their independent financial advisor prior to taking any investment decision
based on this report or for any necessary explanation of its contents.
MOSt and/or its affiliates and/or employees may have interests/positions, financial or otherwise in the securities mentioned in this report. To enhance transparency, MOSt has incorporated a Disclosure of Interest
Statement in this document. This should, however, not be treated as endorsement of the views expressed in the report.
Disclosure of Interest Statement
1. Analyst ownership of the stock
2. Group/Directors ownership of the stock
3. Broking relationship with company covered
4. Investment Banking relationship with company covered
CESC
No
No
No
No
Analyst Certification
The views expressed in this research report accurately reflect the personal views of the analyst(s) about the subject securities or issues, and no part of the compensation of the research analyst(s) was, is, or
will be directly or indirectly related to the specific recommendations and views expressed by research analyst(s) in this report. The research analysts, strategists, or research associates principally responsible
for preparation of MOSt research receive compensation based upon various factors, including quality of research, investor client feedback, stock picking, competitive factors and firm revenues.
Regional Disclosures (outside India)
This report is not directed or intended for distribution to or use by any person or entity resident in a state, country or any jurisdiction, where such distribution, publication, availability or use would be contrary to
law, regulation or which would subject MOSt & its group companies to registration or licensing requirements within such jurisdictions.
For U.K.
This report is intended for distribution only to persons having professional experience in matters relating to investments as described in Article 19 of the Financial Services and Markets Act 2000 (Financial
Promotion) Order 2005 (referred to as "investment professionals"). This document must not be acted on or relied on by persons who are not investment professionals. Any investment or investment activity to
which this document relates is only available to investment professionals and will be engaged in only with such persons.
For U.S.
MOSt is not a registered broker-dealer in the United States (U.S.) and, therefore, is not subject to U.S. rules. In reliance on the exemption from registration provided by Rule 15a-6 of the U.S. Securities Exchange
Act of 1934, as amended (the "Exchange Act") and interpretations thereof by the U.S. Securities and Exchange Commission ("SEC") in order to conduct business with Institutional Investors based in the U.S.,
Motilal Oswal has entered into a chaperoning agreement with a U.S. registered broker-dealer, Marco Polo Securities Inc. ("Marco Polo").
This report is intended for distribution only to "Major Institutional Investors" as defined by Rule 15a-6(b)(4) of the Exchange Act and interpretations thereof by SEC (henceforth referred to as "major institutional
investors"). This document must not be acted on or relied on by persons who are not major institutional investors. Any investment or investment activity to which this document relates is only available to major
institutional investors and will be engaged in only with major institutional investors.
The Research Analysts contributing to the report may not be registered /qualified as research analyst with FINRA. Such research analyst may not be associated persons of the U.S. registered broker-dealer, Marco
Polo and therefore, may not be subject to NASD rule 2711 and NYSE Rule 472 restrictions on communication with a subject company, public appearances and trading securities held by a research analyst account.
Motilal Oswal Securities Ltd
3rd Floor, Hoechst House, Nariman Point, Mumbai 400 021
Phone: (91-22) 39825500 Fax: (91-22) 22885038. E-mail: reports@motilaloswal.com