15 February 2012
3QFY12 Results Update | Sector: Automobiles
Tata Motors
BSE SENSEX
17,849
Bloomberg
Diluted Eq.Shares (m)
52-Week Range (INR
1,6,12 Rel. Perf. (%)
M.Cap. (INR b)
M.Cap. (USD b)
S&P CNX
5,416
TTMT IN
3,347.7
272/138
18/61/13
896.9
18.2
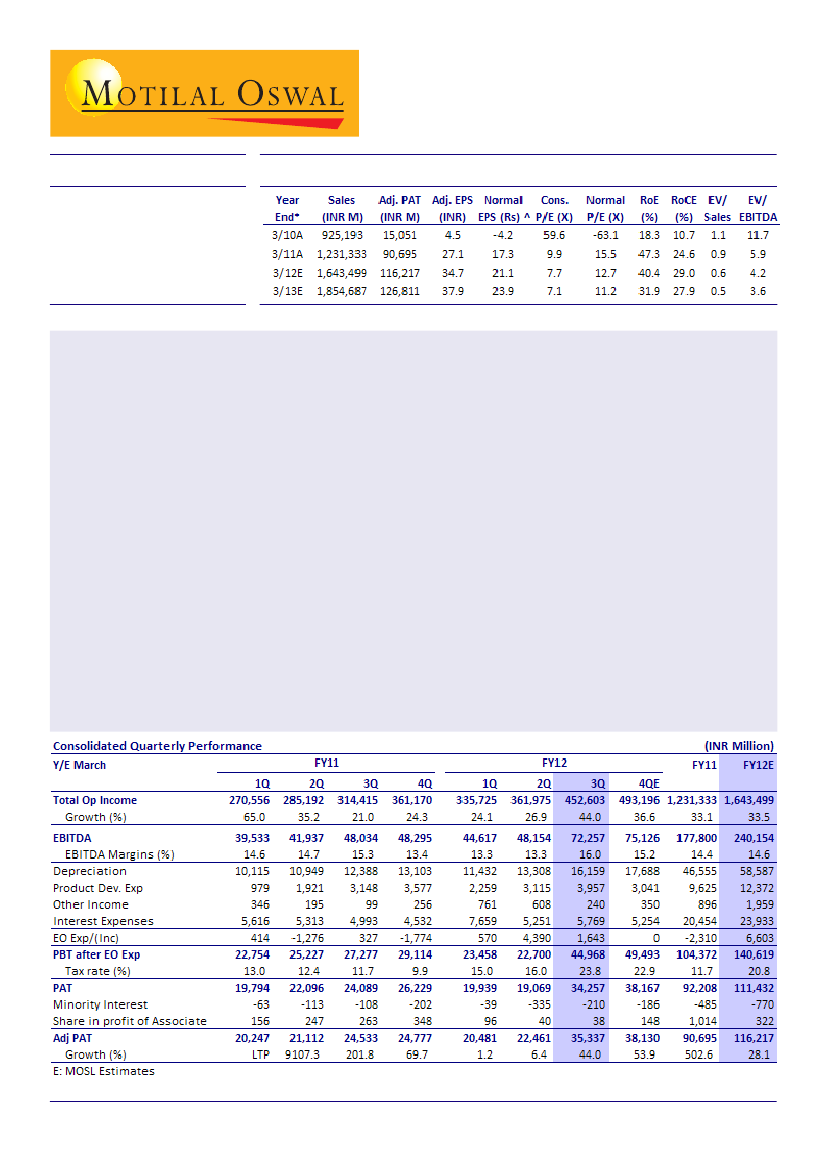
* Consolidated; ^ Normalized for capitalized expenses
CMP: INR268
TP: INR323
Buy
Tata Motors (TTMT) posted better than expected results for 3QFY12. Consolidated EBITDA margin for the
quarter was its best ever at 16% (v/s our estimate of 13.1%). Recurring PAT was INR35.4b (v/s our estimate of
INR29.3b). While JLR surprised positively, with its highest ever EBITDA margin, the performance of the domestic
business did not meet expectations.
Consolidated sales grew 44% YoY (25% QoQ) to INR453b (v/s our est. of INR451b). EBITDA margin was 16%
(+270bp QoQ, +70bp YoY). PAT grew 44% YoY to INR35.4b (v/s our est. of INR29.3b); growth was restricted due
to higher than estimated depreciation and tax rate. TTMT posted net MTM forex loss of INR1.6b, after reversal
of 1HFY12 loss of INR6.6b.
JLR's revenue grew 41% YoY (28% QoQ) to GBP3.7b (v/s est. of GBP3.7b). EBITDA margin expanded by 520bp
QoQ and 270bp YoY to 20.1% (v/s est. of 15.8%), led by favorable currency movement (+90bp QoQ), better
product and market mix, higher operating leverage and revaluation of forex liability (+160bp QoQ). JLR's PAT
grew 85% QoQ and 60% YoY to GBP440m (v/s est. of GBP336m, and GBP238m in 2QFY12) despite higher tax.
Standalone volumes grew 19% YoY (9% QoQ). However, realizations declined ~1% YoY (5.8% QoQ) due to
adverse product mix, resulting in revenue growth of 18% YoY (3% QoQ) to INR133b (v/s our estimate of
INR141b). Further, higher marketing spend led to margin contraction of 410bp YoY and 50bp QoQ. Lower
interest and tax boosted adjusted PAT to INR2.5b (v/s estimate of INR3b) - a decline of 42% YoY and 11% QoQ.
We upgrade our consolidated normalized EPS estimates by 13% for FY12 to INR21.1 and by 8% for FY13 to
INR23.9. The stock trades at 7.1x FY13E consolidated EPS and 11.2x FY13E normalized consolidated EPS. Maintain
Buy
with revised target price is INR323 (FY13E SOTP-based).
Jinesh Gandhi
(Jinesh@MotilalOswal.com) + 91 22 3982 5416
Mansi Varma
(Mansi.Varma@MotilalOswal.com) + 91 22 3982 5418

Tata Motors
Standalone: margins contraction of 50bp QoQ impacted by deteriorating
product mix and higher marketing expenses in PV
Standalone volumes up 9% QoQ (19% YoY) to 231,328, with 32% YoY growth in PV
and 12% in CV. 3QFY12 volumes were impacted by disturbance at Pantnagar plant
in Oct-11 (riots) and in Dec-11 (shutdown for expansion).
Realizations de-grew 5.8% QoQ (0.7% YoY) led by deterioration in product mix
with higher contribution of passenger cars. As a result, revenues grew by 3% QoQ
(18% YoY) to INR133b.
EBITDA margins contracted by 50bp QoQ to 6.7% (410bp YoY, v/s est 7.2%), impacted
by adverse product mix and higher marketing spend in PV business. While RM
cost remained stable QoQ (up 240bp YoY), other expenses increased by 40bp QoQ
(up 130bp YoY).
EBITDA at INR9b (v/s est INR10.2b) de-grew by 4% QoQ (26% YoY). Lower Interest
cost and tax boosted adj PAT to INR2.5b (v/s est INR3.0b) – de-growth of 42% YoY
(10% QoQ).
However, net MTM forex loss of INR833m (after reversal of 1HFY12 forex loss of
INR2.08b) restricted reported PAT to INR1.74m.
Trend in segment mix*
Segment
3QFY12
3QFY11
51,787
26.7
75,965
39.1
127,752
65.8
56,697
29.2
9,636
5.0
194,085
YoY (%)
4.3
18.0
12.4
29.9
45.9
19.2
2QFY12
QoQ (%)
M&HCVs
53,988
Contribution (%)
23.3
LCVs
89,654
Contribution (%)
38.8
Total CVs
143,642
Contribution (%)
62.1
Cars
73,628
Contribution (%)
31.8
UVs
14,058
Contribution (%)
6.1
Total Volumes
231,328
* Including sale of FIAT vehicles
15 February 2012
54,356
-0.7
25.7
90,158
-0.6
42.6
144,514
-0.6
68.4
56,581
30.1
26.8
10,305
36.4
4.9
211,400
9.4
Source: Company/MOSL
2

Tata Motors
Trend in Standalone EBITDA
EBITDA (INR m)
13.4
11.4
12.8
10.1
11.3
10.0
EBITDA Ma rgi n (%)
10.8
8.3
8.4
7.2
6.7
1Q
2Q
FY10
3Q
4Q
1Q
2Q
FY11
3Q
4Q
1Q
2Q
FY12
3Q
Source: Company/MOSL
JLR: Robust volumes, better product and market mix and favorable Fx drives
strong operating performance
JLR’s wholesale volumes grew 37% YoY (27% QoQ) to 86,317, led by 42% YoY (30%
QoQ) growth in LR volumes, boosted by Evoque at 24,277. Jaguar volumes grew by
16% YoY (15% QoQ) led by higher sales of XF with 2.2ltr diesel engine. JLR’s retail
volumes were also robust at 34% YoY (19% QoQ), led by strong recovery across
regions, especially China (58%). As a result, contribution of China, its most
profitable market, increased to 17.2% of wholesale volumes (v/s 13% in 3QFY11
v/s 16% in 2QFY12).
Against expectations of a fall in realizations due to higher Evoque volumes, average
realizations were up by ~1% QoQ (3% YoY) at GBP43,396/unit (v/s est GBP43,325),
driven by a) lower volumes of Freelander (at discount to Evoque), b) better market
mix with China comprising 17.2% of JLR volumes and c) weaker GBP v/s USD.
EBITDA margins improved by ~520bp QoQ (270bp YoY) to 20.1%, led by a) ~90bp
improvement due to favourable currency impact on operations, b) favourable
market and product mix (~50bp), c) operating leverage (~220bp), d) gain of GBP60m
(~160bp) on revaluation of forex liability. EBITDA grew by 62% YoY (72% QoQ) to
GBP752m (v/s est GBP590m). EBIDTA margins under IFRS improved ~260bp QoQ to
17% (unlike IGAAP, IFRS doesn’t recognize Fx revaluation and accounts for product
development above EBITDA). However, higher tax rate (due to higher contribution
from China) restricted PAT to GBP440m (v/s est GBP336m).
EBITDA margin are expected to remain at higher levels led by a) favourable trend
in forex movement, b) better market mix with increasing contribution from China,
and c) higher operating leverage.
Jaguar: Trend in market mix (Retail)
Land Rover: Trend in market mix (Retail)
15 February 2012
3

Tata Motors
Jaguar: XF key volume driver (Retail)
LR: Evoque key volume contributor (Retail)
Trend in JLR realizations (GBP/unit)
Trend in JLR'S EBITDA
Source: Company/ MOSL
Evoque volumes continue to remain strong, better market mix to drive
margins
The management is cautiously optimistic on demand outlook for premium cars in
FY13 with anticipation of strong growth in Russia and North America. China is
expected to grow, albeit at a normalized pace with growth likely to be in 13-15%
4
15 February 2012

Tata Motors
range. However, Europe and UK could witness flat growth or de-growth in FY13.
Volumes are expected to remain strong in FY13, led by a) favorable response for
Evoque (it maintained its guidance of 70,000-80,000 units Evoque sales for full
year) and b) higher volumes of Freelander, as its production was impacted due to
supply constraints as the company chose to divert its resources towards production
of Evoque.
Based on the current Fx rates, 4QFY12 margins could see a sequential expansion
of ~60bp. Additionally, EBITDA margins are also expected to improve, driven by
better market mix with increasing contribution from China. Evoque was launched
in China in mid Nov-11 and hence 3QFY12 does not fully reflects its impact on
volumes.
Performance of other subsidiaries improves
TML Finance:
Vehicle financing disbursals for 3QFY12 improved by 59%YoY to INR29
b. The book size at the end of Dec-11 for TMFL and TML (Vehicle Financing) stood
at INR142b and INR9.7b respectively. It enjoyed NIM of 8.4% for 9MFY12. 3QFY12
PAT doubled to INR706m.
TML Drivelines:
Growth in domestic CV market led to 19% YoY growth in revenues
to INR1.7b. EBITDA margins improved by 520bp YoY to 60.9%. Adj PAT stood at
INR608m (+47% YoY).
Tata Daewoo:
Net sales grew by 7% YoY to INR7b led by 3% YoY de-growth in
volumes. EBITDA margins at 4.5% (-80bp) translated into net loss of INR10m (-77%
YoY).
Trend in performance of key subsidiaries (INR m)
3QFY12
301,460
7,045
4,392
5,240
1,743
Revenues
YoY (%)
59.6
7.0
40.3
57.9
19.4
QoQ (%)
38.9
-21.9
18.2
11.2
5.4
EBITDA Margins (%)
3QFY12
YoY (BP) QoQ (BP)
20.1
270
520
4.5
80
130
17.9
540
340
18.1
720
380
60.9
520
140
3QFY12
35409
-10
582
706
608
PAT
YoY (%)
QoQ (%)
89.3
100.7
-77.3
-138.5
105.7
20.2
115.2
34.7
46.5
10.7
Source: Company/MOSL
JLR
Tata
Tata
Tata
TML
Daewoo
Technologies
Motor Finance
Drivelines
Other highlights
Despite significant FCF generation of ~GBP400m in JLR in 3QFY12, the consolidated
automotive net debt remained unchanged at INR150b, translating into net
debt:equity of 0.56x.
It clarified that pricing environment in China continues to be remain healthy, JLR’s
incentives in China remain at lower levels.
The company also highlighted that it continues to face competitive and tough
market conditions in passenger car segment.
It indicated that there is no change in its recently announced program of future
product development and improvement involving investment in research, design
and technical innovation. Annual capital spending (including capitalized product
development costs) is expected to increase to approx. GBP 1.5b in FY12, with over
50% of which is expected to be R&D and balance is expected to be capex.
It also plans to invest GBP355m over next 3 years for an engine plant at
Wolverhampton, UK to manufacture all-new, advanced technology, low emissions
engines. This plant would manufacture 4 cylinder petrol and diesel engines.
5
15 February 2012

Tata Motors
Upgrading consolidated EPS by 8-13%
We are upgrading our consolidated normalized EPS estimates by 13% for FY12 to
INR21.1 and 8% for FY13 to INR23.9 to model: a) strong volume momentum in JLR
and domestic PV business, b) favorable market and product mix, alongwith
favorable Fx, c) higher cost push in domestic business, d) higher tax in JLR and
lower tax in India business and e) benefit of weak INR on JLR consolidation. Our
estimates factor the following:
For JLR, we model volumes of 309,071 units in FY12 (~27% growth) and 358,700
units in FY13 (~16% growth). Our FY13 volume requires current volume run-rate of
30,000 units/month to sustain in FY13. We estimate EBITDA margins of 17.5%
(earlier estimate of 15.8%) and PAT of GBP1.5b in FY13.
Standalone estimates factor in for ~10% growth in volumes in FY12 and 11% in
FY13, with 11.8% growth for CVs and ~9.4% growth in PV volumes for FY13. We
model EBITDA margin improvement of 60bp in FY12 to 8% (v/s earlier estimate of
8.3%) for FY13.
Revised Forecast (INR M)
Rev
Consolidated - Key Assumptions
Net Sales
EBITDA Margins (%)
Net Profit
Cons EPS
Normal. EPS
JLR - Key Assumptions
Volumes
Normal. EBITDA
EBITDA Margins (%)
Net Profit
Standalone - Key Assumptions
Volumes
EBITDA
EBITDA Margins (%)
Net Profit
1,643,499
14.6
116,217
34.7
21.1
309,071
120,937
17.5
101,885
917,367
40,258
7.4
14,155
FY12E
Old
1,625,575
13.3
104,818
31.3
18.6
305,682
101,478
15.4
85,916
912,824
41,289
7.6
14,328
Chg (%)
1.1
130bp
10.9
10.9
13.0
1.1
19.2
210bp
18.6
0.5
-2.5
-20bp
-1.2
Rev
1,854,687
14.5
126,811
37.9
23.9
358,700
144,988
17.5
112,581
1,017,853
48,876
8.0
18,496
FY13E
Old
1,815,622
13.3
116,345
34.8
22.2
342,354
125,337
15.8
99,236
999,850
50,774
8.3
20,574
Chg (%)
2.2
120bp
9.1
9.0
7.8
4.8
15.7
170bp
13.4
1.8
-3.7
-30bp
-10.1
Source: MOSL
Valuation and view
JLR’s operating performance has continued to improve sharply driven by improving
product mix, cost cutting initiatives and favorable forex movement.
CV volumes in domestic business continues to be robust and lends stability to
domestic business. However, pressure on its car business would continue to put
pressure on standalone performance.
The stock is currently trading at 7.1x FY13E consolidated EPS and 11.2x FY13E
normalized consolidated EPS. The DVR stock trades at 3.5x FY13 consolidated EPS
and 5.6x normalized EPS.
We upgrade our target price and now assign higher multiple (4x EV/EBITDA v/s 3x
earlier) to JLR. Our revised TP is INR323 (FY13 SOTP based) for ordinary share and
INR226 for DVR (~30% discount to ordinary share’s TP).
15 February 2012
6

Tata Motors
Tata Motors: Sum-of-the-parts (INR b)
Valuation Parameter
Tata Motors - Standalone
EV/EBITDA
JLR (Adj for R&D capitalization)
EV/EBITDA
HV Axles
EV/EBITDA
HV Transmission
EV/EBITDA
Tata Technologies
EV/EBITDA
Tata Daewoo
EV/EBITDA
Total EV
Less: Net Debt (Ex FCCB & TMFL)
Add: Other Investments
Tata Motors Finance
P/BV
Other Associates/JVs
Carrying Cost
Tata Sons
20% discount to mkt value
Total Equity Value
Fair Value (INR/Sh) - Ord Sh
Fully Diluted
Upside (%)
Fair Value (INR/Sh) - DVR
@ 30% discount
Upside (%)
Multiple (x)
7
4
4
4
4
4
FY12E
282
525
9
8
10
6
840
43
FY13E
342
622
9
9
10
10
1,003
5
1
21
23
7
8
50
50
875
1,080
261
323
(2.5)
20.4
183
226
37.0
69.2
Source: Company/MOSL
15 February 2012
7

Tata Motors
Tata Motors: an investment profile
Company description
Tata Motors (TTMT) is the largest commercial vehicle
manufacturer in India, with 60% market share in MHCVs
and 63% market share in LCVs. It also manufactures
passenger cars and utility vehicles. In FY09, it acquired
Jaguar and Land Rover (JLR) from Ford for USD2.5b. In
FY11, JLR contributed 56% of TTMT's consolidated
revenue and ~79% of profit. This coupled with Tata
Daewoo, makes TTMT a global player in the automobile
industry.
Key investments risks
Scaling up volumes of Jaguar in a highly competitive
luxury car segment. Also, slowdown in demand in
US and UK (~40% of JLR volumes) and adverse forex
movement could adversely impact JLR's profitability.
Higher interest rates, diesel prices and slowdown in
the economy would impact CV demand in India.
Recent developments
Increased price of P.V by ~1% in Feb-12.
Key investment arguments
We expect JLR volumes to remain robust, driven by
the launch of Evoque, model year 2012 XF and ramp
up of operations in China, its most profitable market.
We factor in 16% volume growth to ~359,00 units in
FY13.
Improving market mix, internal cost efficiencies and
sourcing from low cost countries would dilute higher
cost pressures on JLR. We expect JLR's EBITDA margin
to remain stable at 17.5% in FY13.
Demand for LCVs in India is likely to remain robust,
despite slowdown in M&HCV demand. We model
volume growth of 11.8% for the CV business in FY13.
Reduction in financial gearing due to equity issue,
internal accruals and monetization of investments,
will aid reduction in financial gearing.
Comparative valuations
TML
P/E (x)
EPS Gr (%)
RoE (%)
EV/EBITDA (x)
FY12E
FY13E
FY12E
FY13E
FY12E
FY13E
FY12E
FY13E
12.7
11.2
28.1
9.1
40.4
31.9
4.2
3.6
M&M
15.7
14.3
6.2
9.7
20.9
19.6
8.0
6.8
Maruti
26.1
18.2
-39.4
43.7
9.3
12.1
12.2
8.5
Valuation and view
The stock is currently trading at 7.1x FY13E
consolidated EPS and 11.2x FY13E normalized
consolidated EPS. The DVR stock trades at 3.5x FY13
consolidated EPS and 5.6x normalized EPS.
Buy
with a target price of INR323 for ordinary shares
(FY13E-based SOTP).
Sector view
Passenger vehicle segment is expected to continue
its growth momentum. With low car penetration
levels in India, the upside potential for growth is
tremendous.
The CV segment growth expected to slow-down
after strong growth in FY11.
JLR volumes are expected to remain strong driven
by strong growth in US, China and Russia.
EPS: MOSL forecast v/s consensus (INR)
MOSL
Consensus
Forecast
forecast
FY12
FY13
36.2
38.2
29.4
32.2
Variation
(%)
23.1
18.9
Target price and recommendation
Current
Price (INR)
268
Target
Price (INR)
323
Upside
(%)
20.6
Reco.
Buy
Stock performance (1 year)
300
Tata Motors
Sens ex - Reba s ed
Shareholding pattern (%)
Dec-11
Promoter
Domestic Inst
Foreign
Others
15 February 2012
35.1
14.3
42.1
8.5
Sep-11
35.1
15.0
41.2
8.7
Dec-10
35.0
13.7
43.2
8.1
250
200
150
100
Feb-11
Ma y-11
Aug-11
Nov-11
Feb-12
8

Tata Motors
Financials and Valuation
15 February 2012
9

Disclosures
This report is for personal information of the authorized recipient and does not construe to be any investment, legal or taxation advice to you. This research report does not constitute an offer, invitation or inducement
to invest in securities or other investments and Motilal Oswal Securities Limited (hereinafter referred as MOSt) is not soliciting any action based upon it. This report is not for public distribution and has been
furnished to you solely for your information and should not be reproduced or redistributed to any other person in any form.
Unauthorized disclosure, use, dissemination or copying (either whole or partial) of this information, is prohibited. The person accessing this information specifically agrees to exempt MOSt or any of its affiliates
or employees from, any and all responsibility/liability arising from such misuse and agrees not to hold MOSt or any of its affiliates or employees responsible for any such misuse and further agrees to hold MOSt
or any of its affiliates or employees free and harmless from all losses, costs, damages, expenses that may be suffered by the person accessing this information due to any errors and delays.
The information contained herein is based on publicly available data or other sources believed to be reliable. While we would endeavour to update the information herein on reasonable basis, MOSt and/or its
affiliates are under no obligation to update the information. Also there may be regulatory, compliance, or other reasons that may prevent MOSt and/or its affiliates from doing so. MOSt or any of its affiliates or
employees shall not be in any way responsible and liable for any loss or damage that may arise to any person from any inadvertent error in the information contained in this report . MOSt or any of its affiliates
or employees do not provide, at any time, any express or implied warranty of any kind, regarding any matter pertaining to this report, including without limitation the implied warranties of merchantability, fitness
for a particular purpose, and non-infringement. The recipients of this report should rely on their own investigations.
This report is intended for distribution to institutional investors. Recipients who are not institutional investors should seek advice of their independent financial advisor prior to taking any investment decision
based on this report or for any necessary explanation of its contents.
MOSt and/or its affiliates and/or employees may have interests/positions, financial or otherwise in the securities mentioned in this report. To enhance transparency, MOSt has incorporated a Disclosure of Interest
Statement in this document. This should, however, not be treated as endorsement of the views expressed in the report.
Disclosure of Interest Statement
1. Analyst ownership of the stock
2. Group/Directors ownership of the stock
3. Broking relationship with company covered
4. Investment Banking relationship with company covered
Tata Motors
No
No
No
No
Analyst Certification
The views expressed in this research report accurately reflect the personal views of the analyst(s) about the subject securities or issues, and no part of the compensation of the research analyst(s) was, is, or
will be directly or indirectly related to the specific recommendations and views expressed by research analyst(s) in this report. The research analysts, strategists, or research associates principally responsible
for preparation of MOSt research receive compensation based upon various factors, including quality of research, investor client feedback, stock picking, competitive factors and firm revenues.
Regional Disclosures (outside India)
This report is not directed or intended for distribution to or use by any person or entity resident in a state, country or any jurisdiction, where such distribution, publication, availability or use would be contrary to
law, regulation or which would subject MOSt & its group companies to registration or licensing requirements within such jurisdictions.
For U.K.
This report is intended for distribution only to persons having professional experience in matters relating to investments as described in Article 19 of the Financial Services and Markets Act 2000 (Financial
Promotion) Order 2005 (referred to as "investment professionals"). This document must not be acted on or relied on by persons who are not investment professionals. Any investment or investment activity to
which this document relates is only available to investment professionals and will be engaged in only with such persons.
For U.S.
MOSt is not a registered broker-dealer in the United States (U.S.) and, therefore, is not subject to U.S. rules. In reliance on the exemption from registration provided by Rule 15a-6 of the U.S. Securities Exchange
Act of 1934, as amended (the "Exchange Act") and interpretations thereof by the U.S. Securities and Exchange Commission ("SEC") in order to conduct business with Institutional Investors based in the U.S.,
Motilal Oswal has entered into a chaperoning agreement with a U.S. registered broker-dealer, Marco Polo Securities Inc. ("Marco Polo").
This report is intended for distribution only to "Major Institutional Investors" as defined by Rule 15a-6(b)(4) of the Exchange Act and interpretations thereof by SEC (henceforth referred to as "major institutional
investors"). This document must not be acted on or relied on by persons who are not major institutional investors. Any investment or investment activity to which this document relates is only available to major
institutional investors and will be engaged in only with major institutional investors.
The Research Analysts contributing to the report may not be registered /qualified as research analyst with FINRA. Such research analyst may not be associated persons of the U.S. registered broker-dealer, Marco
Polo and therefore, may not be subject to NASD rule 2711 and NYSE Rule 472 restrictions on communication with a subject company, public appearances and trading securities held by a research analyst account.
Motilal Oswal Securities Ltd
3rd Floor, Hoechst House, Nariman Point, Mumbai 400 021
Phone: (91-22) 39825500 Fax: (91-22) 22885038. E-mail: reports@motilaloswal.com