15 February 2012
3QFY12 Results Update | Sector: Healthcare
Sun Pharmaceuticals
BSE SENSEX
S&P CNX
17,849
Bloomberg
Equity Shares (m)
52-Week Range (INR)
1,6,12 Rel. Perf. (%)
M.Cap. (INR b)
M.Cap. (USD b)
5,416
SUNP IN
1,035.6
566/404
-3/10/31
573.7
11.6
CMP: INR554
TP: INR614
Neutral
* Including Para-IV/one-off upsides
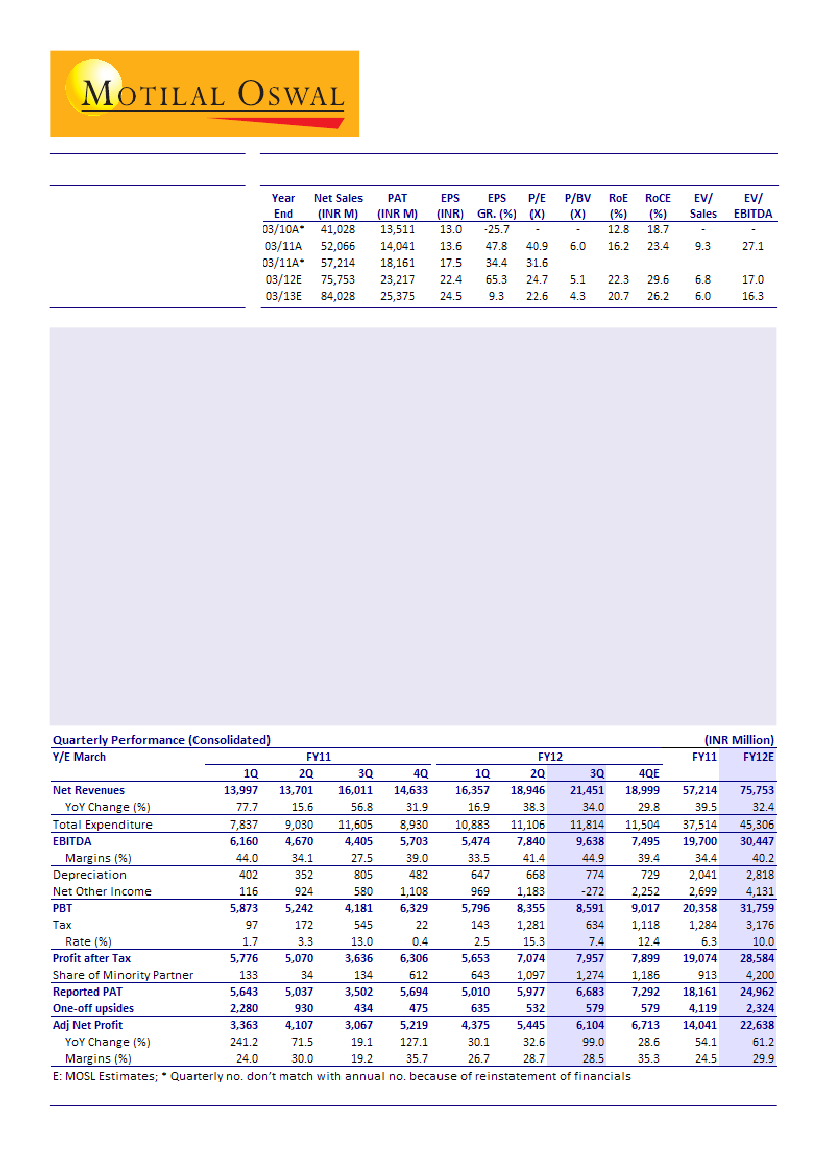
Results beat estimates:
Sun Pharma's (SUNP) 3QFY12 performance was significantly better than our
expectations. Net sales grew 34% YoY to INR21.45b partly driven by Taro's strong performance and favorable
currency. EBITDA surged 119% YoY to INR9.64b with EBITDA margin at 44.9% compared to 27.5% for 3QFY11.
Reported PAT (including one-offs) increased 91% YoY to INR6.68b, higher than our estimate of INR5.1b.
US formulations business boosts core topline:
Core topline growth was driven mainly by the robust
performance in US formulations business (up 63% YoY) led by Taro and favorable currency. Domestic formulation
revenues grew 8.6% YoY. Excluding the one-off upsides, core US formulation business is estimated to have
grown by a healthy 77.6% YoY. Formulation exports to RoW markets grew 27% YoY.
Better operational performance:
Core EBITDA (excl. one-offs) is estimated to have grown 137% YoY to INR8.9b
(v/s est. of INR5.7b), while core EBITDA margin is estimated at 43.7% (v/s est. of 33.5%). Excluding one-offs,
adj. PAT at INR6.1b (up 99% YoY) was higher than estimate of INR4.78b due to better operational performance.
Outlook and view:
An expanding generic portfolio, coupled with sustained double-digit growth in high-
margin life-style segments in India, is likely to translate into long-term benefits for SUNP.
Key drivers for
future:
(1) Ramp-up in US business and resolution of Caraco's cGMP issues; (2) Monetization of the Para-IV
pipeline in the US; (3) Launch of controlled substances in the US and (4) Sustaining Taro's high profitability.
Valuations:
The stock is valued at 24.7x FY12E and 22.6x FY13E core earnings. While we are positive on SUNP's
business outlook, stiff valuations have tempered down our bullishness. Maintain
Neutral
rating with a TP of
INR614 (25x FY13E EPS), despite the robust strong 3QFY12 performance. Inorganic initiatives (SUNP has cash
of ~USD1b) would be the key risk to our rating.
Nimish Desai
(NimishDesai@MotilalOswal.com); Tel: +91 22 3982 5406
Amit Shah
(Amit.Shah@MotilalOswal.com); Tel: + 91 22 3982 5423

Sun Pharmaceuticals
Performance driven by Taro and favourable currency
Net Sales grew by 34%YoY to INR21.45b partly driven by strong performance of Taro
and favourable currency. EBITDA increased by 119% YoY to INR9.64b with EBITDA
Margins at 44.9% v/s 27.5% for 3QFY11. Reported PAT (incl one-offs) at INR6.68b was
up 91% YoY v/s estimate of INR5.1b.
Excluding the contribution of one-off revenues, core topline is estimated to have
grown by 37% YoY to INR20.36b. Domestic formulation revenues grew 8.6% YoY to
INR6.96b (v/s est of Rs7b). The company has stated that, excluding third party business
which has been discontinued, underlying growth was at 22% for the quarter.
US formulations business grew by 63.1% YoY to INR10.4b led by strong performance at
Taro, favorable currency, better than estimated revenues from one-off opportunities
and market share gain in few products. Excluding one-off upsides, core US formulation
business is estimated to have grown by 77.6% YoY to INR9.3b.
Formulation exports to RoW market grew by 27% YoY to INR2.8b. We note that the
RoW formulation business this quarter also includes Taro's revenue from outside US.
Revenue mix (INR m)
Formualtions
India
US
RoW
API
Others
Net Revenues
3QFY12
20,166
6,956
10,400
2,810
1,536
17
21,720
3QFY11
14,992
6,403
6,376
2,213
1,136
4
16,132
YoY (%)
34.5
8.6
63.1
27.0
35.2
324.4
34.6
2QFY11
17,604
7,046
7,991
2,567
1,603
4
19,211
QoQ (%)
14.6
-1.3
30.1
9.5
-4.2
324.4
13.1
Source: Company/MOSL
Core EBITDA above estimates driven by higher margin expansion at Taro
Reported EBITDA increased by 118.8% YoY to INR9.64b with EBITDA margins at 44.9%
v/s 27.5% for 2QFY11. Core EBITDA (excluding the contribution of one-off
opportunities) is estimated to have grown by 137% YoY to INR8.9b (v/s est of 5.7b)
while core EBITDA margins are estimated at 43.7% (v/s est. of 33.5%).
Trend in EBITDA margins
Source: Company/MOSL
15 February 2012
2

Sun Pharmaceuticals
3QFY12 EBITDA Margins are above estimates due to
Price increases for some of Taro's products
- which have resulted in very high
profitability for Taro (50.3% EBITDA margins vs 44.8% sequentially). We believe
that Taro has been able to undertake price increases mainly due to exit of certain
competitors due to supply chain and US FDA related issues. This implies that the
higher product prices will be sustainable only till these competitors remain absent
from the market. We believe that Taro will be able to sustain these higher margins
for another 2-3 quarters by which time the competitive intensity is likely to
increase.
Depreciation of the INR vs the USD
seems to have positively impacted the RM
inventory valuations thus boosting gross margins and EBITDA margins on a
consolidated basis.
In the past SUN has reported such high profitability (overall 44.9% EBITDA margins)
when there was significant contribution from one-offs in the US. However, for
3QFY12, SUN has reported similar profitability without any large one-offs, which
although is a positive but may not be sustainable.
Taro - Strong performance
Taro has reported very strong 4QCY11 performance with topline growth of 44%, EBITDA
growth of 245%, EBITDA Margins at 50.3% and PAT growth of 454%. Sequentially, it has
reported 7% topline growth, 20.2% EBITDA growth and 6.5% PAT growth.
The significant improvement in EBITDA margins was led by price increases, lower
SG&A expenses and flat R&D expenses. PAT growth was aided by improvement in
operational performance as well as significant reduction in effective tax rate at 6.8%
vs 32.5% YoY and 23.8% sequentially.
Taro management has indicated that a significant portion of the growth in net sales
and profits was derived from price increases on select products in the US market and
may not be sustainable. We believe that Taro has been able to take price increases in
certain key products in the US market due to absence of competition from the market.
These competitors may come back to the market after resolving their supply issues
and hence the high profitability at Taro may not be sustainable.
During the quarter, Taro filed an one ANDA with the USFDA taking the total filings to
3 for CY11. It has also received approvals for 7 products during the year. It currently has
a pipeline of 23 products (including four tentative approvals) and one New Drug
Application awaiting final USFDA approval. As of 31-Dec-2011, Taro had cash of
USD242m (excluding restricted bank deposits) and debt of USD44.7m.
Upgrades FY12 guidance
Management has upgraded its topline growth guidance for FY12 from 28-30% to 32-
34% given the strong 3QFY12 performance. The strong growth will be partly driven by
full-year consolidation of Taro financials as compared to a little over two quarters for
FY11. Management has indicated that the high EBITDA margins recorded in 3QFY12
are not likely to sustain in the long-term.
R&D expenses will be at ~6% of sales. Capex is estimated at INR4.0-4.5b while the
company has guided for increasing tax rate (not quantified) going forward.
15 February 2012
3

Sun Pharmaceuticals
Caraco US FDA resolution is likely to be long-drawn
While there is no fresh update on the US FDA resolution at Caraco, the company has,
in the past, indicated that the process will be very gradual. We are estimating part-
recovery in Caraco's core US revenues from FY13 onwards based on the assumption
that the US FDA issues will get resolved over the next few quarters. The on-going US
FDA issues have adversely impacted Caraco's core revenues (excluding distributed
products revenues) for the past two years.
Caraco revenue trend (USD M)
Source: Company/MOSL
Domestic formulations to sustain 15-20% growth; Emerging markets
portfolio to grow at 20-30% CAGR
Given its strong positioning in the lifestyle segment, we expect Sun to sustain its
growth momentum in the domestic formulations business. It is among the top players
in the CNS, CVS, Gastro, Ophthalmology and Orthopedics segments. This business
has grown at 17-18% CAGR for FY08-11 and we expect the company to sustain this
growth rate till FY13E. Absence of contract manufacturing revenues (which contributed
INR630m to sales in FY11) will partly temper down domestic formulations growth for
FY12. We also believe that SUNP's emerging markets revenues are likely to grow at
20-30% CAGR over next two years given its plans to increase its penetration in key
markets.
Sun - Emerging Mkt Sales to grow at 20% CAGR (INR m)
Sun: Domestic Formulations - sustained momentum (INR m)
Source: Company/MOSL
15 February 2012
4

Sun Pharmaceuticals
Proposes to acquire all Taro outstanding shares; Potential cash outflow of
USD368m; No major financial impact
SUNP has proposed to buy out all outstanding shares of Taro at a price of USD24.5/.
This offer is subject to the approval of Taro Board of Directors, shareholder approval
and other regulatory approvals. SUNP currently holds 66% stake in Taro. A buy out of
all outstanding shares (~15m shares) for USD24.5/share is likely to result in an outflow
of USD368m for SUNP. SUNP's consolidated financials already include 100%
consolidation for Taro along with minority interest for the 34% public holding.
Acquisition of all outstanding Taro shares will make it a 100% subsidiary of SUNP and
hence will result in reduction in the minority interest currently being charged to the
P&L. SUNP's interest income will also reduce to the extent of utilization of cash of
USD368m for this acquisition. Taking in account both these factors, we expect a
negligible impact in our FY13 EPS estimates if SUNP is successful in acquiring 100%
stake in Taro.
SUNP has invested USD252m till date for acquiring the 66% stake in Taro. If SUNP buys
out minority shareholders in Taro for USD368m, the total cost for acquiring 100% stake
in Taro will be ~USD620m. This will imply a valuation of 1.23x EV/Sales and 3x EV/
EBITDA on Taro's CY11 reported financials. Based on our CY12 estimates for Taro, the
acquisition valuation will be 1.19x EV/Sales and 3.3x EV/EBITDA which we believe, is
attractive compared to some of the expensive acquisitions made by its peers in the
past. However, this may prompt the minority shareholders of Taro to reject SUNP's
offer as being too low and they may ask for a higher valuation. We await further
clarity on the same.
Raising earnings estimates
Post the 3QFY12 results and concall, we have raised our FY12E EPS by 14.7% and FY13E
EPS by 8.5%. We note that the upgrade in FY12 numbers are higher compared to FY13
numbers due to
1) We believe that the profitability of Taro are unlikely to sustain at current levels
anticipating increased competition 2-3 quarters down the line.
2) The currency depreciation benefit in the raw material cost during the quarter will
not be recurring unless INR depreciates further from current levels
We expect core EPS of INR22.4 for FY12E (up 65.3%) mainly led by Taro and INR24.5 for
FY13E (up 9.3%). Excluding one-off upsides, EPS growth for FY13 will be 12% (tempered
down by our expectation of normalization of Taro's profitability to lower levels).
Revised Forecast (INR m)
Rev
73,257
23,217
22.4
FY12E
Old
68,229
20,229
19.5
Chg (%)
7.4
14.8
14.8
Rev
84,028
25,375
24.5
FY13E
Old
78,251
23,380
22.6
Chg (%)
7.4
8.5
8.5
Source: MOSL
Net Sales
Net Profit
EPS (INR)
15 February 2012
5

Sun Pharmaceuticals
Valuation and view
An expanding generic portfolio coupled with sustained double-digit growth in high-
margin life-style segments in India is likely to bring in long-term benefits for SUNP. Its
ability to sustain superior margins even on a high base is a clear positive.
Key drivers for future include:
1.
2.
3.
4.
Ramp-up in US business and resolution of Caraco's cGMP issues
Monetization of the Para-IV pipeline in the US
Launch of controlled substances in the US.
Sustaining Taro's high profitability
The stock is valued at 24.7x FY12E and 22.6x FY13E core earnings. While we are positive
on SUNP's business outlook, rich valuations have tempered down our bullishness.
Price increases for certain products by Taro (due to absence of competition), positive
impact of a favourable currency and translation benefits in RM costs were the key
reasons for the significant increase in growth and profitability for SUNP in 3QFY12. Of
these, the currency has commenced a reversal and we also believe that the significant
jump in profitability at Taro is not sustainable in the long-term and that it is likely to
reverse post 2HFY13. Our estimates take in to account this potential reversal. Given
these potential downsides, we maintain
Neutral
with TP of INR614 (25x FY13 EPS)
despite a strong 3QFY12 performance. Inorganic initiatives (SUNP has cash of ~USD1b)
is the key risk to our rating.
15 February 2012
6

Sun Pharmaceuticals
Sun Pharmaceuticals: an investment profile
Company description
Sun Pharma is among the largest players in the domestic
formulations market and the most profitable one. It
makes and markets specialty medicines and APIs for
chronic therapy areas such as cardiology, psychiatry,
neurology, etc. Sun has forayed into regulated markets
by acquiring majority stake in Caraco Pharma and has
strengthened its presence in US by acquisition of Taro.
Capability to scale up exports, particularly to
unregulated markets, is yet to be fully
demonstrated.
Recent developments
Proposed acquisition of all outstanding shares of
Taro
Launch of generic Taxotere and Gemzar in US
Key investment arguments
Ability to identify niches in long term therapy areas
with high entry barriers and build strong franchise
to ensure sustainable growth and high margins.
Sustaining superior profitability on higher base is a
strong positive.
One of the strongest ANDA pipelines from India with
148 ANDAs pending approval. The pipeline includes
a combination of low-competition, patent challenge
and normal product opportunities.
Valuation and view
The stock is valued at 24.7x FY12E and 22.6x FY13E
core earnings. Earnings growth is likely to improve
post the resolution of Caraco's problems.
Maintain Neutral.
Sector view
Emerging markets and USA would remain the key
sales and profit drivers in the medium term. Japan is
expected to emerge as the next growth driver for
generics in the long-term.
We are overweight on companies that are towards
the end of the investment phase, with benefits
expected to start coming in from the next fiscal.
Key investment risks
Unresolved USFDA issues related to Caraco's
manufacturing facilities will continue to impact sales
in the US and pending ANDA approvals from that
facility.
Comparative valuations
P/E (x)
P/BV (x)
EV/Sales (x)
EV/EBITDA (x)
FY12E
FY13E
FY12E
FY13E
FY12E
FY13E
FY12E
FY13E
Sun Pharma
24.7
22.6
5.1
4.3
6.8
6.0
17.0
16.3
Ranbaxy
26.2
20.5
2.8
2.5
2.4
2.2
20.9
17.1
DRL
21.3
19.2
5.2
4.6
3.4
3.1
17.3
15.5
EPS: MOSL forecast v/s consensus (INR)
MOSL
Forecast
22.4
24.5
Consensus
Forecast
21.6
24.9
Variation
(%)
3.9
-1.7
FY12
FY13
Target price and recommendation
Current
Target
Price (INR)
Price (INR)
554
614
Upside
(%)
10.9
Reco.
Neutral
Stock performance (1 year)
Sun Pha rma
Sens ex - Reba s ed
600
Shareholding pattern (%)
Dec-11
Promoter
Domestic Inst
Foreign
Others
15 February 2012
63.7
6.3
19.4
10.6
Sep-11
63.7
6.5
19.1
10.7
Dec-10
63.7
6.7
19.1
10.5
525
450
375
300
Feb-11
May-11
Aug-11
Nov-11
Feb-12
7

Sun Pharmaceuticals
Financials and Valuation
15 February 2012
8

Sun Pharmaceuticals
N O T E S
15 February 2012
9

Disclosures
This report is for personal information of the authorized recipient and does not construe to be any investment, legal or taxation advice to you. This research report does not constitute an offer, invitation or inducement
to invest in securities or other investments and Motilal Oswal Securities Limited (hereinafter referred as MOSt) is not soliciting any action based upon it. This report is not for public distribution and has been
furnished to you solely for your information and should not be reproduced or redistributed to any other person in any form.
Unauthorized disclosure, use, dissemination or copying (either whole or partial) of this information, is prohibited. The person accessing this information specifically agrees to exempt MOSt or any of its affiliates
or employees from, any and all responsibility/liability arising from such misuse and agrees not to hold MOSt or any of its affiliates or employees responsible for any such misuse and further agrees to hold MOSt
or any of its affiliates or employees free and harmless from all losses, costs, damages, expenses that may be suffered by the person accessing this information due to any errors and delays.
The information contained herein is based on publicly available data or other sources believed to be reliable. While we would endeavour to update the information herein on reasonable basis, MOSt and/or its
affiliates are under no obligation to update the information. Also there may be regulatory, compliance, or other reasons that may prevent MOSt and/or its affiliates from doing so. MOSt or any of its affiliates or
employees shall not be in any way responsible and liable for any loss or damage that may arise to any person from any inadvertent error in the information contained in this report . MOSt or any of its affiliates
or employees do not provide, at any time, any express or implied warranty of any kind, regarding any matter pertaining to this report, including without limitation the implied warranties of merchantability, fitness
for a particular purpose, and non-infringement. The recipients of this report should rely on their own investigations.
This report is intended for distribution to institutional investors. Recipients who are not institutional investors should seek advice of their independent financial advisor prior to taking any investment decision
based on this report or for any necessary explanation of its contents.
MOSt and/or its affiliates and/or employees may have interests/positions, financial or otherwise in the securities mentioned in this report. To enhance transparency, MOSt has incorporated a Disclosure of Interest
Statement in this document. This should, however, not be treated as endorsement of the views expressed in the report.
Disclosure of Interest Statement
1. Analyst ownership of the stock
2. Group/Directors ownership of the stock
3. Broking relationship with company covered
4. Investment Banking relationship with company covered
Sun Pharmaceuticals
No
No
No
No
Analyst Certification
The views expressed in this research report accurately reflect the personal views of the analyst(s) about the subject securities or issues, and no part of the compensation of the research analyst(s) was, is, or
will be directly or indirectly related to the specific recommendations and views expressed by research analyst(s) in this report. The research analysts, strategists, or research associates principally responsible
for preparation of MOSt research receive compensation based upon various factors, including quality of research, investor client feedback, stock picking, competitive factors and firm revenues.
Regional Disclosures (outside India)
This report is not directed or intended for distribution to or use by any person or entity resident in a state, country or any jurisdiction, where such distribution, publication, availability or use would be contrary to
law, regulation or which would subject MOSt & its group companies to registration or licensing requirements within such jurisdictions.
For U.K.
This report is intended for distribution only to persons having professional experience in matters relating to investments as described in Article 19 of the Financial Services and Markets Act 2000 (Financial
Promotion) Order 2005 (referred to as "investment professionals"). This document must not be acted on or relied on by persons who are not investment professionals. Any investment or investment activity to
which this document relates is only available to investment professionals and will be engaged in only with such persons.
For U.S.
MOSt is not a registered broker-dealer in the United States (U.S.) and, therefore, is not subject to U.S. rules. In reliance on the exemption from registration provided by Rule 15a-6 of the U.S. Securities Exchange
Act of 1934, as amended (the "Exchange Act") and interpretations thereof by the U.S. Securities and Exchange Commission ("SEC") in order to conduct business with Institutional Investors based in the U.S.,
Motilal Oswal has entered into a chaperoning agreement with a U.S. registered broker-dealer, Marco Polo Securities Inc. ("Marco Polo").
This report is intended for distribution only to "Major Institutional Investors" as defined by Rule 15a-6(b)(4) of the Exchange Act and interpretations thereof by SEC (henceforth referred to as "major institutional
investors"). This document must not be acted on or relied on by persons who are not major institutional investors. Any investment or investment activity to which this document relates is only available to major
institutional investors and will be engaged in only with major institutional investors.
The Research Analysts contributing to the report may not be registered /qualified as research analyst with FINRA. Such research analyst may not be associated persons of the U.S. registered broker-dealer, Marco
Polo and therefore, may not be subject to NASD rule 2711 and NYSE Rule 472 restrictions on communication with a subject company, public appearances and trading securities held by a research analyst account.
Motilal Oswal Securities Ltd
3rd Floor, Hoechst House, Nariman Point, Mumbai 400 021
Phone: (91-22) 39825500 Fax: (91-22) 22885038. E-mail: reports@motilaloswal.com