16 February 2012
3QFY12 Results Update | Sector: Infrastructure
Simplex Infrastructure
BSE SENSEX
S&P CNX
18,202
Bloomberg
Equity Shares (m)
52-Week Range (INR)
1,6,12 Rel. Perf. (%)
M.Cap. (INR b)
M.Cap. (USD b)
5,532
SINF IN
49.5
366/157
-2/-29/-33
10.9
0.2
CMP: INR221
TP: INR290
Buy
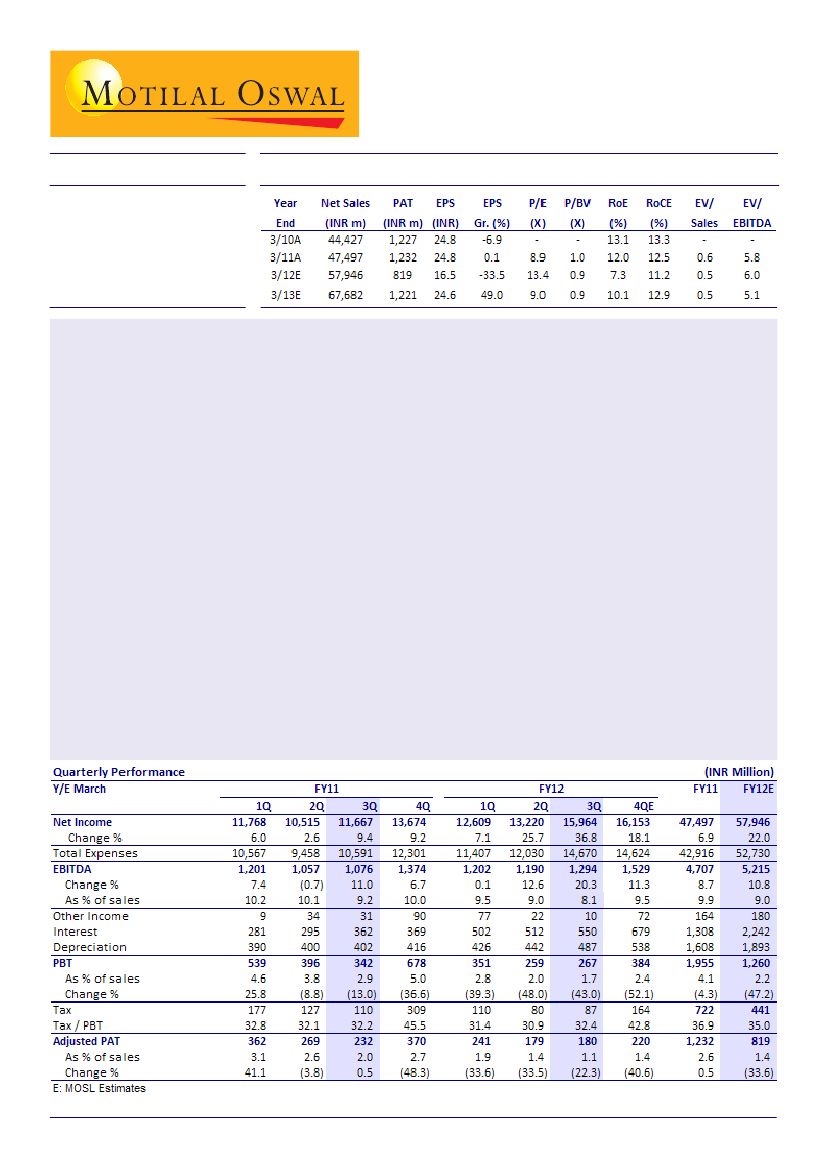
Simplex Infrastructure (SINF) reported revenue of INR16b (up 37% YoY) for 3QFY12, significantly higher than
our estimate of INR13.2b. Execution picked up both on the domestic front as well as on overseas business.
Domestic revenue grew 40% YoY to INR14.2b and overseas revenue increased 17% YoY to INR1.3b, as countries
like Ethiopia, Qatar and Bangladesh started contributing.
EBITDA at INR1.26b (up 20.3% YoY) was in-line with our estimate. EBITDA margin stood at 8.1% (down 110bp
YoY) v/s our estimate of 9.5%. The management attributed the decline in EBITDA margin to the initial start-up
cost in certain projects. A lot of new projects are in the initial phases as the order book was ramped up during
the last two quarters. However, blended margin on the order book is still 10.5%+, which the management
expects to achieve in a couple of quarters. PAT declined 22.3% YoY to INR180m v/s our estimate of INR157m.
Net margin stood at 1.1% v/s 2% in 3QFY11, dragged by high net interest cost of INR550m (v/s INR362m in
3QFY11). Debt as at end-December 2011 stood at INR20.5b v/s INR16b as at March 2011.
Order book during the quarter remained stable at INR144b, up 4% YoY. Order intake declined 52% YoY to
INR10b. Intake during Jan-Feb 2012 stood at INR20.9b. So the total intake in 9MFY12 stood at INR59b v/s
INR79b in FY11. Further, SINF has bagged L1 projects worth INR50b. Of the current order book, power segment
contributes 49% (v/s 24% in Dec-10). Share of buildings increased to 30% from 20% in Dec-10. Of this, real
estate forms 16%, where execution is a concern. Share of industrial declined to 3% (v/s 15% in Dec-10).
According to the management, easing interest rate scenario should revive industrial investment.
We have increased our revenue estimates by 6% for FY12 and by 9% for FY13 and PAT estimates by 2% for both
FY12 and FY13 on account of the revival in YTD order intake and better-than-expected execution. To factor in
increased raw material prices, we have lowered our EBITDA margin estimates by 40bp. The stock trades at 9x
FY13E EPS and 5.1x FY13E EV/EBITDA. We maintain
Buy
with a target price of INR290 (6x FY13E EV/EBITDA).
Dhirendra Tiwari
(Dhirendra.Tiwari@motilaloswal.com ) +91 22 3029 5127
Pooja Kachhawa
(Pooja.Kachhawa@MotilalOswal.com) +91 22 3982 5585

Simplex Infrastructure
Revenues up 37% YoY; driven by overseas revenues (up 17% YoY) and
domestic revenues (up 40% YoY)
SINF reported 3QFY12 revenues of INR16b (up 37% YoY), significantly above our
estimates of INR13.2b (up 14% YoY). Execution picked up in 3QFY12 both on
domestic as well as on overseas business. Domestic revenues grew 40% YoY at
INR14.2b, and overseas up 17% YoY at INR1.3b, as countries like Etopia, Qatar and
Bangladesh started contributing.
EBITDA stood in-line at INR1.26b (up 20.3% YoY) v/s our estimates of INR1.26b (up
17% YoY). EBITDA margins stood at 8.1% (down 110bp YoY) v/s our estimate of
9.5% (up 30bp YoY). Management stated that the decline in EBITDA margins was
due to the initial start up cost in certain projects. The order book has also ramped
up during the last two quarters; so, a lot of new projects are in the initial phase.
However, blended margin on the order book is still 10.5%+, which the company
expects to achieve in a couple of quarters. PAT was down 22.3% YoY at INR180m v/
s our estimate of INR157m (down 32% YoY).
Net margin stood at 1.1% v/s 2% in 3QFY11, dragged by high net interest cost of
INR550m v/s INR362m in 3QFY11. Debt as at end December 2011 stood at INR20.5b
v/s INR16b as at March 2011.
Revenue at INR16b up 37% YoY: Execution expected
to pick up over FY12
EBIDTA Margins (%): Down 110bp YoY ; given the rising
material cost
Source: Company/MOSL
3QFY12 order book at INR144b (up 4% YoY, down 4% QoQ)
Order book remained stable at INR144b up 4% YoY . Order intake during the quarter
declined 52% YoY to INR10b.
Intake during Jan-Feb 2012 stood at INR20.9b. So the total intake in 9MFY12 stood
at INR59b v/s INR79b in FY11. Further, SINF is L1 in projects of INR50b.
Of the current order book, power segment contributes 49% (v/s 24% in Dec-10).
Share of buildings also moved up to 30% (v/s 20% in Dec-10); of this, real estate
forms 16%, where execution is a concern. Share of industrial declined to 3% (v/s
15% in Dec-10); according to the management, easing interest rate scenario should
revive industrial investment.
We believe that given improved order intake, better project economics and
increased focus on execution by, Industrial and power segment, urban
infrastructure should be a key contributor to order intake in FY12 and FY13.
This is also positive for margins and working capital cycle, given that a large part of
the private sector projects are on negotiated basis (and not on L1).
2
16 February 2012

Simplex Infrastructure
3QFY12 intake at INR10b (down 52% YoY)
BTB at 2.6x v/s 3x in 3QFY11
Source: Company/MOSL
High share of power and buildings in fresh order intake
3QY12
Buildings
Bridges
Industrial
Marine
Piling
Power
Roads
Urban Infrastructure
Railways
Total
Order intake
mix (%)
57
2
2
0
2
37
0
0
0
100
Order book
mix (%)
30
1
3
0
8
49
7
0
2
100
Revenue
mix (%)
10
10
6
3
7
37
9
11
7
100
Source: Company/MOSL
Working capital day's stands at 120 days v/s 138 days in Sep-2011; capex of
INR2b in FY12
As on Dec-2011, Net Working Capital reduced to 120 days v/s 138 days in Sep-2011,
largely due to lower inventory. Debtor days were contained at 138 days.
Management indicated that the current focus is on managing working capital.
Debt as at end Dec-2011 stood at INR20.5b v/s INR19b as at Sep-2011 and INR16b as
at Mar-2011. Total debt includes working capital loan of INR18b and INR2.9b of
equipment loan.
Valuation and view: Increased FY12 and FY13 earnings by 2% each
We have increased our revenue estimates by 6% for FY12 and 9% for FY13 and PAT
estimates by 2% for FY12 and FY13, given the revival in YTD order intake and
better than expected execution. To factor in increased raw material prices, we
have lowered our EBITDA margin by 40bp.
We now expect SINF to report PAT of INR819m in FY12 (down 34% YoY) and INR1.2b
in FY13 (up 50% YoY), translating into an EPS of INR16.5/sh in FY12 and INR24.6/sh
in FY13.
The stock trades at FY13E P/E of 9x and EV/EBITDA of 5.1x. We maintain
Buy
with
target price of INR290 at 6x FY13E EV/EBITDA.
16 February 2012
3

Simplex Infrastructure
Simplex Infrastructures: an investment profile
Company description
Simplex Infrastructure (SINF) began operations (post
takeover by the Mundra family in 1949), with a focus on
high end piling contracts and power projects. Over the
period, SINF has evolved as a diversified infrastructure
player with presence across the infrastructure segments.
SINF has over the past few years successfully built pre-
qualifications for new verticals like roads, ports (marine),
urban infrastructure, civil and industrial construction.
Unlike peers, it has ~60% of business from the private
clients/PPP and has presence in India and Middle East.
Currently, it derives ~35% of the revenues from private
clients/PPP, 35% from central Government and 30% from
overseas markets.
Key investment risks
SINF has order book to bill ratio of 3x, which has
improved in past 2-3 quarters. This will impact near
term revenue growth
Valuation and View
The stock trades at FY13E P/E of 9x and EV/EBITDA of
5.1x. We maintain
Buy
with target price of INR290 at
6x FY13E EV/EBITDA.
Sector view
Key investment arguments
Improved visibility in terms of order intake, across
segments / geographies. Order backlog at the end
of December 2011 is INR144b.
SINF has one of the most diversified businesses with
presence across infrastructure sector. It also derives
~10% of the order book from Middle East, reducing
risk of over dependence of Indian market. Private
sector contributes 65% of order book, which has
better payment terms.
Order intake from Public and private clients has
already witnessed marginal revival. Going forward
while the public capex would be strong; the private
capex could also revive. Inquiries from Middle East
are also expected to improve. We remain positive
on the pick up in infrastructure spending and thus
the construction sector.
Comparative valuations
P/E (x)
P/BV (x)
EV/Sales (x)
EV/EBITDA (x)
FY12E
FY13E
FY12E
FY13E
FY12E
FY13E
FY12E
FY13E
Simplex
13.4
9.0
0.9
0.9
0.5
0.5
6.0
5.1
IVRCL
37.0
19.0
0.8
0.8
0.7
0.7
9.1
7.5
NCC
31.7
20.8
0.6
0.6
0.9
0.9
10.5
9.4
EPS: MOSL forecast v/s consensus (INR)
MOSL
Forecast
16.5
24.6
Consensus
Forecast
20.9
26.5
Variation
(%)
-21.0
-7.3
FY12
FY13
Target price and recommendation
Current
Price (INR)
221
Target
Price (INR)
290
Upside
(%)
31.2
Reco.
Buy
Stock performance (1 year)
Si mpl ex Infra.
400
Sens ex - Rebas ed
Shareholding pattern (%)
Dec-11
Promoter
Domestic Inst
Foreign
Others
16 February 2012
55.0
18.8
14.7
11.6
Sep-11
55.0
20.4
13.0
11.6
Dec-10
54.7
20.9
12.9
11.4
330
260
190
120
Feb-11
May-11
Aug-11
Nov-11
Feb-12
4

Simplex Infrastructure
Financials and valuation
16 February 2012
5

Disclosures
This report is for personal information of the authorized recipient and does not construe to be any investment, legal or taxation advice to you. This research report does not constitute an offer, invitation or inducement
to invest in securities or other investments and Motilal Oswal Securities Limited (hereinafter referred as MOSt) is not soliciting any action based upon it. This report is not for public distribution and has been
furnished to you solely for your information and should not be reproduced or redistributed to any other person in any form.
Unauthorized disclosure, use, dissemination or copying (either whole or partial) of this information, is prohibited. The person accessing this information specifically agrees to exempt MOSt or any of its affiliates
or employees from, any and all responsibility/liability arising from such misuse and agrees not to hold MOSt or any of its affiliates or employees responsible for any such misuse and further agrees to hold MOSt
or any of its affiliates or employees free and harmless from all losses, costs, damages, expenses that may be suffered by the person accessing this information due to any errors and delays.
The information contained herein is based on publicly available data or other sources believed to be reliable. While we would endeavour to update the information herein on reasonable basis, MOSt and/or its
affiliates are under no obligation to update the information. Also there may be regulatory, compliance, or other reasons that may prevent MOSt and/or its affiliates from doing so. MOSt or any of its affiliates or
employees shall not be in any way responsible and liable for any loss or damage that may arise to any person from any inadvertent error in the information contained in this report . MOSt or any of its affiliates
or employees do not provide, at any time, any express or implied warranty of any kind, regarding any matter pertaining to this report, including without limitation the implied warranties of merchantability, fitness
for a particular purpose, and non-infringement. The recipients of this report should rely on their own investigations.
This report is intended for distribution to institutional investors. Recipients who are not institutional investors should seek advice of their independent financial advisor prior to taking any investment decision
based on this report or for any necessary explanation of its contents.
MOSt and/or its affiliates and/or employees may have interests/positions, financial or otherwise in the securities mentioned in this report. To enhance transparency, MOSt has incorporated a Disclosure of Interest
Statement in this document. This should, however, not be treated as endorsement of the views expressed in the report.
Disclosure of Interest Statement
1. Analyst ownership of the stock
2. Group/Directors ownership of the stock
3. Broking relationship with company covered
4. Investment Banking relationship with company covered
Simplex Infrastructure
No
No
No
No
Analyst Certification
The views expressed in this research report accurately reflect the personal views of the analyst(s) about the subject securities or issues, and no part of the compensation of the research analyst(s) was, is, or
will be directly or indirectly related to the specific recommendations and views expressed by research analyst(s) in this report. The research analysts, strategists, or research associates principally responsible
for preparation of MOSt research receive compensation based upon various factors, including quality of research, investor client feedback, stock picking, competitive factors and firm revenues.
Regional Disclosures (outside India)
This report is not directed or intended for distribution to or use by any person or entity resident in a state, country or any jurisdiction, where such distribution, publication, availability or use would be contrary to
law, regulation or which would subject MOSt & its group companies to registration or licensing requirements within such jurisdictions.
For U.K.
This report is intended for distribution only to persons having professional experience in matters relating to investments as described in Article 19 of the Financial Services and Markets Act 2000 (Financial
Promotion) Order 2005 (referred to as "investment professionals"). This document must not be acted on or relied on by persons who are not investment professionals. Any investment or investment activity to
which this document relates is only available to investment professionals and will be engaged in only with such persons.
For U.S.
MOSt is not a registered broker-dealer in the United States (U.S.) and, therefore, is not subject to U.S. rules. In reliance on the exemption from registration provided by Rule 15a-6 of the U.S. Securities Exchange
Act of 1934, as amended (the "Exchange Act") and interpretations thereof by the U.S. Securities and Exchange Commission ("SEC") in order to conduct business with Institutional Investors based in the U.S.,
Motilal Oswal has entered into a chaperoning agreement with a U.S. registered broker-dealer, Marco Polo Securities Inc. ("Marco Polo").
This report is intended for distribution only to "Major Institutional Investors" as defined by Rule 15a-6(b)(4) of the Exchange Act and interpretations thereof by SEC (henceforth referred to as "major institutional
investors"). This document must not be acted on or relied on by persons who are not major institutional investors. Any investment or investment activity to which this document relates is only available to major
institutional investors and will be engaged in only with major institutional investors.
The Research Analysts contributing to the report may not be registered /qualified as research analyst with FINRA. Such research analyst may not be associated persons of the U.S. registered broker-dealer, Marco
Polo and therefore, may not be subject to NASD rule 2711 and NYSE Rule 472 restrictions on communication with a subject company, public appearances and trading securities held by a research analyst account.
Motilal Oswal Securities Ltd
3rd Floor, Hoechst House, Nariman Point, Mumbai 400 021
Phone: (91-22) 39825500 Fax: (91-22) 22885038. E-mail: reports@motilaloswal.com