16 February 2012
5QSY12 Results Update | Sector: Sugar
Shree Renuka Sugars
BSE SENSEX
S&P CNX
18,202
Bloomberg
Equity Shares (m)
52-Week Range (INR)
1,6,12 Rel. Perf. (%)
M.Cap. (INR b)
M.Cap. (USD b)
5,532
SHRS IN
671.0
87/23
14/-39/-51
27.3
0.6
CMP: INR41
TP: INR50
Buy
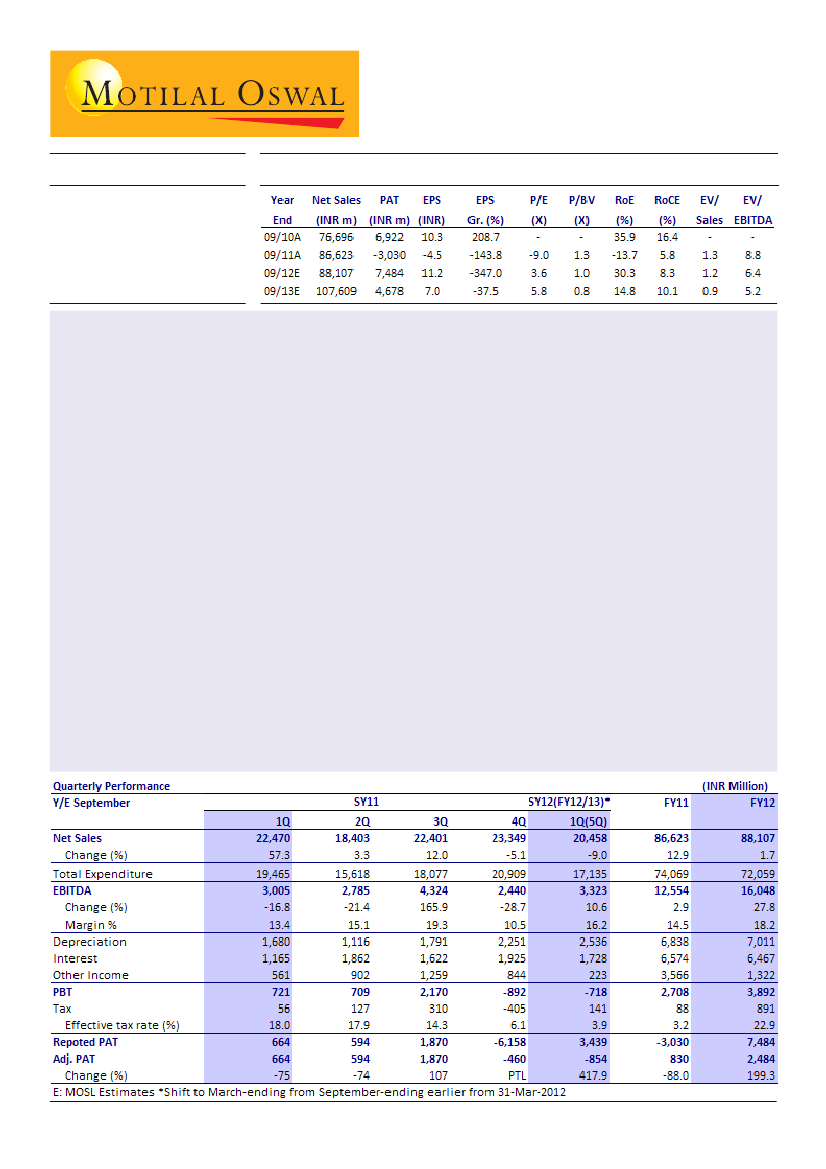
Shree Renuka Sugars' (SHRS) reported 11% YoY growth in EBIDTA to INR3.3b for 5QFY12 (change in accounting
year to April-March from October-September). Revenue declined 9% YoY to INR20.5b, while PAT surged 4x to
INR3.4b due to forex gain of INR4.3b on USD/Real dominated liabilities. The forex gain was due to adoption
of revised accounting standard to amortize change in long term foreign exchange liabilities over the tenor of
the liability.
Standalone EBITDA slipped by just 3% YoY, despite the huge 37% YoY decline in revenue (on account of lower
sugar sales and trading revenue). Expansion in EBITDA margin is attributed to the improvement in realizations
across all segments. The company expects its refinery business to improve over next couple of quarters due
to (1) favorable sugar spread; and (2) substantial availability of domestic raw sugar.
In Brazil, numbers remained steady on a YoY basis, although margins improved on account of higher sugar
realization. However, higher realization was offset by lower volumes on account of adverse weather that
impacted crushing volume of Renuka do Brasil (RDB). After the severe impact on cane yield in 4QSY11, the
management expects yields to recover to ~65t/ha going forward.
During 5QFY12, SHRS has achieved its plantation target of ~25,000 ha (20,045ha at RDB and 5,136ha at VDI). We
expect re-plantation to lower average age of crops and improve productivity/yield.
The company's net debt increased by ~INR7b to ~INR90b due to the increase in working capital debt in Indian
operations. The management guided the divestment of co-gen business (138MW at Equipav) to be concluded
by Feb-end. We believe this event would be a key trigger for the company's re-capitalization target.
Going forward, key triggers for the stock's would be: (1) turnaround in volumes and cane yield of its Brazilian
operations, (2) upswing in international sugar prices, and (3) reduction in debt.
The stock trades at 5.8x FY13E EPS of INR7, and EV/EBITDA of 5.2x FY13E. We continue to value SHRS at 6x EV/
EBITDA, leading to a lower target price of INR50. Maintain
Buy.
Sandipan Pal
(Sandipan.Pal@MotilalOswal.com); Tel: +91 22 3982 5436

Shree Renuka Sugars
Geographic composition
Sales mix:
Domestic 43% (56% in 4Q) and Brazil 57% (44% in 4Q).
EBITDA mix:
Domestic 31% (22% in 4Q) and Brazil 69% (78% in 4Q).
Crushing:
Total crushing dropped by 17%QoQ and 33% YoY to 3mt. The decline is
largely attributed to the ~56% volume drop of the company's Brazil operations
due to adverse weather impacting crop yield. India operations commenced the
new crushing season with a 5% YoY jump in crushing. Lower crushing also led to
~44% YoY drop in sugar production in Brazil.
Geographical Sales Mix (INR m)
5QFY12
6,975
1,058
15
342
291
43
31
1QFY12
11,115
1,087
10
304
55
34
India
Chg.(YoY) 4QFY12
-37
11,363
-3
609
55
5
-4
(573)
56
22
Chg.(QoQ)
-38.6
73.7
183.0
-150.8
5QFY12
9,086
2,320
26
3,952
2,993
57
69
1QFY12
9,046
2,081
25
298
308
45
66
Brazil
Chg.(YoY) 4QFY12 Chg.(QoQ)
0
9,098
-0.1
11
2,157
7.6
0
24
7.7
(5,558)
872 (6,452)
-146.4
44
78
Source: Company/MOSL
Net Sales
EBITDA
EBITDA (%)
Foreign exchange
PAT
Sales proportion (%)
EBITDA proportion (%)
Crushing mix (mt)
Production mix (mt)
Source: Company/MOSL
Key operating metrics: Domestic Business
Sugarcane Crushed (t)
Raw Sugar Processed (t)
Recovery (%)
Sugar
From Cane (t)
- Raw Sugar (t)
- White Sugar (t)
Refined Sugar (t)
Total Sugar Produced
Ethanol
Production (KL)
Realization (INR/Ltr)
Co-generation
Exports (mm units)
Realizations (INR/Unit)
16 February 2012
1QSY11
1,674,090
120,813
10.4
167,301
167,301
114,039
281,340
17,594
28
108
3.8
2QSY11
2,803,472
69,770
12.2
342,958
342,958
67,080
410,038
42,952
28
150
5.4
3QSY11
748,680
70,750
12.1
90,758
90,758
66,980
157,738
40,852
27
81
6.4
4QSY11
-
117,828
-
-
-
110,921
110,921
9,019
29
19
3.5
5QFY12
1,759,303
81,685
11.0
192,724
192,724
78,417
271,141
25,094
29
79
4.5
YoY (%)
5
(32)
5.8
15
15
(31)
(4)
43
4
(27)
17.0
2

Shree Renuka Sugars
Key operating metrics: Brazil Business
Sugarcane Crushed (t)
Raw Sugar Processed (t)
Recovery (%)
Sugar
From Cane (t)
- Raw Sugar (t)
- White Sugar (t)
Refined Sugar (t)
Total Sugar Produced
Ethanol
Production (KL)
Realization (INR/Ltr)
Co-generation
Exports (mm units)
Realizations (INR/Unit)
1QSY11
2,779,552
-
129.7
165,996
157,576
8,420
-
165,996
111,817
32
120
4.6
2QSY11
170,662
-
106
6,790
6,790
-
-
6,790
8,548
38.1
40.0
4.5
3QSY11
3,359,838
-
117
167,124
113,336
53,788
-
167,124
129,519
47
95
4.1
4QSY11
3,600,790
-
138
289,075
289,075
-
-
289,075
118,210
37
123
4.1
5QFY12
1,229,294
134
93,201
93,076
125
93,201
39,561
35
187
4.3
YoY (%)
(56)
3.1
(44)
(99)
(44)
(65)
9
56
(6.9)
India operations: New crushing season commenced
Sales
declined 38% QoQ (-37% YoY) to INR7b driven by decline in sugar sales and
trading revenue. Sugar sales dropped due to lower utilization of refinery on the
back of unfavorable white-raw spread.
EBIDTA margin
expanded strongly to 15.2% from 9.8% in 1QSY12 due to
improvement in realizations across segments.
Crushing
improved 5% YoY to 1.8mt; Recovery improved to 11% v/s 10.4% in 1QSY11.
Sugar segment:
EBIT margin improved to 9.8% from 9.1% in 1QSY12 and 2.8% in
4QSY11. The QoQ improvement is due to seasonal impact.
Production declined 4% YoY to 0.27mt due to lower refinery volume on the
back of unfavorable white-raw spread.
Refinery volume stood at 0.08mt v/s 0.11mt in 4QSY11 and 1QSY11 against a
capacity of 9,000t/day.
Sugar sales volumes dropped 45% YoY to 1.6mt.
Blended realizations declined 4% QoQ (flat YoY) to INR28.4/kg, due to lower
proportion of export sales in sugar.
Ethanol segment:
Volumes increased 14% YoY and realizations rose 4% YoY; EBIT
margin rose to 28.5% from 16.9% in 1QSY11.
Ethanol blending program
continues to drive demand. However, sales to oil
marketing companies (OMCs) declined to 6ml v/s 18.8ml in 4QSY11. SHRS has
received orders for the supply of 75ml to OMCs during the year Oct-11 to
Sep- 12.
Average ethanol realization
in 5QFY12 was INR28.9/l (v/s INR29.1/l in 4QSY11).
The company believes the proposal of linking ethanol price with domestic
petrol prices is likely to boost realizations. The management also mentioned
that given the current shortage of ethanol, world market could be supportive
of ethanol exports in the near-term.
16 February 2012
3

Shree Renuka Sugars
Co-generation:
Volumes declined 27% YoY and realization increased 17% YoY; EBIT
margin rose to 45.5% v/s 8% 1QSY11.
Volumes fell to 70m units due to the lower utilization of the refineries and
delayed crushing.
Realization improved QoQ to INR4.5/unit. Operating margin improved due to
lower cost of fuel, primarily as the company used its own bagasse.
Sugar sales declined due to lower
refinery volume
Lower export sales dented average
realization QoQ (mt)
QoQ movement of export and domestic
sugar prices
Ethanol volume up YoY,
so is realization
QoQ performance in co-generation,
realization up sharply
Refinery volume (mt) impacted due
to lower utilization
Raw and White sugar price trend
(USD/t)
White-raw spread was unfavorable
(USD/t)
Domestic sugar price has been between
INR2,800-3,300/quintal
Source: Company/MOSL
16 February 2012
4

Shree Renuka Sugars
Standalone segmental performance
Y/E September
INR m
Sugar
Cogeneration
Trading
Ethanol
Others
Total
Less: Intersegment Rev.
Total Revenue
Segmental PBIT
Sugar
Cogeneration
Trading
Ethanol
Others
Total
Segmental PBIT Margin (%)
Sugar
Cogeneration
Trading
Ethanol
FY11
1Q
8,368
725
2,085
378
6
11,562
548
11,014
758
58
51
64
(1)
930
9.1
8.0
2.4
16.9
2Q
6,981
1,363
4,274
910
17
13,545
1,056
12,489
341
679
181
237
(5)
1,433
4.9
49.8
4.2
26.0
3Q
8,493
877
1,931
895
30
12,226
154
12,072
459
382
88
395
27
1,351
5.4
43.6
4.6
44.1
4Q
5,994
407
4,166
1,087
10
11,664
391
11,273
169
(15)
65
186
5
410
2.8
(3.7)
1.6
17.1
FY12
1Q
4,517
692
1,984
452
7
7,652
682
6,970
442
314
67
129
(1)
951
9.8
45.4
3.4
28.5
QoQ
(%)
(25)
70
(52)
(58)
(30)
(34)
74
(38)
162
LTP
3
(31)
(120)
132
YoY
(%)
(46)
(5)
(5)
20
17
(34)
24
(37)
(42)
441
31
102
-
2
Brazilian operation: End of crushing season
Sales and EBITDA steady:
Sales during the quarter were flat at INR9.1b, while
EBITDA improved 11% YoY. Sales comprise (a) INR6.4b (down 15%YoY) from Renuka
do Brasil (RDB) and (b) INR2.7b (up 67%YoY) from Vale do Ivai (VDI).
EBITDA margin improves:
EBIDTA margin was 25% v/s 25% in 1QSY11; RDB's EBITDA
margin contracted to 23% from 25% in 1QSY11 due to adverse weather which
resulted in a sharp drop in yield in Sao Paulo state. VDI's margin improved to 32%
from 24% in 1QSY11.
Crushing was impacted
due to adverse weather conditions (drought in Sao Paulo
state) with total crushing of 8.3mt (6mt in RDB and 2.3mt in VDI) over last season,
including 1.2mt in 5QFY12 v/s 2.8mt in 1QSY11 (56% YoY decline).
Recovery improves:
ATR was 133.7kg/t v/s 129.7kg/t in 1QSY11 and 138kg/t in
4QSY11. With better sugar prices, higher proportion (58.7%) of juice was diverted
towards sugar production (v/s 48.3% for the industry).
Planting target achieved:
During 5QFY12, the company achieved its plantation
target of ~25,000 ha (20,045 ha at RDB and 5,136 ha at VDI). We expect this to lower
the average age of its crops and improve productivity/yield for next crushing
season.
Sugar realizations down QoQ at 24.4c/lb:
The company achieved average sales
price of 24.4c/lb (hedged floor price of 23c/lb) v/s 26c/lb in 4QSY11 on 0.18mt sold
during the quarter. YoY improvement in sugar realization (~37%) was offset by
lower volumes.
16 February 2012
5

Shree Renuka Sugars
Brazilian Subsidiary Performance (INR m)
Renuka do Brasil
5QFY12
1QFY12
6,379
7,535
1,466
1,902
23.0
25.2
2,117
54
Chg. (YoY)
-15.3
-22.9
-9.0
3820.4
5QFY12
2,707
860
31.8
893
Vale do Ivai
1QFY12
1,624
391
24.1
192
Chg. (YoY)
66.7
119.9
32.0
365.1
Brazil Operations
Consolidated
9,086
2,326
25.6
2,993
Net Revenue
EBITDA
% EBITDA
PAT
Management's outlook and guidance: Expect high production phase in India
nearing end; co-gen divestment to conclude soon
Focus remains on reviving Brazilian operation and de-leveraging.
Near-term sugar pricing outlook is range-bound on account of higher beet sugar
production in Europe and surplus sugar production in India and Thailand.
Despite higher volumes, pricing outlook to remain strong due to (a) re-stocking
demand from major importing countries, (b) strong unmet ethanol (flexi-fuel
car) demand in Brazil; and (c) lack of sustainability of European sugar production
in a low-price scenario given average cost of production of ~25c/lb
Divestment of co-gen business (138MW at Equipav) is likely to be concluded by
Feb-end. We believe this to be a key trigger for de-leveraging target.
RDB is expected to operate at 65t/ha yield for going forward.
Indian operations have registered the best- ever recovery rate and could touch
~12% in the current crushing season against 11.5%.
Refinery vertical to see USD60/ton of EBITDA based on current spread. Domestic
raw sugar availability renders strong visibility of refinery production of ~0.5mt
over next couple of quarters.
Indian sugar cycle is expected to see high production phase, given a) arrear building
in north India and b) cane area in South India and Maharashtra being saturated
with availability of water, lowering the likelihood of area increase.
Valuation and view: Progress in co-gen divestment and turnaround in Brazil
operations are the key catalyst
SHRS is the only sugar/ethanol producer in the world with almost year-long cane
crushing activity as it has operations in Brazil and India, which have complementary
crushing seasons. This allows it to: (1) manage inventory, (2) benefit from price
arbitrage between sugar/ethanol, raw/white sugar, (3) play price arbitrage
between India's regulated sugar industry and liquid global markets, and (4)
leverage synergies, and offer steady returns despite cyclical nature of the industry.
Adverse weather that impacted production volume and margins at its Brazilian
operations, coupled with lower production expectation in refinery business, have
taken a huge toll on the stock performance post 4QSY11. Its high leverage level
also remains a huge near-term overhang on the stock.
However, going forward, we believe with (a) progress in co-gen divestment (a
trigger for de-leveraging), (b) re-plantation improving productivity/yield in
Brazilian subsidiaries, (c) robust domestic outlook, the stock could see meaningful
upside.
The stock trades at 5.8x FY13E EPS of INR7, and EV/EBITDA of 5.2x FY13E. We continue
to value SHRS at 6x EV/EBITDA, leading to a lower target price of INR50. Maintain
Buy.
16 February 2012
6

Shree Renuka Sugars
Shareholding pattern (%)
Dec-11
Promoter
Domestic Inst
Foreign
Others
38.1
14.3
18.7
29.0
Sep-11
38.1
6.9
27.6
27.5
Dec-10
37.9
11.1
23.4
27.6
Stock performance (1 year)
Shree Renuka Sug
100
80
60
40
20
Feb-11
Ma y-11
Aug-11
Nov-11
Feb-12
Sens ex - Rebas ed
16 February 2012
7

Shree Renuka Sugars
Financials and Valuation
16 February 2012
8

Shree Renuka Sugars
N O T E S
16 February 2012
9

Disclosures
This report is for personal information of the authorized recipient and does not construe to be any investment, legal or taxation advice to you. This research report does not constitute an offer, invitation or
inducement to invest in securities or other investments and Motilal Oswal Securities Limited (hereinafter referred as MOSt) is not soliciting any action based upon it. This report is not for public distribution
and has been furnished to you solely for your information and should not be reproduced or redistributed to any other person in any form.
Unauthorized disclosure, use, dissemination or copying (either whole or partial) of this information, is prohibited. The person accessing this information specifically agrees to exempt MOSt or any of its
affiliates or employees from, any and all responsibility/liability arising from such misuse and agrees not to hold MOSt or any of its affiliates or employees responsible for any such misuse and further agrees
to hold MOSt or any of its affiliates or employees free and harmless from all losses, costs, damages, expenses that may be suffered by the person accessing this information due to any errors and delays.
The information contained herein is based on publicly available data or other sources believed to be reliable. While we would endeavour to update the information herein on reasonable basis, MOSt and/or
its affiliates are under no obligation to update the information. Also there may be regulatory, compliance, or other reasons that may prevent MOSt and/or its affiliates from doing so. MOSt or any of its
affiliates or employees shall not be in any way responsible and liable for any loss or damage that may arise to any person from any inadvertent error in the information contained in this report . MOSt or any
of its affiliates or employees do not provide, at any time, any express or implied warranty of any kind, regarding any matter pertaining to this report, including without limitation the implied warranties of
merchantability, fitness for a particular purpose, and non-infringement. The recipients of this report should rely on their own investigations.
This report is intended for distribution to institutional investors. Recipients who are not institutional investors should seek advice of their independent financial advisor prior to taking any investment
decision based on this report or for any necessary explanation of its contents.
MOSt and/or its affiliates and/or employees may have interests/positions, financial or otherwise in the securities mentioned in this report. To enhance transparency, MOSt has incorporated a Disclosure of
Interest Statement in this document. This should, however, not be treated as endorsement of the views expressed in the report.
Disclosure of Interest Statement
1. Analyst ownership of the stock
2. Group/Directors ownership of the stock
3. Broking relationship with company covered
4. Investment Banking relationship with company covered
Shree Renuka Sugars
No
No
No
No
Analyst Certification
The views expressed in this research report accurately reflect the personal views of the analyst(s) about the subject securities or issues, and no part of the compensation of the research analyst(s) was, is,
or will be directly or indirectly related to the specific recommendations and views expressed by research analyst(s) in this report. The research analysts, strategists, or research associates principally
responsible for preparation of MOSt research receive compensation based upon various factors, including quality of research, investor client feedback, stock picking, competitive factors and firm revenues.
Regional Disclosures (outside India)
This report is not directed or intended for distribution to or use by any person or entity resident in a state, country or any jurisdiction, where such distribution, publication, availability or use would be contrary
to law, regulation or which would subject MOSt & its group companies to registration or licensing requirements within such jurisdictions.
For U.K.
This report is intended for distribution only to persons having professional experience in matters relating to investments as described in Article 19 of the Financial Services and Markets Act 2000 (Financial
Promotion) Order 2005 (referred to as "investment professionals"). This document must not be acted on or relied on by persons who are not investment professionals. Any investment or investment activity
to which this document relates is only available to investment professionals and will be engaged in only with such persons.
For U.S.
MOSt is not a registered broker-dealer in the United States (U.S.) and, therefore, is not subject to U.S. rules. In reliance on the exemption from registration provided by Rule 15a-6 of the U.S. Securities
Exchange Act of 1934, as amended (the "Exchange Act") and interpretations thereof by the U.S. Securities and Exchange Commission ("SEC") in order to conduct business with Institutional Investors
based in the U.S., Motilal Oswal has entered into a chaperoning agreement with a U.S. registered broker-dealer, Marco Polo Securities Inc. ("Marco Polo").
This report is intended for distribution only to "Major Institutional Investors" as defined by Rule 15a-6(b)(4) of the Exchange Act and interpretations thereof by SEC (henceforth referred to as "major
institutional investors"). This document must not be acted on or relied on by persons who are not major institutional investors. Any investment or investment activity to which this document relates is only
available to major institutional investors and will be engaged in only with major institutional investors.
The Research Analysts contributing to the report may not be registered /qualified as research analyst with FINRA. Such research analyst may not be associated persons of the U.S. registered broker-dealer,
Marco Polo and therefore, may not be subject to NASD rule 2711 and NYSE Rule 472 restrictions on communication with a subject company, public appearances and trading securities held by a research
analyst account.
Motilal Oswal Securities Ltd
3rd Floor, Hoechst House, Nariman Point, Mumbai 400 021
Phone: (91-22) 39825500 Fax: (91-22) 22885038. E-mail: reports@motilaloswal.com