2 May 2012
4QFY12 Results Update | Sector: Consumer
Dabur India
BSE SENSEX
S&P CNX
17,319
Bloomberg
Equity Shares (m)
52-Week Range (INR)
1,6,12 Rel. Perf. (%)
M.Cap. (INR b)
M.Cap. (USD b)
5,248
DABUR IN
1,740.7
122/92
5/13/20
195.0
3.7
CMP: INR112
TP: INR104
Neutral
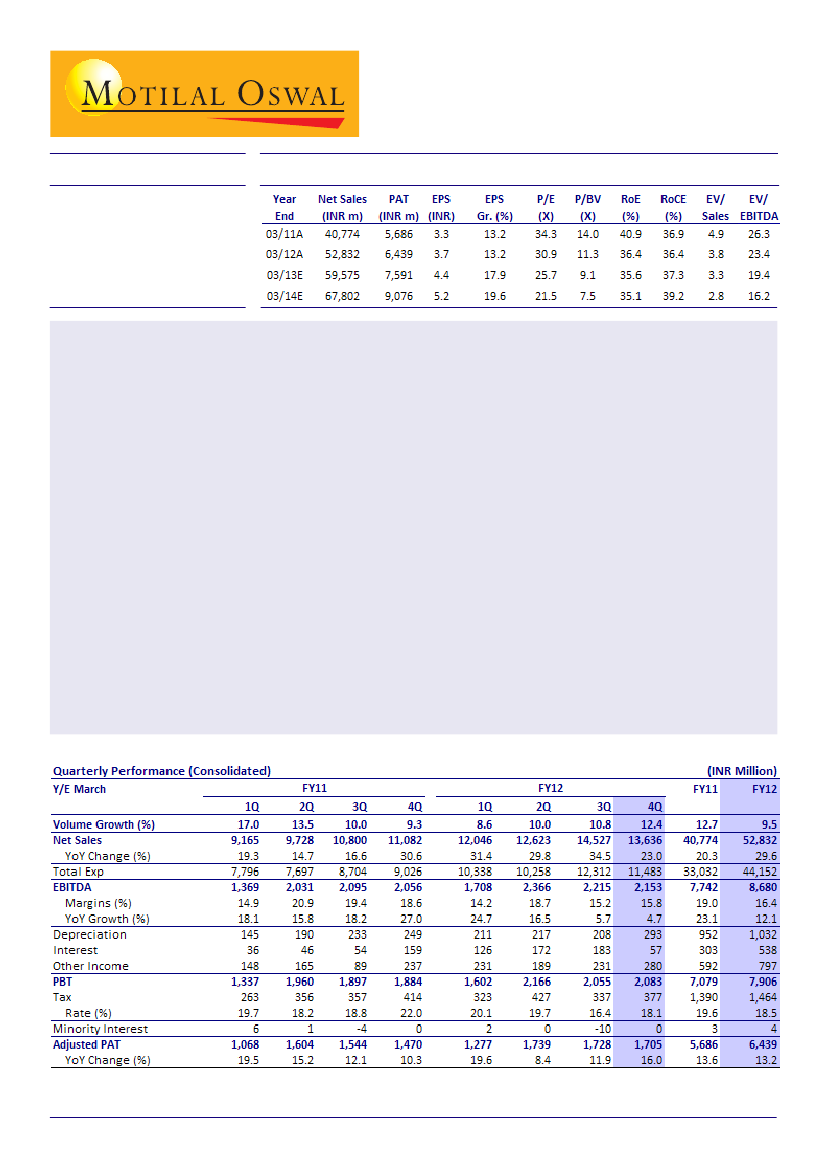
Dabur India (DABUR) reported better than expected results for 4QFY12. Adjusted PAT grew 16% to INR1.7b
(v/s our estimate of INR1.56b), led by lower interest and lower tax rates. Sales growth was 23%, higher than
our estimate, led by strong recovery in both domestic and international markets - volumes increased 12.4%.
Gross margin contracted 320bp to 49.8%, as steep inflation and lag in price increases continued to impact
profitability.
EBITDA margin declined 276bp to 15.8% owing to higher ad expenses (up 190bp). EBITDA grew just 1.9% to
INR2,153m (v/s our estimate of INR2,105m). Interest cost declined 64% due to INR70m forex gain during
4QFY12. A 26% increase in other income and lower tax rate (down 390bp) boosted PAT by 16% to INR1,705m
(v/s our estimate of INR1,567m).
The management had indicated volume growth focus in the previous quarter and the company has been able
to achieve that. We note that Dabur has been slow in raising prices and this has impacted margins. The
management is contemplating increasing prices gradually to recover profit margins.
Dabur is expanding its rural distribution meaningfully. This will enable it to grow faster than the market and
to increase its market share even if rural growth slows down.
We expect higher growth in international business, as the GCC region recovers; the success of Namaste
products in Africa will hold the key to any meaningful increase in growth rates, in our view. We marginally
tweak our estimates by factoring in 100bp lower tax rate and INR1b capex in Sri Lanka. We estimate 18.7% PAT
CAGR over FY12-14.
The stock trades at 25.7x FY13E EPS of INR4.4 and 21.5x FY14E EPS of INR5.2. Maintain
Neutral.
Amnish Aggarwal
(AmnishAggarwal@MotilalOswal.com); +9122 39825404

Dabur India
Consolidated volumes up 12.4%; standalone volumes grow 9.5%
Domestic sales grew 19.2% to INR9.7b. Gross margin contracted 300bp to 46.2%
and EBITDA margin declined 500bp to 16.3% due to 160bp increase in ad spends
and 120bp increase in other expenses. EBITDA declined 8.5%; 79% growth in other
income and 190bp decline in tax rate enabled adjusted PAT growth of 4% to
INR1,332m.
Consolidated net sales grew 23%, volumes increased 12.4%. Gross margin
contracted 320bp to 49.8%; steep inflation and lag in price increases continued to
impact profitability.
EBITDA margin contracted 276bp to 15.8%, owing to higher ad expenses (up 190bp).
EBITDA grew just 1.9% to INR2,153m (v/s our estimate of INR2,105m). Interest
cost declined 64% due to INR70m forex gain. A 26% increase in other income and
lower tax rate (down 390bp) boosted PAT by 16% to INR1,705m (v/s our estimate
of INR1,567m).
Sales up 23%, driven by 46% growth in international business
Volume growth of 12.4% indicates smart recovery
Source: Company/MOSL
270bp contraction in EBITDA margin, as ad spends increase 190bp
Source: Company/MOSL
2 May 2012
2

Dabur India
Hair oil sales grew 19.8%, led by healthy volume growth and price increases across
the portfolio; Vatika and Amla hair oil recorded strong growth.
Shampoos grew 16.8% on a low base of steep double-digit decline; Henna (green
variant) was the best performer in this category.
Toothpastes grew 8.3%; volume market share increased marginally, with premium
toothpastes doing well.
Skincare sales grew 17.6%, led by distribution realignment and Fem growing at
20%.
Homecare posted strong 18% growth, led by Odonil in all formats (Odonil crossed
INR1b in sales during the quarter); Odomos sales remained under pressure.
Foods grew 30.4% and crossed INR5b in FY12; Real and Active did well and the
company launched new variants like Plum, Pomegranate and Blueberries.
OTC and ethicals grew 13.8% and 18%; Lal Tail and Honitus performed well. Growth
was led by distribution realignment.
The management had indicated volume growth focus in the previous quarter and
the company has been able to achieve that. We note that DABUR has been slow in
raising prices and this has impacted margins. The management is contemplating
gradual price increases to recover profit margins.
DABUR is expanding its rural distribution meaningfully, which will enable it to
grow ahead of the market and increase market share even if rural growth slows
down.
The management expects competitive intensity to sustain in major businesses,
including shampoos and skin care. DABUR intends to focus on the economy
segment of oral care, as Babool has not been showing any meaningful traction.
Steep margin contraction in consumer care (consolidated)
Year Ended March
Net Sales (INR m)
Consumer Care
Foods
Retail
Others
EBIT (INR m)
Consumer Care
Foods
Retail
Others
EBIT Margin (%)
Consumer Care
Foods
Retail
Others
4QFY12
13,636
11,400
1,613
123
500
2,882
2,595
302
(29)
15
22.8
18.7
(23.9)
2.9
4QFY11
11,943
9,508
1,261
67
247
2,648
2,415
235
(23)
21
25.4
18.6
(33.6)
8.5
% Chg
14.2
19.9
28.0
83.0
102.2
8.8
7.5
28.7
30.2
-30.3
-2.6
0.1
9.7
-5.6
FY12
52,832
44,896
6,022
424
1,490
10,822
9,755
1,111
(116)
73
21.7
18.4
(27.4)
4.9
FY11
43,926
34,813
4,933
205
823
9,861
8,975
941
(91)
36
% Chg
20.3
29.0
22.1
106.7
81.0
9.8
8.7
18.0
27.2
101.4
-4.1
-0.6
17.1
0.5
MOSL
25.8
19.1
(44.6)
4.4
Source: Company,
2 May 2012
3

Dabur India
IBD and hair care drive overall growth
Category Growth (%) 1QFY11
Hair Care
8.9
Health Supplements 43.0
Oral Care
20.2
Foods
21.2
Digestives
14.7
Skin care
12.4
Home Care
31.5
IBD (organic)
28.7
2QFY11
2.7
29.4
10.4
21.4
14.1
9.6
43.3
17.9
3QFY11
3.8
12.7
9.4
42.0
11.3
18.0
24.2
14.2
4QFY11
11.1
20.7
8.9
30.1
-3.8
26.3
31.1
9.9
1QFY12
9.0
0.0
12.7
31.5
7.8
16.3
24.9
12.5
2QFY12 3QFY12 4QFY12
15.9
19.6
19.8
7.8
13.5
10.9
6.0
11.6
7.7
27.5
17.4
30.4
3.8
19.3
19.4
0.0
4.9
17.6
0.5
18.0
18.0
22.8
37.8
45.8
Source: Company/MOSL
International margins still under pressure; 35% organic constant currency
revenue growth led by GCC, Egypt and Nigeria
International business organic sales grew 45.8% in INR terms and 35% in constant
currency terms; growth was largely led by volumes and by 28%, 29% and 34%
constant currency growth in GCC, Egypt and Nigeria, respectively.
Hobi posted revenue of INR340m (22% growth) while Namaste posted sales of
INR547m (16% growth).
International subsidiaries reported 34% increase in sales to INR3.8b, with EBITDA
margin expanding 170bp. EBIDTA increased 52%; PAT grew 102%, led by strong
sales in GCC, Egypt and Nigeria on a low base.
Shampoos, hair creams and toothpastes were the growth drivers in international
markets.
DABUR has begun manufacturing Namaste products at the RAK unit. It will look at
the launch of these products in Africa in the current year. The company has also
introduced Hobi products in the MENA region and the modern trade channel in
India.
Headwinds for domestic volume growth and margins clearly visible; Neutral
DABUR has seen acceleration in the domestic market, though competitive intensity
and input cost environment remains a challenge. The company believes that the
huge distribution expansion it has planned in rural India will enable it to grow
ahead of the market.
We note that DABUR is facing aggression on the pricing and promotion front from
players like Colgate (toothpastes), HUL and P&G (shampoos), Marico (hair oils),
and a number of players in skin care. This is unlikely to change, as these players
have an eye on increasing market share. This will force DABUR to continue its
aggressive pricing and higher ad-spends, which will continue to impact profit
margins. DABUR seems comfortable with high ad-spends and benign pricing as
long as it is able to achieve growth. However, we believe that such a strategy can
prove counterproductive if demand slows down, more so in rural areas.
We expect higher growth in international business on a low base, as the GCC
region recovers; success of Namaste products in Africa will hold the key to any
meaningful increase in growth rates, in our view.
We marginally tweak our estimates by factoring in 100bp lower tax rate and INR1b
capex in Sri Lanka. We estimate 18.7% PAT CAGR over FY12-14.
The stock trades at 25.7x FY13E EPS of INR4.4 and 21.5x FY14E EPS of INR5.2.
Maintain
Neutral.
4
2 May 2012

Dabur India
Dabur India: an investment profile
Company description
Dabur India is the second largest FMCG company in India,
in terms of product portfolio. It is the market leader in
the
chyawanprash
category and is increasing its
presence in other traditional categories like hair care,
oral care, household care and foods. Dabur's acquisition
of Fem Care has given it a strategic presence in the high
potential skin care segment.
(aggressive strategy of Marico and Emami), (3)
shampoos (aggressive strategy of P&G, HUL, Garnier,
etc resulting in squeeze in sales growth and margins),
and (4) skin care (rising focus of MNCs on the mass
to mid-premium segment).
Recent developments
Dabur is setting up a beverage plant in Sri Lanka,
with a capacity of ~280,000 cases.
The company has launched new variants of Real
Juices - Plum, Pomegranate and Blueberries.
Dabur is expanding its distribution reach in rural India
very aggressively.
Key investment arguments
Strong herbal positioning, with little competition
from MNCs in categories like hair oil, CHD, health
supplements, etc.
Dabur has the second broadest product portfolio
(after HUL), with presence in high potential
categories like skin care, hair care, oral care and
health supplements.
The company is likely to be under MAT for the next
7-8 years, resulting in huge tax savings.
Valuation and view
Our EPS estimates are INR4.4 for FY13 and INR5.2 for
FY14, implying a PAT CAGR of 20% over FY12-14.
The stock trades at 25.7x FY13E EPS of INR4.4 and
21.5x FY14E EPS of INR5.2. Maintain
Neutral.
Key investment risks
Dabur has witnessed continued deceleration in
standalone sales over the past three quarters and
has been highly dependant on international
business for its PAT growth.
We believe that the company will face higher
competitive intensity in key business segments: (1)
toothpastes (likely entry of P&G), (2) hair oils
Comparative valuations
Dabur
P/E (x)
P/BV (x)
EV/Sales (x)
EV/EBITDA (x)
FY13E
FY14E
FY13E
FY14E
FY13E
FY14E
FY13E
FY14E
25.7
21.5
9.1
7.5
3.3
2.8
19.4
16.2
Marico
24.7
19.8
7.0
5.3
2.3
1.9
16.9
13.4
GCPL
24.7
20.2
5.7
5.0
3.2
2.6
18.1
14.7
Sector view
We have a cautious view on the sector due to
inflationary tendency, volatile input cost and a
possible slowdown in the rural economy.
Companies with low competitive pressures and
broad product portfolios will be able to better
withstand any slowdown in a particular segment.
Longer term prospects bright, given rising incomes
and low penetration.
EPS: MOSL forecast v/s consensus (INR)
MOSL
Consensus
Forecast
Forecast
FY13
4.40
4.43
FY14
5.20
5.23
Variation
(%)
-0.6
-0.6
Target Price and Recommendation
Current
Price (INR)
112
Target
Price (INR)
104
Upside
(%)
-6.9
Reco.
Neutral
Stock performance (1 year)
Shareholding pattern (%)
Promoter
Domestic Inst
Foreign
Others
2 May 2012
Mar-12
68.7
6.5
18.8
6.1
Dec-11
68.7
5.7
19.5
6.1
Mar-11
68.7
7.1
17.7
6.5
5

Dabur India
Financials and Valuation
2 May 2012
6

Dabur India
N O T E S
2 May 2012
7

Disclosures
This report is for personal information of the authorized recipient and does not construe to be any investment, legal or taxation advice to you. This research report does not constitute an offer, invitation or inducement
to invest in securities or other investments and Motilal Oswal Securities Limited (hereinafter referred as MOSt) is not soliciting any action based upon it. This report is not for public distribution and has been
furnished to you solely for your information and should not be reproduced or redistributed to any other person in any form.
Unauthorized disclosure, use, dissemination or copying (either whole or partial) of this information, is prohibited. The person accessing this information specifically agrees to exempt MOSt or any of its affiliates
or employees from, any and all responsibility/liability arising from such misuse and agrees not to hold MOSt or any of its affiliates or employees responsible for any such misuse and further agrees to hold MOSt
or any of its affiliates or employees free and harmless from all losses, costs, damages, expenses that may be suffered by the person accessing this information due to any errors and delays.
The information contained herein is based on publicly available data or other sources believed to be reliable. While we would endeavour to update the information herein on reasonable basis, MOSt and/or its
affiliates are under no obligation to update the information. Also there may be regulatory, compliance, or other reasons that may prevent MOSt and/or its affiliates from doing so. MOSt or any of its affiliates or
employees shall not be in any way responsible and liable for any loss or damage that may arise to any person from any inadvertent error in the information contained in this report . MOSt or any of its affiliates
or employees do not provide, at any time, any express or implied warranty of any kind, regarding any matter pertaining to this report, including without limitation the implied warranties of merchantability, fitness
for a particular purpose, and non-infringement. The recipients of this report should rely on their own investigations.
This report is intended for distribution to institutional investors. Recipients who are not institutional investors should seek advice of their independent financial advisor prior to taking any investment decision
based on this report or for any necessary explanation of its contents.
MOSt and/or its affiliates and/or employees may have interests/positions, financial or otherwise in the securities mentioned in this report. To enhance transparency, MOSt has incorporated a Disclosure of Interest
Statement in this document. This should, however, not be treated as endorsement of the views expressed in the report.
Disclosure of Interest Statement
1. Analyst ownership of the stock
2. Group/Directors ownership of the stock
3. Broking relationship with company covered
4. Investment Banking relationship with company covered
Dabur India
No
No
No
No
Analyst Certification
The views expressed in this research report accurately reflect the personal views of the analyst(s) about the subject securities or issues, and no part of the compensation of the research analyst(s) was, is, or
will be directly or indirectly related to the specific recommendations and views expressed by research analyst(s) in this report. The research analysts, strategists, or research associates principally responsible
for preparation of MOSt research receive compensation based upon various factors, including quality of research, investor client feedback, stock picking, competitive factors and firm revenues.
Regional Disclosures (outside India)
This report is not directed or intended for distribution to or use by any person or entity resident in a state, country or any jurisdiction, where such distribution, publication, availability or use would be contrary to
law, regulation or which would subject MOSt & its group companies to registration or licensing requirements within such jurisdictions.
For U.K.
This report is intended for distribution only to persons having professional experience in matters relating to investments as described in Article 19 of the Financial Services and Markets Act 2000 (Financial
Promotion) Order 2005 (referred to as "investment professionals"). This document must not be acted on or relied on by persons who are not investment professionals. Any investment or investment activity to
which this document relates is only available to investment professionals and will be engaged in only with such persons.
For U.S.
MOSt is not a registered broker-dealer in the United States (U.S.) and, therefore, is not subject to U.S. rules. In reliance on the exemption from registration provided by Rule 15a-6 of the U.S. Securities Exchange
Act of 1934, as amended (the "Exchange Act") and interpretations thereof by the U.S. Securities and Exchange Commission ("SEC") in order to conduct business with Institutional Investors based in the U.S.,
Motilal Oswal has entered into a chaperoning agreement with a U.S. registered broker-dealer, Marco Polo Securities Inc. ("Marco Polo").
This report is intended for distribution only to "Major Institutional Investors" as defined by Rule 15a-6(b)(4) of the Exchange Act and interpretations thereof by SEC (henceforth referred to as "major institutional
investors"). This document must not be acted on or relied on by persons who are not major institutional investors. Any investment or investment activity to which this document relates is only available to major
institutional investors and will be engaged in only with major institutional investors.
The Research Analysts contributing to the report may not be registered /qualified as research analyst with FINRA. Such research analyst may not be associated persons of the U.S. registered broker-dealer, Marco
Polo and therefore, may not be subject to NASD rule 2711 and NYSE Rule 472 restrictions on communication with a subject company, public appearances and trading securities held by a research analyst account.
Motilal Oswal Securities Ltd
3rd Floor, Hoechst House, Nariman Point, Mumbai 400 021
Phone: (91-22) 39825500 Fax: (91-22) 22885038. E-mail: reports@motilaloswal.com