8 May 2012
4QFY12 Results Update | Sector: Financials
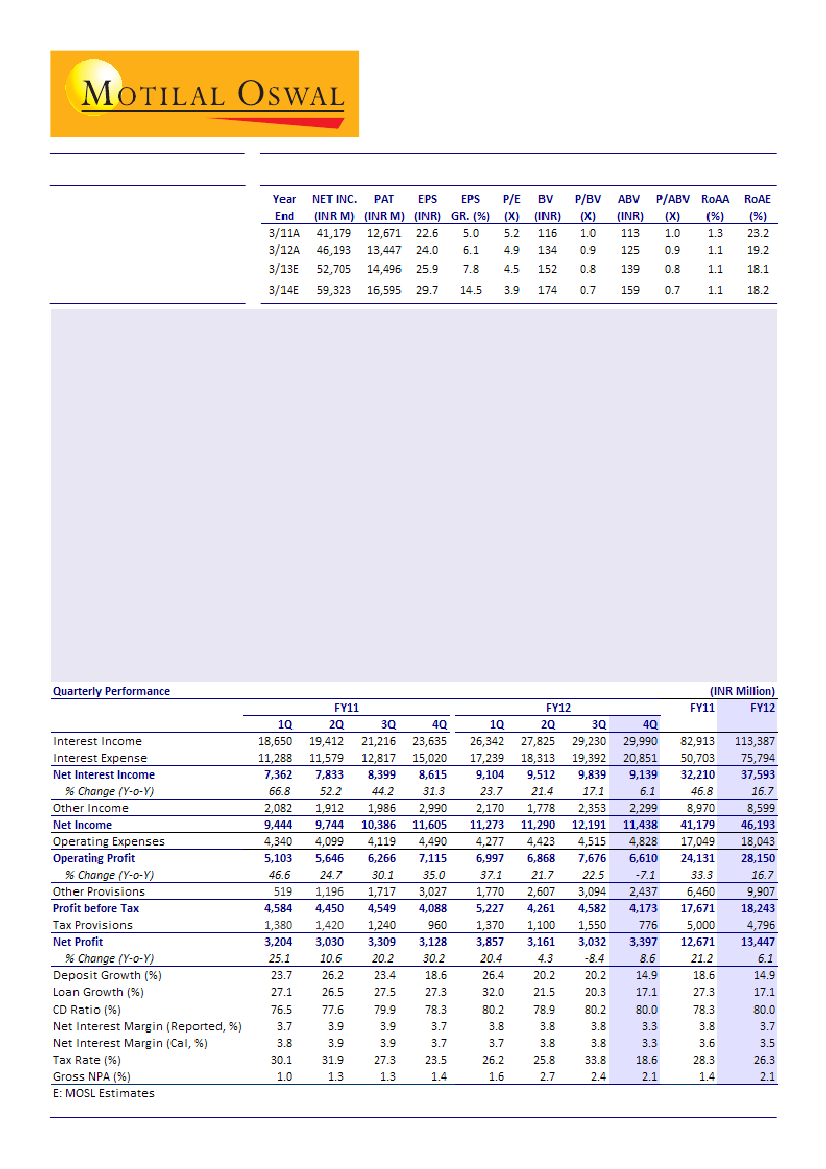
Andhra Bank
BSE SENSEX
S&P CNX
16,564
Bloomberg
Equity Shares (m)
52-Week Range (INR)
1,6,12 Rel.Perf.(%)
M.Cap. (INR b)
M.Cap. (USD b)
5,000
ANDB IN
559.6
148/79
1/5/-7
65.5
1.2
CMP: INR117
TP: INR150
Buy
Andhra Bank (ANDB) reported PAT growth of ~9% YoY and 12% QoQ to INR3.4b, 26% higher than our estimate of
INR2.7b. While operating profit was 6% lower than our estimate, lower provisions (INR2.4b v/s our estimate of
INR3b) and tax rate (19% v/s our estimate of 33%) boosted profitability.
Key highlights:
Margins impacted by one-offs:
Reported margins declined ~45bp QoQ to 3.3%, led by (1) higher interest
income reversals of ~INR1b on restructured loans and agricultural loans, and (2) 8bp QoQ increase in cost of
funds. Adjusted for one-off interest income reversal, margin decline would have been lower at 10bp QoQ.
Strong recoveries leading to negative net slippages - a positive surprise:
In 4QFY12, net slippages were a
negative INR791m (v/s negative net slippages of INR1b in 3QFY12), led by strong recoveries from system-
based NPAs. Despite this strong performance, ANDB made aggressive NPA provisions (INR1b in 4QFY12 v/s
INR395m in 3QFY12). As a result of which PCR (cal) improved to 58% (~50% in 3QFY12).
Healthy business growth:
On a sequential basis, both loans and deposits grew 7%. On a YoY basis, loans grew
17% while deposits grew 15%. CD ratio remained elevated at 80%.
Sharp increase in restructured loans:
In 4QFY12, ANDB restructured loans of INR23b, of which two large accounts
formed INR18.3b.Net outstanding restructured loans stood at INR59.5b, 7% of overall loans.
Valuation view:
While the muted performance on core income in 4QFY12 was a negative surprise, strong
performance on asset quality partially negated the impact. Over past two quarters ANDB has been delivering
strong performance on asset quality led by strong upgrades and recoveries and continuous traction in the same
could lead to earnings upgrade. Stock is trading at an attractive valuation with a dividend yield of 4.7%.
Buy.
Alpesh Mehta
(Alpesh.Mehta@MotilalOswal.com) + 91 22 3982 5415
Sohail Halai
(Sohail.Halai@motilaloswal.com)+ 91 22 3982 5430

Andhra Bank
Quarterly performance: Lower provision and tax rate drives PAT (INR m)
Y/E MARCH
Net Interest Income
% Change (Y-o-Y)
Other Income
Net Income
Operating Expenses
Operating Profit
% Change (Y-o-Y)
Other Provisions
Profit before Tax
Tax Provisions
Net Profit
% Change (Y-o-Y)
4QFY12A
9,139
6.1
2,299
11,438
4,828
6,610
-7.1
2,437
4,173
776
3,397
8.6
4QFY12E Var. (%)
9,703
-6
12.6
2,500
-8
12,203
-6
5,187
-7
7,016
-6
-1.4
3,004
-19
4,012
4
1,314
-41
2,698
26
-13.7
Comments
Margin decline ~45bp QoQ led by one-off; Adj. margin declined 10bp QoQ
Muted fee income growth; Lower forex and trading income YoY
Lower core income leading to below est operating profit
Strong performance on asset quality
While operating profit was 6% below est, lower provisions and tax
rate drives PAT
Source: Company/MOSL
Margins impacted by one-offs; Adjusted margin declined 10bp QoQ
Despite healthy loan growth of 17% YoY and 7% QoQ during the quarter, NII declined
7% QoQ (grew 6% YoY) to INR9.1b (6% below our estimate), led by ~45bp QoQ decline
in NIM to 3.3%. The steep sequential decline in NIM could be attributed to (1) higher
interest income reversal of ~INR1b (margin impact of 35bp+) on restructured loans
and agricultural loans, and (2) 8bp QoQ increase in cost of funds.
Adjusted for one-off interest income reversal, margin decline would have been lower
at just 10bp QoQ and NII would have grown 4% QoQ and 18% YoY. While yield on loans
declined 43bp QoQ to 12.3%, yield on investments was up 10bp QoQ to 7.9%, providing
some cushion to margins. With relatively low CASA ratio and high dependence on
bulk deposits (27% of overall deposits), NIM would remain under pressure in 1QFY13,
as well. The management has guided NIM of 3.35-3.45% for FY13.
Loan growth driven by SME and agriculture segment; CD ratio at 80%
Loans grew 7% QoQ and 17% YoY to INR847b, while deposits grew 7% QoQ and 15%
YoY to INR1.05t. CD ratio remained elevated at 80%. ANDB continues to tap refinancing
and foreign currency borrowing opportunities to fund growth and expects to maintain
CD ratio at 78-80%.
Incremental loan growth during the quarter was driven by the agriculture (+10% QoQ;
+20% YoY) and SME segments (+11% QoQ; +18% YoY). Retail loans grew at a modest
pace of 3% QoQ and 8% YoY. The management has guided loan and deposit growth of
20% each for FY13.
CASA ratio largely stable QoQ
CASA grew ~just 4% YoY and 6% QoQ to INR279b. CA deposits grew 15% QoQ, but
declined 11% YoY, leading to moderation in YoY CASA growth. SA deposits grew just
4% QoQ and 10% YoY. CASA ratio stood at 26.4% v/s 26.6% in 3QFY12 and 29% in 4QFY11.
Bulk deposits as a proportion of overall deposits stood at 27%.
Fee income muted; recoveries remain strong
Non-interest income declined 2% QoQ and 23% YoY, led by muted core fee income
growth and lower forex income. Core fee income growth was largely flat both on a
QoQ and a YoY basis.
8 May 2012
2

Andhra Bank
While income from CEB (commission, exchange and brokerage) grew 6% QoQ and
19% YoY, lower income from processing fees (INR361m v/s INR527m in 3QFY12 and
INR502m in 4QFY11) led to the muted performance.
Income from forex was INR57m v/s INR308m in 3QFY12 and INR338m in 4QFY11. Trading
income was INR232m in 4QFY12 v/s INR163m in 3QFY12 and INR652m in 4QFY11. Income
from recoveries from written-off accounts was strong, growing 12% YoY and 2.3x QoQ
to INR200m.
Asset quality improves QoQ led by strong recoveries and upgrades
In 4QFY12, net slippages were a negative INR791m (v/s negative net slippages of
INR1b in 3QFY12 and +INR11.5b in 1HFY12) - a key positive. Strong recoveries from
system-based NPAs have led to this impressive performance. GNPAs declined by 5%
QoQ in absolute terms and by 26bp QoQ in percentage terms to 2.1%.
Despite strong performance on the asset quality front, ANDB made aggressive NPA
provisions (INR1b in 4QFY12 v/s INR395m in 3QFY12; utilized the benefit of lower tax
rate), leading to a sharp decline in NNPAs (down 20% QoQ). In percentage terms,
NNPAs declined 30bp QoQ to 0.9%. PCR (calculated) improved to 58% (~50% in
3QFY12), and PCR including technical write-off stood at 71.1% (65.4% in 3QFY12).
The management has guided gross slippage ratio of 1.25-1.5% for FY13. However,
with strong traction in recoveries and upgradations, management expects to contained
GNPAs sub INR15b v/s INR18b in FY12.
INR23b addition to restructured portfolio during the quarter
Restructured loans increased sharply to INR74.5b (+43% QoQ) and now constitute
8.8% of the outstanding loans. During the quarter, ANDB restructured loans of INR23b,
of which INR6.3b was towards Air India exposure and INR12b towards Rajasthan SEB
exposure; excluding these two large accounts, restructured loans stand at 6.6% of the
loan book (stable QoQ).
Net outstanding restructured loans stood at INR59.5b (7% of overall loans). Based on
the current pipeline, the management does not expect restructuring to increase
significantly in 1QFY13.
Other highlights:
(1) Overall CAR stood at 13.2% with tier-1 at 9%, however core Tier I stood at 8.8%
(2) ANDB declared a dividend of INR5.5/share; dividend yield of 4.7%.
Valuation and view
During the quarter, ANDB surprised negatively on NIM and fee income. The sharp
QoQ decline of 50bp in NIM was on account of one-offs, adjusted for which NIM
decline would have been lower at just 10bp. We expect margins to be relatively
stable (down 5bp) in FY13. However, faster than anticipated decline in bulk deposit
rate coupled with strong momentum in recoveries could lead to a positive surprise
on margins.
8 May 2012
3

Andhra Bank
Over the last two quarters, ANDB has been delivering strong performance on asset
quality, led by strong upgrades and recoveries. For 2HFY12, net slippages were negative
at INR1.8b as against net slippages of +INR11.5b in 1HFY12. The steep increase in
restructured portfolio was largely in line with peers. However, excluding Air India
and SEB exposure, outstanding net restructured loans as a percentage of overall loans
stood at 4.9%, largely in line with peers. We model slippage ratio of 2.75% in FY13 and
2.5% in FY14 v/s 3.1% in FY12, and credit cost of 0.9% over FY13-14 v/s 0.6% in FY12. Our
estimates of credit cost are conservative and continuous traction in recoveries from
small value accounts could lead to earnings upgrade.
We expect ANDB to report EPS of INR26 and INR30 and BV of INR152 and INR174 for
FY13 and FY14, respectively. While the muted performance on core income during
the quarter was a negative surprise, strong performance on asset quality partially
negated the impact. For FY13/14, we estimate RoA at 1%+ and RoE at 18%+. The stock
trades at attractive valuations of 0.8x FY13E and 0.7x FY14E BV, with a dividend yield of
4.7%. Maintain
Buy.
We upgrades oue estimates by 2/3% for FY13/14 (INR b)
Old Estimates
FY13
FY14
41.9
46.9
9.8
10.8
51.7
57.7
20.5
23.0
31.1
34.7
10.8
11.8
20.4
22.9
6.1
6.9
14.3
16.0
978
1,154
1,240
1,476
3.4
3.2
0.9
0.9
1.1
1.0
18.0
17.8
Rev. Estimates
FY13
FY14
43.0
48.4
9.7
11.0
52.7
59.3
21.2
23.7
31.5
35.6
10.8
11.9
20.7
23.7
6.2
7.1
14.5
16.6
970
1,145
1,238
1,461
3.4
3.3
0.9
0.9
1.1
1.1
18.1
18.2
Change (%)
FY13
FY14
2.5
3.2
-0.3
1.7
2.0
2.9
3.2
3.1
1.2
2.7
0.2
1.1
1.7
3.5
1.7
3.5
1.7
3.5
-0.8
-0.8
-0.1
-1.0
Net Interest Income
Other Income
Total Income
Operating Expenses
Operating Profits
Provisions
PBT
Tax
PAT
Loans
Deposits
Margins (%)
Credit Cost (%)
RoA (%)
RoE (%)
Source: MOSL
One year forward P/E
One year forward P/BV
8 May 2012
4

Andhra Bank
Quaterly trends
Business growth remains moderates
CD ratio remains at an elevated level (%)
Both loans and deposits grew at 7% QoQ, Management
guided for business growth of 20%+ for FY13
Continuous tapping of re-financing window and foreign
currency borrowing is leading to higher CD ratio
CASA ratio declines marginally QoQ (%)
NIM declines 45bp QoQ, led by one-offs (%)
CA deposits grew 15% QoQ , though declined 11% YoY
leading to moderation in YoY CASA growth. SA deposits
grew just 4% QoQ and 10% YoY
Margin decline 45bp QoQ led by one-offs; adjusted for
which decline would have been lower at 10bp
Net slippages negative - a positive surprise (INR b)
GNPAs decline 5% QoQ; PCR improves sharply
Net slippages were negative at INR791m, led by strong
recoveries from system-based NPAs.
Aggressive NPA provisions despite negative net slippages
led to sharp decline in NNPAs (down 20% QoQ)
8 May 2012
5

Andhra Bank
Quarterly Snapshot
1Q
2Q
FY11
3Q
4Q
1Q
2Q
FY12
3Q
4Q
Variation (%)
QoQ
YoY
-7
-2
42
132
-82
1
-6
7
12
-2
-14
-21
164
-9
-50
12
-5
-20
-26
-30
803
6
-23
-64
12
-83
-1
-1
8
7
8
-7
-20
-49
2
-19
9
81
173
74
53
N.A.
14.8
44.5
28.3
13.9
41.0
26.3
Cumulative Numbers
FY11
FY12 YoYGr (%)
32,209
8,970
1,408
505
944
6,113
41,179
17,049
11,042
6,007
24,130
6,459
4,682
17,671
5,000
12,671
37,593
8,599
1,209
372
613
6,406
46,193
18,043
11,499
6,543
28,150
9,907
4,817
18,243
4,796
13,447
17
-4
-14
-26
-35
5
12
6
4
9
17
53
3
3
-4
6
Profit and Loss (INR m)
Net Interest Income
7,362 7,833 8,399 8,615 9,104 9,512 9,839 9,139
Other Income
2,082 1,912 1,986 2,990 2,170 1,778 2,353 2,299
Trading profits
476
181
99
652
594
222
163
232
Recoveries
91
105
130
178
45
41
86
200
Forex
207
243
156
338
185
64
308
57
Others (Ex non core) 1,307 1,383 1,601 1,822 1,347 1,452 1,796 1,811
Total Income
9,444 9,744 10,386 11,605 11,273 11,290 12,191 11,438
Operating Expenses
4,340 4,099 4,119 4,490 4,277 4,423 4,515 4,828
Employee
2,870 2,601 2,595 2,976 2,731 2,736 2,847 3,186
Others
1,471 1,498 1,524 1,514 1,546 1,687 1,668 1,643
Operating Profits
5,103 5,646 6,266 7,115 6,997 6,868 7,676 6,610
Provisions
519 1,196 1,717 3,027 1,770 2,607 3,094 2,437
of which NPA
174
957 1,523 2,028 1,171 2,209
395 1,042
PBT
4,584 4,450 4,549 4,088 5,227 4,261 4,582 4,173
Taxes
1,380 1,420 1,240
960 1,370 1,100 1,550
776
PAT
3,204 3,030 3,309 3,128 3,857 3,161 3,032 3,397
Asset Quality
GNPA
5,793 7,702 8,723 9,956 11,764 19,871 18,841 17,980
NNPA
1,698 2,934 3,081 2,764 3,374 10,867 9,433 7,559
GNPA (%)
1.0
1.3
1.3
1.4
1.6
2.7
2.4
2.1
NNPA (%)
0.3
0.5
0.5
0.4
0.5
1.5
1.2
0.9
PCR (Calculated, %)
70.7
61.9
64.7
72.2
71.3
45.3
49.9
58.0
Ratios (%)
Fees to Total Income
13.8
14.2
15.4
15.7
11.9
12.9
14.7
15.8
Cost to Core Income
50.1
44.5
41.2
43.0
40.9
40.3
38.8
44.1
Tax Rate
30.1
31.9
27.3
23.5
26.2
25.8
33.8
18.6
CASA (Reported)
29.6
30.4
28.5
29.1
26.8
26.1
26.6
26.4
Loan/Deposit
76.5
77.6
79.9
78.3
80.2
78.9
80.2
80.0
CAR
13.8
12.4
12.0
14.4
13.2
13.1
12.6
13.2
Tier I
8.4
7.3
7.1
9.7
8.8
8.8
8.2
9.0
Margins (%)
Yield on loans
10.9
11.0
11.1
11.6
12.2
12.5
12.8
12.3
Yield On Investments
6.8
7.4
7.5
7.4
7.7
7.8
7.8
7.9
Cost of deposits
5.5
5.7
5.8
6.5
7.0
7.5
7.6
7.9
Margins
3.7
3.9
3.9
3.7
3.8
3.8
3.8
3.3
Balance Sheet (INR B)
Loans
571
610
656
722
757
745
792
847
Deposits
747
786
821
922
944
944
987 1,059
CASA Deposits
221
239
234
268
253
247
263
279
of which Savings
169
178
182
196
197
194
207
216
Current
52
61
52
72
56
53
55
64
Break up of Loans
Agriculture Adv
89
96
101
104
105
108
114
125
SME Credit
88
92
98
111
116
115
119
131
Retail Loans
88
92
100
105
109
110
109
113
Other loans
307
329
357
402
428
412
450
478
For %age change QoQ and YoY is bp
-43
10
35
-47
7
7
6
4
15
10
11
3
6
73
49
146
-35
17
15
4
10
-11
20
18
8
19
11.14
7.26
5.87
3.81
12.44
7.79
7.50
3.69
Source: Company/MOSL
8 May 2012
6

Andhra Bank
Stock Info
EPS: MOSL forecast v/s consensus (INR)
MOSL
Forecast
25.9
29.7
Consensus
Forecast
26.0
29.9
Variation
(%)
-0.4
-0.7
1-year Sensex rebased
FY13
FY14
Shareholding pattern (%)
Promoter
Domestic Inst
Foreign
Others
Mar-12
58.0
15.3
13.6
13.1
Dec-11
58.0
15.4
13.3
13.4
Mar-11
58.0
14.7
14.8
12.5
8 May 2012
7

Andhra Bank
Financials and Valuation
8 May 2012
8

Andhra Bank
Financials and Valuation
8 May 2012
9

Disclosures
This report is for personal information of the authorized recipient and does not construe to be any investment, legal or taxation advice to you. This research report does not constitute an offer, invitation or inducement
to invest in securities or other investments and Motilal Oswal Securities Limited (hereinafter referred as MOSt) is not soliciting any action based upon it. This report is not for public distribution and has been
furnished to you solely for your information and should not be reproduced or redistributed to any other person in any form.
Unauthorized disclosure, use, dissemination or copying (either whole or partial) of this information, is prohibited. The person accessing this information specifically agrees to exempt MOSt or any of its affiliates
or employees from, any and all responsibility/liability arising from such misuse and agrees not to hold MOSt or any of its affiliates or employees responsible for any such misuse and further agrees to hold MOSt
or any of its affiliates or employees free and harmless from all losses, costs, damages, expenses that may be suffered by the person accessing this information due to any errors and delays.
The information contained herein is based on publicly available data or other sources believed to be reliable. While we would endeavour to update the information herein on reasonable basis, MOSt and/or its
affiliates are under no obligation to update the information. Also there may be regulatory, compliance, or other reasons that may prevent MOSt and/or its affiliates from doing so. MOSt or any of its affiliates or
employees shall not be in any way responsible and liable for any loss or damage that may arise to any person from any inadvertent error in the information contained in this report . MOSt or any of its affiliates
or employees do not provide, at any time, any express or implied warranty of any kind, regarding any matter pertaining to this report, including without limitation the implied warranties of merchantability, fitness
for a particular purpose, and non-infringement. The recipients of this report should rely on their own investigations.
This report is intended for distribution to institutional investors. Recipients who are not institutional investors should seek advice of their independent financial advisor prior to taking any investment decision
based on this report or for any necessary explanation of its contents.
MOSt and/or its affiliates and/or employees may have interests/positions, financial or otherwise in the securities mentioned in this report. To enhance transparency, MOSt has incorporated a Disclosure of Interest
Statement in this document. This should, however, not be treated as endorsement of the views expressed in the report.
Disclosure of Interest Statement
1. Analyst ownership of the stock
2. Group/Directors ownership of the stock
3. Broking relationship with company covered
4. Investment Banking relationship with company covered
Andhra Bank
No
No
No
No
Analyst Certification
The views expressed in this research report accurately reflect the personal views of the analyst(s) about the subject securities or issues, and no part of the compensation of the research analyst(s) was, is, or
will be directly or indirectly related to the specific recommendations and views expressed by research analyst(s) in this report. The research analysts, strategists, or research associates principally responsible
for preparation of MOSt research receive compensation based upon various factors, including quality of research, investor client feedback, stock picking, competitive factors and firm revenues.
Regional Disclosures (outside India)
This report is not directed or intended for distribution to or use by any person or entity resident in a state, country or any jurisdiction, where such distribution, publication, availability or use would be contrary to
law, regulation or which would subject MOSt & its group companies to registration or licensing requirements within such jurisdictions.
For U.K.
This report is intended for distribution only to persons having professional experience in matters relating to investments as described in Article 19 of the Financial Services and Markets Act 2000 (Financial
Promotion) Order 2005 (referred to as "investment professionals"). This document must not be acted on or relied on by persons who are not investment professionals. Any investment or investment activity to
which this document relates is only available to investment professionals and will be engaged in only with such persons.
For U.S.
MOSt is not a registered broker-dealer in the United States (U.S.) and, therefore, is not subject to U.S. rules. In reliance on the exemption from registration provided by Rule 15a-6 of the U.S. Securities Exchange
Act of 1934, as amended (the "Exchange Act") and interpretations thereof by the U.S. Securities and Exchange Commission ("SEC") in order to conduct business with Institutional Investors based in the U.S.,
Motilal Oswal has entered into a chaperoning agreement with a U.S. registered broker-dealer, Marco Polo Securities Inc. ("Marco Polo").
This report is intended for distribution only to "Major Institutional Investors" as defined by Rule 15a-6(b)(4) of the Exchange Act and interpretations thereof by SEC (henceforth referred to as "major institutional
investors"). This document must not be acted on or relied on by persons who are not major institutional investors. Any investment or investment activity to which this document relates is only available to major
institutional investors and will be engaged in only with major institutional investors.
The Research Analysts contributing to the report may not be registered /qualified as research analyst with FINRA. Such research analyst may not be associated persons of the U.S. registered broker-dealer, Marco
Polo and therefore, may not be subject to NASD rule 2711 and NYSE Rule 472 restrictions on communication with a subject company, public appearances and trading securities held by a research analyst account.
Motilal Oswal Securities Ltd
3rd Floor, Hoechst House, Nariman Point, Mumbai 400 021
Phone: (91-22) 39825500 Fax: (91-22) 22885038. E-mail: reports@motilaloswal.com