9 May 2012
4QFY12 Results Update | Sector: Utilities
CESC
BSE SENSEX
16,546
Bloomberg
Equity Shares (m)
52-Week Range (INR)
1,6,12 Rel. Perf. (%)
M.Cap. (INR b)
M.Cap. (USD b)
S&P CNX
5,000
CESC IN
125.6
364/186
0/-1/2
33.2
0.6
* Excl Spencers; fully diluted
CMP: INR262
TP: INR439
Buy
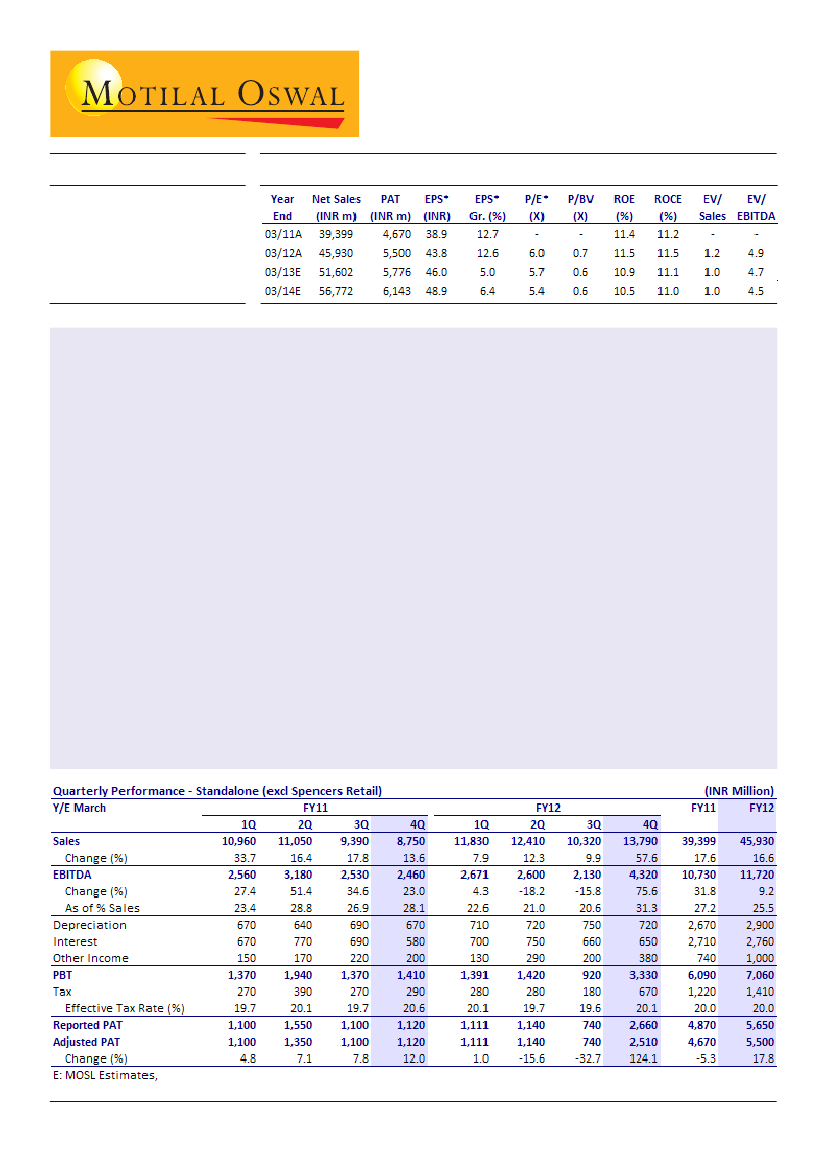
4QFY12 operating results in-line, adjusted PAT boosted by higher other income:
CESC reported 4QFY12 PAT of
INR2.7b and PAT adjusted for sale of scrap of INR150m stood at INR2.5b v/s our estimate of INR2.1b. PAT during
the quarter boosted by other income and arrears recovery. Other income (including operating other income)
stood at INR690m for 4QFY12, ~INR400m higher than our estimate. Also, the tariff order approval led to
increase in core earnings for CESC by ~INR400m.
Steady state operating performance:
During the quarter power generation stood at 2BUs, up 9% YoY while
sales stood at 1.8BUs units (up 3% YoY). Average PLF for the plant stood at 77% v/s 68% YoY. For FY12 PLF for
Budge Budge stands at 90% (vs 83% YoY), Titagarh at 81% (vs 89% YoY), and Southern project at 87% (vs 92%
YoY). CESC purchased ~206MUs in 4Q to meet the power demand for the Kolkatta region and power demand
grew by 3.3% YoY to 2.1BUs.
Tariff order approval improves visibility on core profits, entails higher RoEs:
CESC has got the tariff order
approved for FY12-14E with average capex of INR6b for its distribution business. As a result, its RoE improved
150bp for both its generation and distribution businesses. This has meaningfully improved the core profitability
for the company. We expect CESC's RAB (i.e. regulated equity) to grow from INR25b in FY12 to INR29b in FY14
and core profit to grow from INR3.9b in FY12 to INR4.5b in FY14.
Spencer: Consolidation continues, focus on improving sales, operating profits:
In FY12, Spencer continued to
improve its operating performance with focus on higher sales, consolidation and cost control/efficiencies.
During the year, Spencer closed 35 Small Express Stores, opened 5 Hyper/2 Super Stores and average revenue
grew 11% YoY to INR1,060/sft/month, while same store sales grew 14% to INR1,147/sft/month.
Valuation and view:
We expect CESC to report standalone PAT of INR5.8b in FY13 (up 5% YoY) and INR6.1b in
FY14 (up 6% YoY). Stock trades at P/E of 6x FY13E standalone. Maintain
Buy
with SOTP based TP of INR439/sh.
Nalin Bhatt
(NalinBhatt@MotilalOswal.com) +91 22 3982 5429
Satyam Agarwal
(AgarwalS@MotilalOswal.com)
/
Vishal Periwal
(Vishal.Periwal@MotilalOswal.com)

CESC
4QFY12 performance ahead of estimates
CESC reported 4QFY12 PAT of INR2.7b and PAT adjusted for sale of scrap of INR150m
stood at INR2.5b v/s our estimate of INR2.1b. PAT during the quarter boosted by
other income and arrears recovery. Other income for the quarter stood at INR380m
v/s our estimates of INR213m and operating other income stood at INR310m, vs
INR130m QoQ. Our estimates has factored in ~INR400m of positive contribution
from change in RoE to 15.5% from 14% earlier, which is accounted in 4Q including
arrears for past 9MFY12.
During 4QFY12 fuel cost for CESC increased by 33% YoY and 4% QoQ and stood at
INR2.1/unit. CESC currently procures ~40% of its requirement from CIL.
For FY12, the reported net profit for the company stood at INR5.7b (up 21% YoY),
led by increase in core regulated profit owing to approval of tariff order. We
understand that benefit owing to change in RoE by 150bps for both its generation
and distribution was INR400m. Also, the higher other income and operating other
income boosted reported PAT.
Uptick in other income boost PAT (INR m)
Source: Company/MOSL
Steady state operating performance
Power generation stood at 2BUs during 4QFY12, up 9% YoY while sales stood at
1.8BUs units (up 3% YoY). Average PLF for the plant stood at 77% v/s 68% YoY. For
FY12 PLF for Budge Budge stands at 90% (vs 83% YoY), Titagarh at 81% (vs 89% YoY),
and Southern project at 87% (vs 92% YoY).
CESC purchased ~206MUs in 4Q to meet the power demand for the Kolkatta region,
power demand grew by 3.3% YoY to 2.1BUs.
9 May 2012
2

CESC
Generation/PLF moved up YoY
Demand up YoY
Source: Company/MOSL
Tariff order approval improves visibility on core profits, entails higher RoEs
West Bengal State Electricity Regulatory Commission (WBERC) has increased the
base RoE for Generation and Transmission/Distribution by 1.5% to 15.5% and 16.5%
respectively. CESC's regulated assets are broadly divided as 45:55 in generation
and distribution. Thus, weighted average RoE is expected to increase to 16.1%
from 14.5% earlier. This has meaningfully improved the core profitability for the
company.
Also, the tariff order has further approved the maintenance capex for the business
over the next 3 years (FY12 to FY14) at INR19b (INR6b pa on an average). We
expect regulated equity (RAB) for CESC to grow from INR25b in FY12E to INR29b in
FY14E and core profit to grow from INR3.9b in FY12E to INR4.5b in FY14E.
Growth in regulated equity and core RoE to drive regulated earnings (INR m)
Opening RAB
RAB Addition
Closing RAB
RoE (%)
Core Income
FY11
21,490
1,813
23,303
14.5
3,239
FY12
23,303
1,847
25,150
16.1
3,901
FY13E
FY14E
25,150
27,106
1,956
1,914
27,106
29,020
16.1
16.1
4,207
4,518
Source: Company/MOSL
Spencer: Consolidation continues, focus on improving sales, operating profits
FY12, Spencer continued improvement in operating performance with focus on
higher sales, consolidation and cost control/efficiencies. Spencer has closed 35
Small Express Stores and opened 5 Hyper and 2 Super Stores in FY12. Average
revenue has grown by 11% YoY to INR1060/sft/month, while same store sales
grew by 14% to INR1147/sq.ft/month.
As at 4QFY12, Spencer's total store under operation stood 182 v/s 195 QoQ. During
the quarter itself, the company has closed 14 Daily Express Stores. Area under
operation now stands at at 1.009msft lower than 1.02msft QoQ. Sales during the
quarter has been muted at INR953/sft/month v/s INRINR975/sft/month.
This along with focus on cost control, efficiencies have led to improvement in
operating performance. For FY12, Store level EBITDA stood at INR32/sft/month
v/s 1HFY12 store level EBITDA of INR31/sft/month.
9 May 2012
3

CESC
Consolidation: Closure of Stores
Continues (No.)
4QFY12 Sales muted, FY12 Sales
stood at INR1060 (up 10% YoY)
Store EBITDA: FY12 Closed with positive
store level EBITDA (INR/Sft/month)
Source: Company/MOSL
Valuations and view
We expect CESC to report standalone net profit of INR5.8b in FY13 (up 5% YoY) and
INR6.1b in FY14 (up 6.4% YoY). Stock quotes at PER of 6x FY13E on standalone basis.
Maintain
Buy
with SOTP based TP of INR439/sh.
9 May 2012
4

CESC
CESC: an investment profile
Company description
CESC, an RPG Group Company is one of the oldest
integrated power utilities in India with presence in
mining, generation, and distribution of power. Installed
generation capacity stands at 1.2GW and distribution
network encompasses 2.3m consumers in Kolkata and
Howrah region. 1.2GW of generation projects are under
construction and additional 6GW of projects are in
pipeline. CESC has presence in retail business "Spencer"
which has ~1msf area under operations.
Key investment risk
Continued losses at Spencer retail and funding
through standalone cash flows of CESC.
Open capacity at Chandrapur project.
Recent development
Tariff Approval for the period of FY12-14 received
for Kolkatta Distribution business, Capex approved
at INR19b, RoE increased by 1.5%
Consolidation continues at Spencer where-in in FY12
Spencer has closed 35 Small Express Stores and
opened 5 Hyper and 2 Super Stores in FY12
Key investment positives
Assured return from existing generation /
distribution business provides steady cash flows
(regulated profit at INR4b+ pa)
1.2GW project has entered construction phase and
company has made equity investments of INR10b+.
Consolidation and restructuring at Spencers has led
to reduction in operational losses to INR1.7b in FY11,
vs INR2.1b in FY10. Further reduction in losses/value
unlocking opportunity is possible.
Project pipeline of 6GW provides growth
opportunity going forward.
Valuation and view
We expect CESC to report standalone net profit of
INR5.8b in FY13 (up 5% YoY) and INR6.1b in FY14 (up
6.4% YoY). Stock quotes at PER of 6x FY13E on
standalone basis. Maintain
Buy
with SOTP based TP
of INR439/sh.
EPS: Most forecast v/s consensus (INR)
MOSL
Forecast
46.0
48.9
Consensus
Forecast
37.3
42.3
Variation
(%)
23.2
15.5
Target price and recommendation
Current
Price (INR)
262
Target
Price (INR)
439
Upside
(%)
66
Reco.
Buy
FY12
FY13
Stock performance (1 year)
Shareholding pattern (%)
Mar-12
Promoter
Domestic Inst
Foreign
Others
52.5
16.8
17.9
12.9
Dec-11
52.5
16.6
18.2
12.8
Mar-11
52.5
17.4
18.7
11.4
9 May 2012
5

CESC
Financials and Valuations
9 May 2012
6

CESC
N O T E S
9 May 2012
7

Disclosures
This report is for personal information of the authorized recipient and does not construe to be any investment, legal or taxation advice to you. This research report does not constitute an offer, invitation or inducement
to invest in securities or other investments and Motilal Oswal Securities Limited (hereinafter referred as MOSt) is not soliciting any action based upon it. This report is not for public distribution and has been
furnished to you solely for your information and should not be reproduced or redistributed to any other person in any form.
Unauthorized disclosure, use, dissemination or copying (either whole or partial) of this information, is prohibited. The person accessing this information specifically agrees to exempt MOSt or any of its affiliates
or employees from, any and all responsibility/liability arising from such misuse and agrees not to hold MOSt or any of its affiliates or employees responsible for any such misuse and further agrees to hold MOSt
or any of its affiliates or employees free and harmless from all losses, costs, damages, expenses that may be suffered by the person accessing this information due to any errors and delays.
The information contained herein is based on publicly available data or other sources believed to be reliable. While we would endeavour to update the information herein on reasonable basis, MOSt and/or its
affiliates are under no obligation to update the information. Also there may be regulatory, compliance, or other reasons that may prevent MOSt and/or its affiliates from doing so. MOSt or any of its affiliates or
employees shall not be in any way responsible and liable for any loss or damage that may arise to any person from any inadvertent error in the information contained in this report . MOSt or any of its affiliates
or employees do not provide, at any time, any express or implied warranty of any kind, regarding any matter pertaining to this report, including without limitation the implied warranties of merchantability, fitness
for a particular purpose, and non-infringement. The recipients of this report should rely on their own investigations.
This report is intended for distribution to institutional investors. Recipients who are not institutional investors should seek advice of their independent financial advisor prior to taking any investment decision
based on this report or for any necessary explanation of its contents.
MOSt and/or its affiliates and/or employees may have interests/positions, financial or otherwise in the securities mentioned in this report. To enhance transparency, MOSt has incorporated a Disclosure of Interest
Statement in this document. This should, however, not be treated as endorsement of the views expressed in the report.
Disclosure of Interest Statement
1. Analyst ownership of the stock
2. Group/Directors ownership of the stock
3. Broking relationship with company covered
4. Investment Banking relationship with company covered
CESC
No
No
No
No
Analyst Certification
The views expressed in this research report accurately reflect the personal views of the analyst(s) about the subject securities or issues, and no part of the compensation of the research analyst(s) was, is, or
will be directly or indirectly related to the specific recommendations and views expressed by research analyst(s) in this report. The research analysts, strategists, or research associates principally responsible
for preparation of MOSt research receive compensation based upon various factors, including quality of research, investor client feedback, stock picking, competitive factors and firm revenues.
Regional Disclosures (outside India)
This report is not directed or intended for distribution to or use by any person or entity resident in a state, country or any jurisdiction, where such distribution, publication, availability or use would be contrary to
law, regulation or which would subject MOSt & its group companies to registration or licensing requirements within such jurisdictions.
For U.K.
This report is intended for distribution only to persons having professional experience in matters relating to investments as described in Article 19 of the Financial Services and Markets Act 2000 (Financial
Promotion) Order 2005 (referred to as "investment professionals"). This document must not be acted on or relied on by persons who are not investment professionals. Any investment or investment activity to
which this document relates is only available to investment professionals and will be engaged in only with such persons.
For U.S.
MOSt is not a registered broker-dealer in the United States (U.S.) and, therefore, is not subject to U.S. rules. In reliance on the exemption from registration provided by Rule 15a-6 of the U.S. Securities Exchange
Act of 1934, as amended (the "Exchange Act") and interpretations thereof by the U.S. Securities and Exchange Commission ("SEC") in order to conduct business with Institutional Investors based in the U.S.,
Motilal Oswal has entered into a chaperoning agreement with a U.S. registered broker-dealer, Marco Polo Securities Inc. ("Marco Polo").
This report is intended for distribution only to "Major Institutional Investors" as defined by Rule 15a-6(b)(4) of the Exchange Act and interpretations thereof by SEC (henceforth referred to as "major institutional
investors"). This document must not be acted on or relied on by persons who are not major institutional investors. Any investment or investment activity to which this document relates is only available to major
institutional investors and will be engaged in only with major institutional investors.
The Research Analysts contributing to the report may not be registered /qualified as research analyst with FINRA. Such research analyst may not be associated persons of the U.S. registered broker-dealer, Marco
Polo and therefore, may not be subject to NASD rule 2711 and NYSE Rule 472 restrictions on communication with a subject company, public appearances and trading securities held by a research analyst account.
Motilal Oswal Securities Ltd
3rd Floor, Hoechst House, Nariman Point, Mumbai 400 021
Phone: (91-22) 39825500 Fax: (91-22) 22885038. E-mail: reports@motilaloswal.com