21 May 2012
4QFY12 Results Update | Sector: Financials
State Bank of India
BSE SENSEX
16,153
S&P CNX
4,891
CMP: INR1,942
TP: INR2,725
Buy
Bloomberg
SBIN IN
Equity Shares (m)
671.0
52-Week Range (INR) 2,530/1,576
1,6,12 Rel.Perf.(%)
-8/14/-7
M.Cap. (INR b)
1,303.2
M.Cap. (USD b)
23.9
* Valuation multiples are adjusted for SBI Life's value
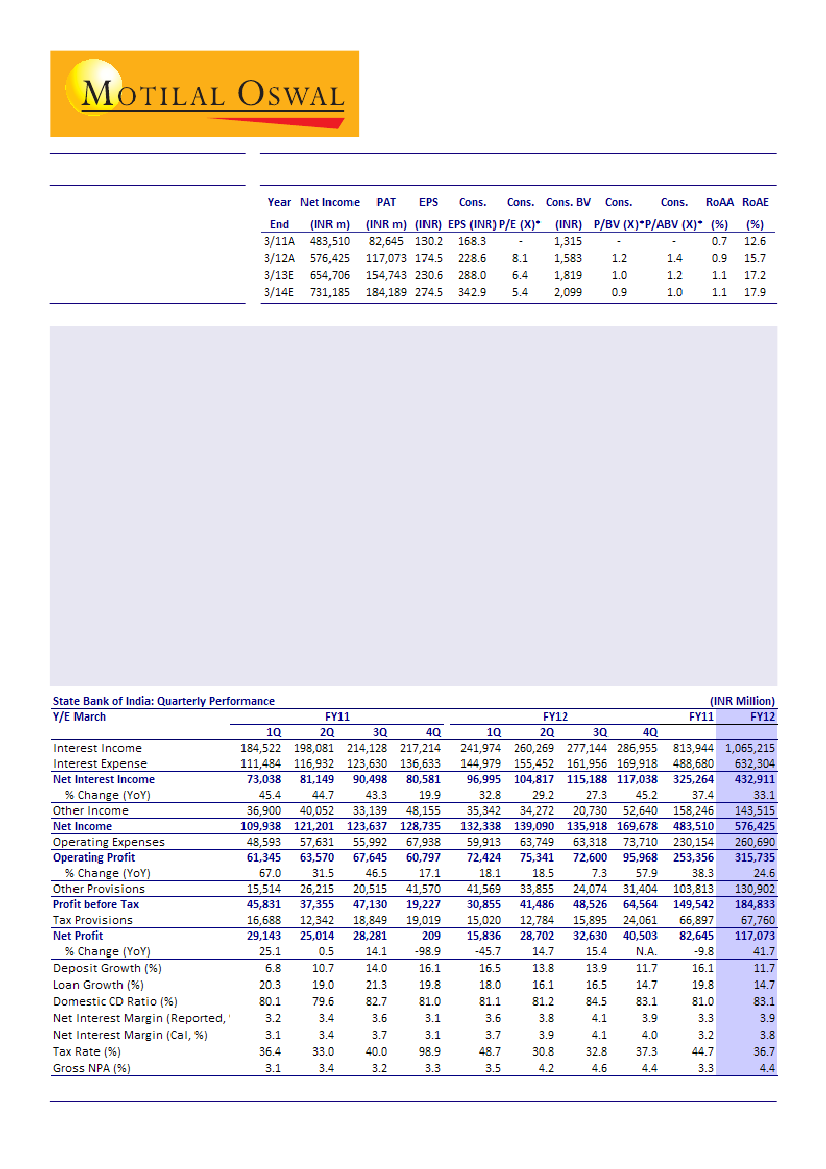
State Bank of India (SBIN) has posted a PAT of INR40.5b for 4QFY12, which is 19% higher than our estimate and an
all-time high quarterly profit. NII grew 45% YoY on a low base, while fee income grew 13% YoY – a positive
surprise. Strong improvement in asset quality was the highlight of the quarter.
Unlike its peers, SBIN’s asset quality improved QoQ, as net slippages were a negative INR3.4b – a big positive.
Fall in slippages across segments is comforting. SBIN prudently increased its PCR (including technical write-
offs) to 68% v/s 62% in 3QFY12.
In 4QFY12, fresh loans of INR51.3b (60bp of loans) were restructured, of which INR12b were on account of Air
India. Net of Air India, standard restructured loans stood at 3.5%, one of the lowest among PSBs.
Global margins declined 16bp QoQ to 3.9%, led by 11bp QoQ fall in domestic margins to 4.3% and 24bp QoQ
decline in international margins to 1.5%.
Gross loans grew 16% YoY and 3% QoQ, while deposits grew 12% YoY and 3% QoQ. Overall CD ratio moderated
to 83.1% from 84.5% in 3QFY12. CASA growth moderated to 6% YoY, led by CA declining 8% YoY. Reported CASA
ratio stood at 46.6% v/s 47.5% in 3QFY12.
Valuation and view:
We expect SBIN’s healthy margin performance to continue on the back of benefits related to
reduction in CRR and recent equity infusion. Sharp sequential decline in gross slippages across segments in
4QFY12 is comforting. Though we conservatively build in higher credit costs, earnings CAGR is likely to remain
strong at 25% over FY12-14. Continuous improvement in asset quality could lead to earnings upgrade.
Buy.
Alpesh Mehta
(Alpesh.Mehta@MotilalOswal.com) + 91 22 3982 5415
Sohail Halai
(Sohail.Halai@motilaloswal.com)+ 91223982 5430

State Bank of India
Quarterly performance v/s our estimates and reasons for deviation (INR m)
Y/E March
Net Interest Income
% Change (YoY)
Other Income
Net Income
Operating Expenses
Operating Profit
% Change (YoY)
Other Provisions
Profit Before Tax
Tax Provisions
Net Profit
% Change (YoY)
4QFY12A
117,038
45
52,640
169,678
73,710
95,968
58
31,404
64,564
24,061
40,503
N.A.
4QFY12E
122,005
51
42,736
164,741
79,564
85,177
40
32,433
52,744
18,586
34,158
N.A.
Var. (%)
-4
23
3
-7
13
-3
22
29
19
Comments
Margin decline 16bp QoQ
Strong fee income growth
Lower NII off-set by fee income and control over opex
Strong asset quality performance; PCR improves 550bp QoQ
Strong fee income growth, control over opex and improvement
in asset quality drives PAT
Source: Company/MOSL
Strong performance on asset quality; net slippages a negative INR3.4b – a
positive surprise
Gross slippages declined significantly to INR43.4b from INR81.6b in 3QFY12, whereas
net slippages were negative at INR3.4b (v/s +INR6.2b in 3QFY12) – a key positive. The
annualized slippage ratio for 4QFY12 stood at 2.3% v/s 4.5% for 3QFY12 and 4% for
9MFY12. Recoveries and upgradations stood at INR47.2b v/s INR19.7b in 3QFY12 and
INR26.7b in 4QFY11. While it was partially driven by restructuring of one large account
(INR7.7b), earlier classified as NPA; strong performance in retail segment was the
major reason for higher recoveries and upgradations during the quarter.
Fresh slippages during the quarter declined QoQ across segments, with sharp fall in
slippages in (1) corporate segment (post three quarters of sequential increase) to
INR24.1b v/s INR39.5b in 3Q, (2) SME segment to INR10.7b v/s INR20.8b in 3Q, (3)
agriculture segment to INR4.6b v/s INR11.2b in 3Q, and (4) international segment to
INR160m v/s INR6b in 3Q. Slippages in the retail segment increased marginally QoQ
to INR4.2b. Of the overall slippages during the quarter, the textile segment constituted
INR8.1b (~18% of incremental slippages), infrastructure INR5.5b and iron and steel
INR4.2b.
GNPAs flat QoQ; PCR (including technical write-offs) improves to 68.1%
In absolute terms, GNPAs stood at INR397b (flat QoQ) whereas NNPAs were at INR158b
(down 16% QoQ). In percentage terms, GNPAs stood at 4.4% (down 17bp QoQ) and
NNPAs were 1.8% (down 40bp QoQ). Despite healthy asset quality, the management
choose not to write-back any excess provisions, leading to PCR (calculated) improving
significantly to 60% v/s 53% in 3QFY12. PCR including technical write-offs stood at
68.1% (v/s 62.5% in 3QFY12).
Restructured INR51.3b (60bp) during the quarter; net of Air India, standard
restructured loans at 3.5% – one of the lowest among PSBs
During the quarter, SBIN restructured fresh loans worth INR51.3b. Of the overall loans
restructured during the quarter, Air India alone accounted for INR12b. Further, one
large account of INR7.4b from the textiles segment and another account worth INR7.7b
(which it had already classified as non-performing) were restructured. Net
restructured loan book stood at INR372b (net of repayment) – 4.3% of overall loans,
21 May 2012
2

State Bank of India
whereas net standard restructured loans stood at INR312b (3.6% of loan book) – one
of lowest amongst peers. The highest contributor to net restructured loans is the
textiles segment (INR74b; 20% of net restructured loans), followed by iron and steel
(INR31b; ~8% of net restructured loans).
Margins declined 16bp QoQ from an elevated level
NII grew 2% QoQ and 45% YoY to INR122b, 4% below estimate. Reported margins
declined 16bp QoQ to 3.9%, led by 11bp fall in domestic margins to 4.3% and 24bp
decline in international margins to 1.5%. Global margins stood at 3.85% in FY12, 3.84%
in 9MFY12 and 3.3% in FY11.
Strong fee income growth – a positive surprise; opex 7% below estimate
Non-interest income for the quarter was INR52.6b (v/s our estimate of INR42.7b). The
sharp deviation in non-interest income was largely on account of strong growth in fee
income (+13% YoY), led by 104% YoY growth in transaction fees (INR7.1b v/s INR3.5b)
and 38% YoY growth in fees from government business. In FY12, fee income grew 4%
v/s flat growth in 9MFY12. After muted fee income performance over past few
quarters, pick-up in fee income in 4QFY12 across segments is a key positive.
Contribution from sale of investments was negligible during the quarter v/s gains of
INR3.3b in 4QFY11. Forex income stood at INR3.3b as against INR2.8b in 3QFY12 and
INR2.5b in 4QFY11. Dividend income was INR4b as against nil in 3QFY12 and INR1.6b in
4QFY11. Opex was 7% below estimate and stood at INR73.7b. During the quarter, the
bank re-classified perquisites relating to travelling expense and leave travel allowance
to employee expense from other expense, leading to 30% QoQ increase in employee
expense and 11% QoQ decline in other opex. SBIN also revised its discounting factor
assumption for pension calculation to 8.75% as against 8.5% earlier, which also would
have led to lower provisioning requirement, in our view.
Loan growth in line with industry average; domestic CD ratio stable QoQ
Gross loans grew 3% QoQ (+16% YoY), while deposits were up 4% QoQ (+12% YoY). In
line with overall loan growth, domestic loans grew 3% QoQ and 14% YoY to INR7.6t.
On domestic operations, CD ratio remained largely stable QoQ at 78.5%. Sequential
growth in domestic loan book was driven by agriculture (+15% QoQ and 23% YoY) and
SME (+~5% QoQ and 16% YoY) segments. The large corporate segment grew 1.5% QoQ
and 15% YoY, whereas retail loans grew 4% and 11% YoY. For FY13, the management
has guided loan growth of 16-18%. However, a challenging macroeconomic
environment and slowdown in fresh capex remain the key risks.
Performance of banking subsidiaries: Asset quality improves QoQ; loan
growth remains healthy
SBI’s subsidiary banks reported earnings growth of 38% QoQ (flat YoY) to INR12.7b
for 4QFY12. Strong non-interest income growth (+40% QoQ; though down 3% YoY)
and flat provisions QoQ led to strong sequential earnings growth. For FY12,
subsidiaries reported a flat PAT of INR36.2b.
NII grew 7% QoQ and 14% YoY to INR32b in 4QFY12, and grew 10% in FY12.
3
21 May 2012

State Bank of India
Loan growth remained above industry average at 9% QoQ and 21% YoY to INR2.9t.
Asset quality improved sequentially, with GNPAs (in absolute terms) declining
3% QoQ and NNPAs declining 7% QoQ. In percentage terms, GNPAs declined 35bp+
QoQ to 2.95% and NNPAs declined 25bp+ QoQ to 1.5%. PCR improved marginally
to 48.3% from 46.2% in 3Q.
Valuation and view
Outlook on NIM:
CASA mix of 47%+, shedding of high cost bulk deposits (now just 11%
of overall deposits) and re-pricing of loans have led to strong margin performance in
FY12. Global NIM improved significantly to 3.85% from 3.3% in FY11, against a declining
trend for its peers. Though there was some pressure on margins in 4QFY12, reduction
in CRR (INR130b liquidity release, benefit of ~10bp on NIM) and equity infusion of
INR79b (benefit of ~7bp on NIM) will keep margins strong in 1HFY13. Nevertheless, a
challenging loan and CASA growth environment, coupled with moral suasion from
GoI will keep yield on loans and cost of funds under pressure. We model 15bp margin
decline in FY13.
Outlook on asset quality:
Higher slippages in 9MFY12 had been a concern for SBIN.
However, sharp fall in gross slippages during the quarter (INR43b v/s INR81b in 3QFY12
and INR225b in 9MFY12) across segments provides comfort. Further, performance on
recoveries and upgradations improved significantly, leading to negative net slippages
and improvement in asset quality. Considering the challenging macroeconomic
environment, net slippages are likely to be higher. We factor in gross slippage ratio of
3% over FY13-14 v/s 3.6% in FY12. Our credit cost estimates are conservative at 1.15%
for FY13 and 1% for FY14 v/s 1.4% (1.15% excluding one-offs) for FY12. Continuous
improvement in asset quality could lead to earnings upgrade.
Restructured standard loan book
(ex Air India) at INR300b (3.5% of loan book) is the
lowest among peers, which also provides comfort on asset quality. Excluding Air India
and SEBs, peer banks’ outstanding net restructured loans remain in the range of 4-5%
of loan book.
Chunk of fees linked to transaction banking:
Fee income has risen in the last two
quarters and continuous traction in fees accompanied by lower base in FY12 will lead
to fee income CAGR of 15% over FY13-14. Based on the improved disclosure on fee
income, ~55% of fees are either linked to transaction banking or are liability customer
related fees, which are unlikely to be impacted due to slowdown in loan growth.
Loan processing fees, which form 23% of fee income, have already de-grown 10% in
FY12, and given the lower base, are unlikely to be a drag on overall fees.
Earnings CAGR of 25%:
One-off provisioning (~INR23.7b) and loss (MTM and realised)
on investments (INR15.8b) led to a drag on earnings in FY12 (20% of FY12 PBT). Lower
base coupled with largely stable margins and improving fee income should lead to
earnings CAGR of 25% over FY12-14.
21 May 2012
4

State Bank of India
Valuations attractive; our top pick:
We estimate standalone (consolidated) RoE at
17.2% (17.6%) for FY13 and 17.9% (18.1%) for FY14. RoA is likely to improve from 0.9%
in FY12 to 1.1%+ (1%) over FY13-14. The stock trades at 1x FY13E consolidated BV of
INR1,819 and 0.9x FY14E consolidated BV of INR2,099. SBIN remains our top pick, with
a target price of INR2,725 (1.25x FY14E consolidated BV + INR102/share for Insurance).
Our target multiples would see further upside, as the macroeconomic environment
and interest rate outlook improves.
We upgrade our earnings est to factor in strong fee income and lower credit cost (INR b)
Old Estimates
FY13
FY14
485
543
167
191
652
733
313
353
339
381
127
115
212
266
76
96
136
170
3.6
3.4
1.2
0.9
0.9
1.0
15.7
17.3
Rev. Estimates
FY13
FY14
474
525
181
206
655
731
295
327
359
405
118
121
242
283
87
99
155
184
3.6
3.4
1.2
1.0
1.1
1.1
17.2
17.9
Change (%)
FY13
FY14
-2.2
-3.2
8.1
8.0
0.4
-0.3
-5.8
-7.4
6.2
6.3
-7.0
5.8
14.1
6.6
14.1
3.6
14.1
8.2
Net Interest Income
Other Income
Total Income
Operating Expenses
Operating Profits
Provisions
PBT
Tax
PAT
Margins (%)
Credit Cost (%)
RoA (%)
RoE (%)
Source: MOSL
State Bank: One year forward P/E
State Bank: One year forward P/BV
21 May 2012
5

State Bank of India
Quarterly trends
Loan growth moderates...
…as does deposit growth
The management has guided 16-18% loan growth for FY13
Shedding of high cost deposits leading to moderation in
deposit growth
Domestic CD ratio remains stable QoQ (%)
CASA ratio declines marginally QoQ (%)
Domestic CD ratio remains at an optimal level
Current deposit growth moderates, leading to moderation
in CASA ratio
Margins decline QoQ (%)
Net investment gains remain negative
Margins declined 16bp QoQ, led by 11bp QoQ fall in domestic
Net investment gains continued to be negative for the
margins and 24bp decline in international margins
fourth consecutive quarter
21 May 2012
6

State Bank of India
Quarterly trends (Contd.)
Fee income growth surprises positively
Cost to core income remains stable QoQ (%)
Fee income grew 13% YoY, led by strong traction in
Controlled opex led to stable cost to income ratio
transaction fees (up 104% YoY)
Slippages decline sharply QoQ
Traction in upgradations and recoveries improves considerably
Steep sequential decline in slippages across segments
Even after excluding one large account, recoveries and
has been comforting
upgradations have gained momentum
GNPAs decline QoQ
Lower slippages, improved PCR led to lower NNPAs
Net negative slippages led to QoQ decline in GNPAs
Provision coverage ratio (including technical write-offs)
improved to 68.1% from 62.5% leading to lower NNPAs
21 May 2012
7

State Bank of India
Quarterly Snapshot
1Q
2Q
FY11
3Q
4Q
1Q
2Q
FY12
3Q
4Q
Variation (%)
QoQ
YoY
2
154
N.M.
60
17
213
25
16
30
-11
32
30
33
51
24
-1
-16
-17
-40
702
558
-46
-218
-6
-15
Cumulative Numbers
FY11
FY12 YoYGr (%)
33
-10
N.M.
5
-2
-10
19
13
20
1
25
26
24
1
42
Profit and Loss (INR m)
Net Interest Income
73,038 81,149 90,498 80,581 96,995 104,817 115,188 117,038
Other Income
36,900 40,052 33,139 48,155 35,342 34,272 20,730 52,640
Trading profits
1,734 1,927 2,202 3,347 1,689
281 -10,904
-263
Fee Income
24,096 29,450 24,774 37,312 26,329 26,003 26,415 42,161
Forex Income
5,025 3,090 4,083 2,446 3,312 4,806 2,855 3,348
Others
6,045 5,586 2,080 5,050 4,012 3,182 2,363 7,394
Total Income
109,938 121,201 123,637 128,735 132,338 139,090 135,918 169,678
Operating Expenses
48,593 57,631 55,992 67,938 59,913 63,749 63,318 73,710
Employee
30,739 36,758 35,117 44,611 37,174 43,444 41,633 54,310
Others
17,854 20,873 20,876 23,327 22,740 20,305 21,685 19,400
Operating Profits
61,345 63,570 67,645 60,797 72,424 75,341 72,600 95,968
Provisions
15,514 26,215 20,515 41,570 41,569 33,855 24,074 31,404
PBT
45,831 37,355 47,130 19,227 30,855 41,486 48,526 64,564
Taxes
16,688 12,342 18,849 19,019 15,020 12,784 15,895 24,061
PAT
29,143 25,014 28,281
209 15,836 28,702 32,630 40,503
Asset Quality (INR b)
GNPA
208
232
234
253
278
339
401
397
NNPA
111
116
117
123
124
161
188
158
GNPA (%)
3.1
3.4
3.2
3.3
3.5
4.2
4.6
4.4
NNPA (%)
1.7
1.7
1.6
1.6
1.6
2.0
2.2
1.8
PCR (Calculated, %)
47
50
50
51
55
53
53
60
PCR (Reported, %)
61
63
64
65
67
64
63
68
Slippages
41
53
32
56
61
83
82
44
Slippage Ratio (%)
3.0
3.7
2.1
3.6
3.7
4.9
4.5
2.3
Prov. for NPA in qtr
17
22
16
33
28
29
30
28
Credit Cost (%)
1.1
1.3
0.9
1.8
1.5
1.5
1.5
1.3
Ratios (%)
Fees to Total Income
21.9
24.3
20.0
29.0
19.9
18.7
19.4
24.8
Cost to Core Income
44.9
48.3
46.1
54.2
45.9
45.9
43.1
43.4
Tax Rate
36.4
33.0
40.0
98.9
48.7
30.8
32.8
37.3
Loan/Deposit
80.1
79.6
82.7
81.0
81.1
81.2
84.5
83.1
Domestic Loan/Deposit 74.9
74.7
77.2
76.3
76.7
75.8
78.6
78.5
CAR
13.5
13.2
13.2
12.0
11.6
11.4
11.6
13.9
Tier I
9.8
9.6
9.6
7.8
7.6
7.5
7.6
9.8
RoA (cal)
1.1
0.9
1.0
0.0
0.5
0.9
1.0
1.2
RoE (Cal)
17.3
14.2
15.4
0.1
9.6
16.7
17.9
20.3
Margins (%)
Yield on Advances
9.3
9.5
9.6
9.6
10.4
10.8
10.9
11.1
Yield On Funds
6.8
6.9
7.0
7.0
7.2
7.3
7.5
7.5
Cost of Deposits
5.3
5.3
5.2
5.3
5.7
5.8
5.9
6.0
Quarterly margins
3.2
3.4
3.6
3.1
3.6
3.8
4.1
3.9
NIM Cumulative
3.2
3.3
3.4
3.3
3.6
3.7
3.8
3.9
For %age change QoQ and YoY is bp
45 325,265 434,039
9 158,246 142,985
N.M. 9,210 -9,197
13 115,632 120,909
37 14,644 14,322
46 18,760 16,952
32 483,511 577,024
8 230,154 260,690
22 147,225 176,560
-17 82,929 84,130
58 253,357 316,334
-24 103,813 130,902
N.M. 149,543 185,431
27 66,897 67,760
N.M. 82,646 117,671
57
28
116
19
888
315
-22
-126
-13
-44
23.9
52.2
44.7
21.0
47.0
36.5
12
-2
5
-16
1
149
49
69
82
53
Source: Company/MOSL
21 May 2012
8

State Bank of India
Quarterly Snapshot
INR b
1Q
2Q
4Q
1Q
2Q
1Q
4Q
Balance Sheet
Capital
6
6
6
6
6
6
6
6
6
6
6
7
6
6
Reserves & Surplus
612
638
659
653
682
716
744
644
659
700
747
833
12
29
Net Worth
618
644
666
659
689
722
750
650
666
706
753
840
11
29
Deposits
7,636 7,729 7,710 8,041 8,153 8,553 8,790 9,339 9,501 9,732 10,010 10,436
4
12
Domestic
7,324 7,384 7,362 7,647 7,624 8,078 8,334 8,872 8,999 9,173 9,414 9,822
4
11
Overseas
311
345
348
394
529
476
456
468
502
559
595
614
3
31
Borrowings
518
575
566 1,030 1,072 1,126 1,161 1,196 1,214 1,158 1,242 1,270
2
6
Other Liabilities & Prov.
998
930 1,057
803
837
643
813 1,052 1,095
829 1,010
809
-20
-23
Total Liabilities
9,770 9,878 9,999 10,534 10,750 11,045 11,514 12,237 12,475 12,425 13,014 13,355
3
9
Assets
Cash/RBI
405
417
447
613
467
671
807
944
916
750
719
541
-25
-43
Short term funds
291
282
269
349
333
348
316
285
340
185
212
431
103
51
Investments
3,202 3,085 2,881 2,858 3,000 2,855 2,700 2,956 3,014 3,015 3,016 3,017
0
2
Loans
5,498 5,721 5,989 6,319 6,532 6,807 7,266 7,567 7,709 7,906 8,463 8,676
3
15
Deposit Break-up
CASA Deposits
2,678 2,953 3,067 3,466 3,624 3,772 3,938 4,305 4,304 4,350 4,474 4,581
2
6
Savings Deposits
2,122 2,312 2,453 2,563 2,840 3,045 3,186 3,234 3,444 3,524 3,679 3,598
-2
11
% to Total Deposits
28
30
32
32
35
36
36
35
36
36
37
34 -227
-15
Current Deposits
637
641
628
903
784
791
752 1,071
860
826
795
983
24
-8
% to Total Deposits
8
8
8
11
10
9
9
11
9
8
8
9
148 -205
CASA (Cal)
36
38
40
43
44
45
45
46
45
45
45
44
-80 -219
CASA Reported
38
41
43
47
48
48
49
49
48
48
48
47
-88 -202
Domestic Loan Break Up
Large Corporate
638
650
825
881
956
931 1,058 1,087 1,141 1,133 1,231 1,250
2
15
Mid Corporate
1,273 1,219 1,120 1,337 1,312 1,449 1,486 1,576 1,596 1,613 1,661 1,676
1
6
SME
967
959 1,029
975
993 1,122 1,094 1,197 1,203 1,260 1,327 1,392
5
16
Agriculture
567
590
612
783
760
695
870
948
955
958 1,019 1,169
15
23
Retail
1,129 1,189 1,265 1,348 1,403 1,430 1,567 1,646 1,651 1,688 1,753 1,824
4
11
Others
22
248
283
120
163
251
219
171
228
200
363
267
-26
57
Domestic Loan Mix
Large Corporate
14
13
16
16
17
16
17
16
17
17
17
16
Mid Corporate
28
25
22
25
23
25
24
24
24
24
23
22
SME
21
20
20
18
18
19
17
18
18
18
18
18
Agriculture
12
12
12
14
14
12
14
14
14
14
14
15
Retail
25
24
25
25
25
24
25
25
24
25
24
24
Others
0
5
6
2
3
4
3
3
3
3
5
4
* There has been reclassification of loan in 4QFY11
Source: Company/MOSL
FY10
3Q
FY11
3Q
4Q
FY12
2Q
3Q
Variation (%)
QoQ
YoY
21 May 2012
9

State Bank of India
Stock Info
EPS: MOSL forecast v/s consensus (Standalone, INR)
MOSL
Forecast
230.6
274.5
Consensus
Forecast
218.4
260.7
Variation
(%)
5.6
5.3
1-year Sensex rebased
FY13
FY14
Shareholding pattern (%)
Promoter
Domestic Inst
Foreign
Others
Mar-12
61.6
17.1
11.4
9.9
Dec-11
59.4
18.7
10.9
11.0
Mar-11
59.4
16.6
15.8
8.3
21 May 2012
10

State Bank of India
Financials and Valuation
21 May 2012
11

State Bank of India
Financials and Valuation
21 May 2012
12

State Bank of India
N O T E S
21 May 2012
13

Disclosures
This report is for personal information of the authorized recipient and does not construe to be any investment, legal or taxation advice to you. This research report does not constitute an offer, invitation or inducement
to invest in securities or other investments and Motilal Oswal Securities Limited (hereinafter referred as MOSt) is not soliciting any action based upon it. This report is not for public distribution and has been
furnished to you solely for your information and should not be reproduced or redistributed to any other person in any form.
Unauthorized disclosure, use, dissemination or copying (either whole or partial) of this information, is prohibited. The person accessing this information specifically agrees to exempt MOSt or any of its affiliates
or employees from, any and all responsibility/liability arising from such misuse and agrees not to hold MOSt or any of its affiliates or employees responsible for any such misuse and further agrees to hold MOSt
or any of its affiliates or employees free and harmless from all losses, costs, damages, expenses that may be suffered by the person accessing this information due to any errors and delays.
The information contained herein is based on publicly available data or other sources believed to be reliable. While we would endeavour to update the information herein on reasonable basis, MOSt and/or its
affiliates are under no obligation to update the information. Also there may be regulatory, compliance, or other reasons that may prevent MOSt and/or its affiliates from doing so. MOSt or any of its affiliates or
employees shall not be in any way responsible and liable for any loss or damage that may arise to any person from any inadvertent error in the information contained in this report . MOSt or any of its affiliates
or employees do not provide, at any time, any express or implied warranty of any kind, regarding any matter pertaining to this report, including without limitation the implied warranties of merchantability, fitness
for a particular purpose, and non-infringement. The recipients of this report should rely on their own investigations.
This report is intended for distribution to institutional investors. Recipients who are not institutional investors should seek advice of their independent financial advisor prior to taking any investment decision
based on this report or for any necessary explanation of its contents.
MOSt and/or its affiliates and/or employees may have interests/positions, financial or otherwise in the securities mentioned in this report. To enhance transparency, MOSt has incorporated a Disclosure of Interest
Statement in this document. This should, however, not be treated as endorsement of the views expressed in the report.
Disclosure of Interest Statement
1. Analyst ownership of the stock
2. Group/Directors ownership of the stock
3. Broking relationship with company covered
4. Investment Banking relationship with company covered
State Bank of India
No
Yes
Yes
No
Analyst Certification
The views expressed in this research report accurately reflect the personal views of the analyst(s) about the subject securities or issues, and no part of the compensation of the research analyst(s) was, is, or
will be directly or indirectly related to the specific recommendations and views expressed by research analyst(s) in this report. The research analysts, strategists, or research associates principally responsible
for preparation of MOSt research receive compensation based upon various factors, including quality of research, investor client feedback, stock picking, competitive factors and firm revenues.
Regional Disclosures (outside India)
This report is not directed or intended for distribution to or use by any person or entity resident in a state, country or any jurisdiction, where such distribution, publication, availability or use would be contrary to
law, regulation or which would subject MOSt & its group companies to registration or licensing requirements within such jurisdictions.
For U.K.
This report is intended for distribution only to persons having professional experience in matters relating to investments as described in Article 19 of the Financial Services and Markets Act 2000 (Financial
Promotion) Order 2005 (referred to as "investment professionals"). This document must not be acted on or relied on by persons who are not investment professionals. Any investment or investment activity to
which this document relates is only available to investment professionals and will be engaged in only with such persons.
For U.S.
MOSt is not a registered broker-dealer in the United States (U.S.) and, therefore, is not subject to U.S. rules. In reliance on the exemption from registration provided by Rule 15a-6 of the U.S. Securities Exchange
Act of 1934, as amended (the "Exchange Act") and interpretations thereof by the U.S. Securities and Exchange Commission ("SEC") in order to conduct business with Institutional Investors based in the U.S.,
Motilal Oswal has entered into a chaperoning agreement with a U.S. registered broker-dealer, Marco Polo Securities Inc. ("Marco Polo").
This report is intended for distribution only to "Major Institutional Investors" as defined by Rule 15a-6(b)(4) of the Exchange Act and interpretations thereof by SEC (henceforth referred to as "major institutional
investors"). This document must not be acted on or relied on by persons who are not major institutional investors. Any investment or investment activity to which this document relates is only available to major
institutional investors and will be engaged in only with major institutional investors.
The Research Analysts contributing to the report may not be registered /qualified as research analyst with FINRA. Such research analyst may not be associated persons of the U.S. registered broker-dealer, Marco
Polo and therefore, may not be subject to NASD rule 2711 and NYSE Rule 472 restrictions on communication with a subject company, public appearances and trading securities held by a research analyst account.
Motilal Oswal Securities Ltd
3rd Floor, Hoechst House, Nariman Point, Mumbai 400 021
Phone: +91 22 3982 5500 E-mail: reports@motilaloswal.com