18 July 2012
1QFY13 Results Update | Sector: Financials
Axis Bank
BSE SENSEX
S&P CNX
17,105
Bloomberg
Equity Shares (m)
52-Week Range (INR)
1,6,12 Rel.Perf.(%)
M.Cap. (INR b)
M.Cap. (USD b)
5,193
AXSB IN
413.2
1,367/785
-2/2/-11
422.7
7.7
CMP: INR1,023
TP: INR1,260
Buy
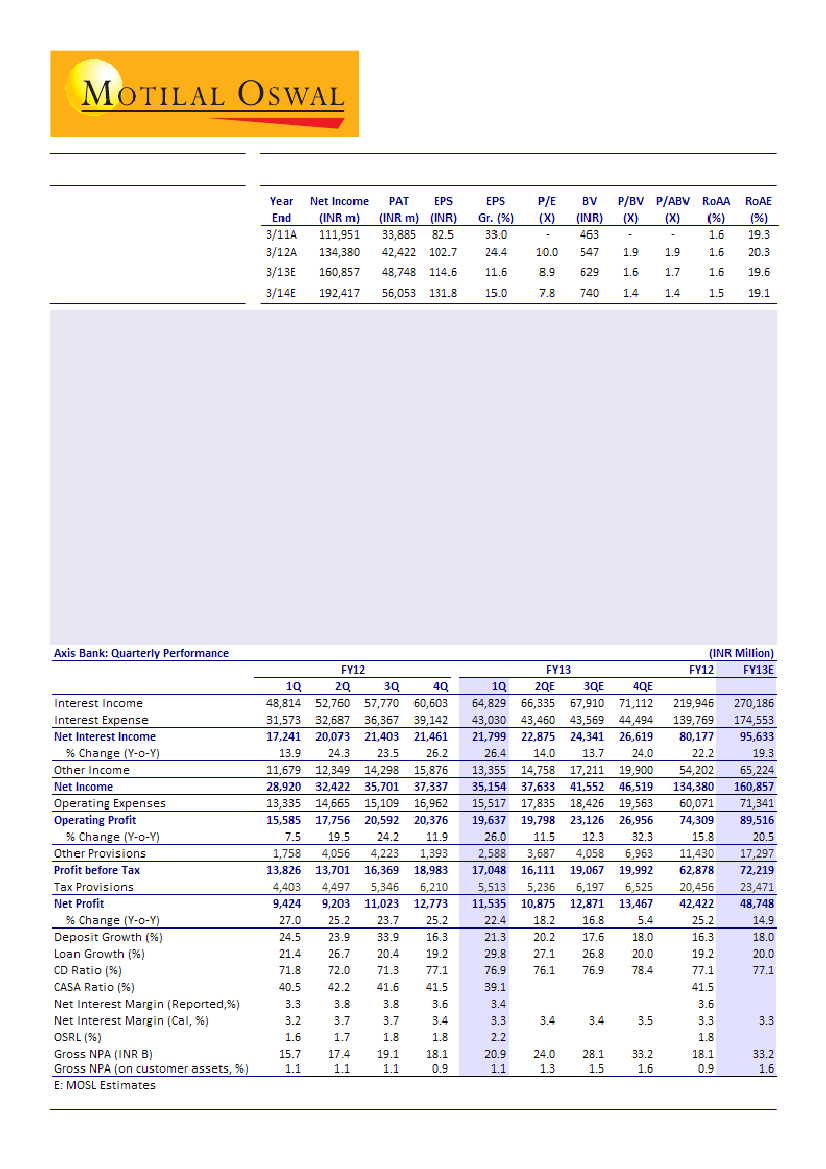
Axis Bank’s 1QFY13 PAT grew 23% YoY to INR11.5b, in line with our estimate of INR11.2b. Lower than estimated
opex growth compensated for the muted fee income growth. Key highlights:
Daily average CASA ratio declined to 36% from 38% in FY12 and 37% in 1QFY12, led by continued moderation
in average current account (CA) deposit growth. Daily average savings account (SA) growth (+22% YoY) remained
healthy, with strong customer acquisitions (+26% YoY).
Fee income growth continued to moderate (less than 10% YoY growth in the last two quarters). Fee income as
a percentage of average assets declined 30bp QoQ, leading to RoA contraction of 24bp QoQ.
Reported loan growth was strong at 30% YoY. However, loan growth was 25% YoY, adjusted for INR depreciation,
and 21% YoY, adjusted for lower base (on account of repayment of short-term loans).
Margin decline of ~18bp QoQ to 3.37%, slippages of INR4.6b, and addition of INR6.3b to restructured loans
were largely on anticipated lines. However, muted recoveries and upgradations were disappointing.
Valuation and view:
Axis Bank’s key strength has been its ability to grow CASA deposits (~35% CAGR over
FY06-12). Given its strong and rapidly growing liability franchise, we expect SA growth to remain healthy (with
strong customer acquisitions). While pressure on asset quality has increased, it still remains under check. Healthy
NII and fee income growth coupled with stable cost to income ratio should lead to 19% and 15% CAGR in core
operating profit and PAT over FY12-14. Maintain
Buy.
Alpesh Mehta
(Alpesh.Mehta@MotilalOswal.com); + 91 22 3982 5415
Sohail Halai
(Sohail.Halai@motilaloswal.com); + 91 22 3982 5430
Investors are advised to refer through disclosures made at the end of the Research Report.

Axis Bank
In line with estimates (INR m)
Y/E MARCH
Net Interest Income
% Change (YoY)
Other Income
Net Income
Operating Expenses
Operating Profit
% Change (YoY)
Other Provisions
Profit before Tax
Tax Provisions
Net Profit
% Change (YoY)
1QFY13A
21,799
26
13,355
35,154
15,517
19,637
26
2,588
17,048
5,513
11,535
22
1QFY13E Var. (%)
21,293
24
14,300
35,593
15,874
19,719
27
3,165
16,554
5,380
11,174
19
2
-7
-1
-2
0
-18
3
2
3
Comments
Margins decline of 18bp QoQ, in line with expectations
Fee income growth remains muted
Inv. Dep. Writeback lowers prov. expenses
Muted fee income growth compensated by lower than expected opex
Source: Company/MOSL
Adjusted loan growth at 21% YoY v/s 30% reported
On a reported basis loan grew 30% YoY (flat QoQ) to INR1.7t. However, adjusted for 1)
currency depreciation, growth stood at 25% and 2) on account of lower base (on
account of repayment of short term loans), it stood at ~21% YoY. Retail loan growth
was strong at 50% YoY and 8% QoQ driven by a robust 50% YoY growth in mortgages. As
a consequence, share of retail loans in overall loans has increased further to 23.7%
v/s 22.1% in 4QFY12 and 20.5% in 1QFY12. Agri. and SME loans declined 8-10% QoQ
and their share declined to 9.2% (10.2% in 4QFY12) and 12.8% (14.8% in 1QFY12).
Corporate loan grew 2% QoQ and 32% YoY to INR929b.
Based on the disclosures, proportion of loans to large and mid corporate segment
with rating of BBB and below has increased from 25% in 1QFY12 to 36% in 1QFY13. This
was partially led by 1) re-payment of high rated corporate loan, 2) some downgrades
in the existing portfolio and 3) strong growth in project finance wherein according to
internal policy of rating they are rated two notches below the model rating.
Healthy SA deposits growth; however CASA ratio declines 200bp QoQ
Deposit grew 21% YoY (largely flat QoQ). Reported CASA declined 5% QoQ (up +17%
YoY) led by 14% sequential decline in CA deposits. On an average daily basis CASA
deposits grew 16% YoY led by strong growth in average daily SA deposits (+22% YoY).
Growth in customer acquisition remains impressive with number of savings account
reporting an increase of 4.3% QoQ and 25.7% YoY. On an average daily basis, CA deposits
grew just 7% YoY (declined 12% QoQ). Resultantly, average daily CASA ratio declined
200bp QoQ to 36%.
Margins down 18bp QoQ led by higher PSL and rising cost of funds
Reported margins declined 18bp QoQ to 3.37% led by higher share of PSL in incremental
loans during the quarter and rising cost of funds. Fall in average daily CASA ratio by
200bp QoQ and strong growth in term deposits (+5% QoQ) led to 25bp increase in cost
of funds.
Fee income growth remains moderate - a disappointment
Fee income growth moderated to just ~9% YoY. This was on the back of sluggish growth
in fees from corporate (flat YoY), which constitutes 35%+ of the overall fees. Growth
in treasury fees remained moderate at 13% YoY. However, fees in agri. and SME grew
18 July 2012
2

Axis Bank
(+37% YoY) remained strong. Business banking and retail segment grew 15%+ YoY.
Trading profits stood at INR1.5b (flat QoQ) as against INR702m in 1QFY12.
Slippages on expected line but recoveries and up-gradation disappoints
In 1QFY13, gross slippages stood at INR4.5b (annualized slippage ratio of 1.4%) as
compared to INR5.1b a quarter ago. However steep fall in recoveries and up-gradations
to INR620m v/s INR5.9b in 4QFY12 and INR920m in 1QFY12 led to addition of higher
stress on the balance sheet. Consequently, GNPA in absolute terms increased 16%
QoQ. In % terms GNPA and NNPA increased 12bp and 6bp QoQ to 1.06% and 0.31%
respectively. Provision coverage declined to 71% as compared to 73.8% a quarter ago.
PCR (including technical write-off) remained strong at 79%.
O/s restructured loan at INR38.2b i.e. 2.2% of outstanding loans
The bank restructured fresh loans of INR6.2b of loans (including large infra account of
INR3.3b) and disbursed INR2.4b to loans already restructured. As a result, cumulative
restructured loans increased to INR38.2b i.e. 2.2% of outstanding loans and 1.95% of
customer assets. Of the overall restructured loans, INR12.3b (32% of the loan
restructured) has track record of two years or more of repayment. Bulk of the
restructured loans are in large and mid-corporate segment (80% of restructured loan),
with SME, agri. and capital market related loans forming around 6-7% each.
Sector-wise, textile forms 14% of the loan restructured, with petroleum, edible oils
and shipping forming 11-12% each. Of the overall restructured portfolio, 9% is
contributed by infrastructure segment.
Other details
Tier I Capital (including 1Q profit) at 9.5%:
Overall CAR of the bank stood at 13.5%,
of which Tier I ratio stood at 9.5%.
Cost to income ratio declines QoQ:
Opex growth moderated to 16% YoY (down
8.5% QoQ) led by 17% sequential decline in other opex. Employee expense grew
14% YoY and 10% QoQ. As a consequence, cost to income ratio stood at 46.5% as
compared to 48.9% a quarter ago and 48% a year ago.
During the quarter, AXSB opened 59 branches and 413 ATMs taking the overall
branch and ATM network to 1,681 and 10,337 respectively.
Key Concall Takeaways
Guidance for FY13
Loan growth is expected to remain above industry average and higher focus to
be on retail segment. Investment demand remains subdued; loan growth in
corporate segment to be driven by working capital requirement and past
sanctioned projects.
Fee income growth is expected to be in-line with balance sheet growth.
Improvement in business environment remains a key for growth in corporate
fees.
Cost to income ratio should remain in the range of 40-45%
Credit cost guidance of 80-85bp for FY13.
18 July 2012
3

Axis Bank
Average daily CASA ratio declines 200bp QoQ to 36%
CASA growth moderated to 17% YoY led by sharp moderation in CA deposit (8%
YoY). This is an industry-wide phenomena.
Growth in SA deposits remains healthy at 20%+ and acquisition of new customers
also remains healthy. Over the past one year, AXSB has increased its market
share in SA deposits by 50bp to 4.79%.
Traction in retail term deposits remains strong (+45% YoY). Management intends
to focus on retail deposits and consequently reduce the proportion of bulk
deposits (37% in 1QFY13) in its balance sheet.
Asset quality performance
Addition to re-structuring asset and GNPA to be in the range of INR10b per quarter
v/s INR10.8b in 1QFY13.
Of the gross restructured loan of INR54.8b, INR8.4b has already been recovered
whereas INR8.2b has slipped into NPA.
Slippages during the quarter were broad-based and there was no evidence of
any concentration.
Recoveries and upgradation were muted during the quarter and is expected to
improve, going forward.
Of the overall provisions of INR2.6b made during the quarter, INR2.6b (credit
cost of 60bp) was on account of NPA provisions, INR540m on loans restructured
whereas it had a write-back of INR670m on investments.
Other highlights
Margin in domestic operations stood at 3.56% whereas in international
operations, it stood at 1.7%. With liquidity easing at the end of 1QFY13, pressure
on cost of funds is expected to ease and provide cushion to margins.
Trading income for the quarter stood at INR1.5b, which includes gain from stake
sale in Max New York Life (amount not quantified).
AXSB expects to add 200-250 branches every year.
Valuation and view
Axis Bank’s key strength has been its ability to grow CASA deposits (~35% CAGR over
FY06-12). Given its strong and rapidly growing liability franchise, we expect SA growth
to remain healthy (with strong customer acquisition). However, a structural
moderation in CA growth industry wide is likely to keep pressure on CASA ratio.
Average daily CASA ratio has already declined from 42% in 3QFY11 to 36% now although
SA share in overall deposits has come off by just 175bp during the same period.
Margin contraction in 1QFY13 was on expected lines and remained in the sustainable
range of 3.25-3.5% as guided by the management. Improving liquidity augurs well for
margins considering higher share of bulk deposits in the balance sheet (~37%). In our
view, margin remains one of the key factors for operating profit growth considering
the slowdown in fee income growth. While pressure on asset quality has risen it still
remains under check. We model higher credit cost of 80bp/90bp for FY13/14E v/s 60bp
in FY12. Healthy NII and fee income growth coupled with stable cost to income ratio
should lead to core operating profit and PAT CAGR of 19% and 15% over FY12-14.
18 July 2012
4

Axis Bank
We expect FY13/14 BV of INR629/740 and EPS of INR115/132. The stock currently trades
at 1.6x FY13E BV, 1.4x FY14 BV and 8.9x / 7.8x FY13E / FY14 EPS. We expect RoA to
remain in excess of 1.5% and RoE of 19%+ over FY13/14. Maintain
Buy
with a target
price of INR1,260 (1.7x FY14E BV).
Risk factors are (a) worse than expected stress loans build up (b) keeping tight leash
on opex considering growing retail business and (c) stronger than anticipated loan
growth with a fall in RoA leading to faster consumption of capital and fall in Tier I ratio
to less than 9%.
Key re-rating triggers (a) Resolution of key issues in infrastructure, materially altering
asset quality and growth, and (b) Improvement in liquidity leading to lower bulk
deposit rates (35%+ of deposits) and (c) improvement in fee income growth.
We largely maintain our earnings estimates (INR b)
Old
FY13
Net Interest Income
Other Income
Total Income
Operating Expenses
Operating Profits
Provisions
PBT
Tax
PAT
Margins (%)
Credit Cost (%)
RoA (%)
RoE (%)
92.6
66.8
159.4
71.4
88.0
15.4
72.5
23.6
49.0
3.2
0.7
1.6
19.7
FY14
109.1
82.3
191.5
85.0
106.5
22.1
84.3
27.4
56.9
3.1
0.9
1.5
19.4
Revised
FY13
FY14
95.6
65.2
160.9
71.3
89.5
17.3
72.2
23.5
48.7
3.3
0.8
1.6
19.6
113.5
78.9
192.4
85.2
107.2
24.1
83.0
27.0
56.1
3.3
0.9
1.5
19.1
Change (%)
FY13
FY14
3.3
-2.3
0.9
-0.1
1.8
12.1
-0.4
-0.4
-0.4
4.0
-4.2
0.5
0.3
0.7
9.0
-1.5
-1.5
-1.5
Source: MOSL
Axis Bank: One year forward P/E
Axis Bank: One year forward P/BV
18 July 2012
5

Axis Bank
Quaterly trends
Adjusted loan growth at 21% v/s 30% reported
Deposit growth improve led by strong growth in retail deposits
Adjusted for currency depreciation loan growth stood at
25% while adjusted for lower base, it stood at 21% YoY
Strong growth in SA deposits (+23% YoY), and retail term
deposits (+45% YoY) were the key drivers
Proportion of loans to BBB and below rated corporate increase
(%)
Average daily CASA ratio declines QoQ (%)
The rise was partially led by strong growth in project
finance wherein according to internal policy of rating
they are rated two notches below the model rating
While average SA deposit growth (+22% YoY) remained
healthy, average CA deposits grew just 7% YoY
Margins decline 18bp QoQ - in line with estimates (%)
CoF increase 25bp QoQ to 6.7% (%)
Higher share of low yielding loans PSL, and rise in cost
of funds led to decline in margins
Fall in CASA ratio (down 200bp QoQ), and tight liquidity
condition led to increase in CoF
18 July 2012
6

Axis Bank
Quarterly trends (coninued)
Muted fee income growth - a disappointment (%)
Corporate banking fees continues to be under pressure (%)
Pressure on corporate fees which forms 35%+ of overall
fees led to moderation in fees
While corporate fees growth was flat YoY, other fee
income stream grew 15%+
Moderation in opex off-sets muted fee income growth (%)
Branch expansion continues (Nos.)
Opex grew 16% YoY but declined 9% QoQ as a consequence
cost to core income ratio declined. Management guided
for cost to income ratio of sub 45%
Management expects to add 250-200 branches every year
Restructured loan as % to overall loan stood at 2.2% (INR b)
Gross Slippages ratio largely stable 1.4%
In 1QFY13, the bank restructured fresh loans of INR6.2b
and disbursed INR2.4b to loans already restructured
While slippages were largely on anticipated lines, lower
recoveries and up-gradation of INR620m - disappointed
18 July 2012
7

Axis Bank
Quarterly Snapshot
FY11
1Q
Profit and Loss (INR m)
Net Interest Income
15,138
Other Income
10,008
Trading profits
1,957
Fee Income
7,530
Miscellaneous Income
520
Total Income
25,146
Operating Expenses
10,645
Employee
4,164
Others
6,481
Operating Profits
14,501
Provisions
3,330
PBT
11,171
Taxes
3,752
PAT
7,419
Asset Quality
GNPA
13,409
NNPA
4,134
GNPA (%)
1.1
NNPA (%)
0.4
PCR (Calculated, %)
69
PCR (Reported, %)
77
Slippages
4,210
Slippage Ratio
2.2
Prov. for NPA in qtr
3,020
Credit Cost
1.1
Restructured loans
21,510
% of Loans
2.0
Ratios (%)
Fees to Total Income
29.9
Cost to Core Income
47.0
CASA (Cal.)
40.2
Loan/Deposit
73.6
CAR
15.0
Tier I
10.8
Fee income distribution
Large and Mid Corp
2,280
Treasury & DCM
1,690
Agri and SME
370
Business Banking
940
Capital Markets
200
Retail Banking
2,050
Margins - Cal (%)
Yield on loans
8.7
Yield On Investments
6.6
Yield on Funds
7.9
Cost of funds
4.5
Margins
3.6
Margins - Reported (%)
Cost of Funds
4.6
Margins
3.7
For %age change QoQ and YoY is bp
18 July 2012
2Q
16,151
10,332
1,080
8,490
762
26,483
11,620
4,053
7,567
14,864
3,788
11,076
3,725
7,351
13,624
4,094
1.1
0.3
70
80
4,460
2.2
3,210
1.2
20,610
1.9
32.1
47.2
41.5
70.5
14.6
10.7
2,980
1,850
480
920
160
2,100
8.9
7.5
8.3
4.7
3.7
4.8
3.7
3Q
17,331
11,477
1,350
9,670
457
28,808
12,224
3,962
8,262
16,585
3,139
13,446
4,532
8,914
14,829
3,855
1.1
0.3
74
83
3,340
1.6
2,330
0.8
21,170
1.7
33.6
45.3
42.3
79.3
13.8
10.2
3,520
1,860
580
950
150
2,610
8.9
7.7
8.3
4.7
3.8
4.8
3.8
4Q
17,010
14,504
581
12,310
1,613
31,514
13,306
3,960
9,346
18,208
2,544
15,664
5,463
10,201
15,994
4,104
1.0
0.3
74
81
2,480
1.0
970
0.3
19,300
1.4
39.1
45.4
41.1
75.3
12.7
9.4
4,380
2,550
1,000
1,070
190
3,120
9.2
7.4
8.5
5.4
3.3
5.6
3.4
1Q
17,241
11,679
702
10,560
416
28,920
13,335
5,100
8,235
15,585
1,758
13,826
4,403
9,424
15,731
4,625
1.1
0.3
71
80
2,960
1.1
1,530
0.4
21,510
1.6
36.5
48.0
40.5
71.8
13.0
9.8
4,130
2,100
460
950
160
2,760
10.1
7.2
9.0
6.0
3.2
6.1
3.3
FY12
2Q
20,073
12,349
280
11,200
869
32,422
14,665
4,986
9,679
17,756
4,056
13,701
4,497
9,203
17,438
5,488
1.1
0.3
69
78
4,960
1.8
2,470
0.7
24,100
1.7
34.5
46.9
42.2
72.0
12.2
9.3
3,790
2,740
640
970
150
2,910
10.8
7.7
9.6
6.1
3.7
6.2
3.8
3Q
4Q
21,461
15,876
1,460
13,260
1,156
37,337
16,962
5,296
11,666
20,376
1,393
18,983
6,210
12,773
18,063
4,726
0.9
0.3
74
81
5,140
1.4
1,270
0.3
30,600
1.8
35.5
48.9
41.5
77.1
13.7
9.5
4,420
2,490
1,170
1,280
130
3,770
10.7
7.6
9.5
6.3
3.4
6.5
3.6
FY13
1Q
21,799
13,355
1,500
11,540
315
35,154
15,517
5,826
9,691
19,637
2,588
17,048
5,513
11,535
20,917
6,049
1.1
0.3
71
79
4,560
1.4
2,610
0.6
38,270
2.2
32.8
46.5
39.1
76.9
13.5
9.5
4,090
2,380
630
1,100
120
3,220
10.9
8.0
9.8
6.7
3.3
-7
-4
-46
-14
-8
-15
16
40
24
39
-9
-1
13
37
16
-25
17
73
74
77
74
11
Variation (%)
QoQ
YoY
2
-16
3
-13
-73
-6
-9
10
-17
-4
86
-10
-11
-10
16
28
12
6
-275
-191
-11
-6
106
29
25
43
26
14
114
9
-24
22
16
14
18
26
47
23
25
22
33
31
0
0
48
-100
54
29
71
17
78
61
21,403
14,298
1,180
12,210
908
35,701
15,109
5,420
9,689
20,592
4,223
16,369
5,346
11,023
19,145
6,829
1.1
0.4
64
75
5,350
1.7
3,340
0.9
27,010
1.8
34.2
45.0
41.6
71.3
13.1
9.6
4,730
2,320
660
1,090
130
3,280
11.0
8.1
9.9
6.3
3.7
6.3
3.8
6.7
25
57
3.4
-18
9
Source: Company/MOSL
8

Axis Bank
Quarterly Snapshot
(INR b)
1Q
Balance Sheet
Loans
1,086
Investments
575
Customer Assets
1,181
Deposits
1,475
Borrowings
196
Total Assets
1,895
Deposits Break Up
Retail Deposits
638
% to total Deposits
43
Other Deposits
837
% to total Deposits
57
Deposits Break Up
CASA Deposits
592
% of total Deposits
40
Savings
347
% of total Deposits
24
Current
245
% of total Deposits
17
Term Deposits
882
% of total Deposits
60
Loan Break Up
Agriculture
106
SME Loans
168
Retail Loans
211
of which
Auto
27
Housing
150
Personal Loans
21
Other retail loans
13
Other loans
601
Loan Mix
Agriculture
10
SME Loans
15
Retails
19
Others
55
Ratings Profile
Large and Mid Corp
AAA
9
AA
19
A
46
BBB
23
<BBB and below
3
SME
SME1
2
SME2
15
SME3
60
SME4
13
SME 5-8
9
For %age change QoQ and YoY is bp
2Q
1,106
619
1,204
1,569
190
1,998
679
43
890
57
652
42
378
24
274
17
917
58
91
168
210
27
153
21
8
637
8
15
19
58
FY11
3Q
1,235
596
1,329
1,558
256
2,067
615
39
944
61
659
42
391
25
268
17
899
58
108
171
252
28
169
45
10
705
9
14
20
57
4Q
1,424
720
1,578
1,892
263
2,427
743
39
1,149
61
778
41
409
22
369
20
1,115
59
173
214
278
31
189
44
14
759
12
15
19
53
1Q
1,319
753
1,492
1,836
223
2,331
797
43
1,039
57
744
41
429
23
315
17
1,092
59
147
198
270
35
203
16
16
703
11
15
20
53
FY12
2Q
1,401
850
1,614
1,945
268
2,506
875
45
1,070
55
821
42
468
24
354
18
1,123
58
106
208
293
38
223
18
15
794
8
15
21
57
3Q
4Q
1,698
932
1,891
2,201
341
2,856
995
45
1,206
55
914
42
517
23
398
18
1,287
58
173
238
376
49
282
30
15
911
10
14
22
54
FY13
1Q
1,711
880
1,951
2,226
341
2,894
1,062
48
1,164
52
869
39
528
24
342
15
1,357
61
157
220
406
53
304
32
16
929
9
13
24
54
Variation (%)
QoQ
YoY
1
-6
3
1
0
1
7
-3
30
17
31
21
53
24
33
12
1,487
903
1,751
2,087
308
2,693
919
44
1,168
56
868
42
473
23
395
19
1,219
58
107
207
333
43
249
20
20
841
7
14
22
57
-5
2
-14
5
17
23
8
24
-10
-8
8
8
8
8
8
2
7
11
50
50
50
100
0
32
8
22
44
23
3
2
17
60
12
9
8
24
41
25
2
2
17
59
12
10
7
25
43
23
2
5
18
59
11
7
8
26
41
23
2
5
20
55
12
8
7
24
42
24
3
5
18
56
13
8
6
23
41
27
3
6
18
55
12
9
8
19
40
30
3
5
18
57
12
8
6
18
40
33
3
5
18
57
12
8
Source: Company/MOSL
18 July 2012
9

Axis Bank
Stock Info
EPS: MOSL forecast v/s consensus (INR)
MOSL
Forecast
114.6
131.8
Consensus
Forecast
117.3
137.8
Variation
(%)
-2.3
-4.3
1-year Sensex rebased
FY13
FY14
Shareholding pattern (%)
Jun-12
Promoter
Domestic Inst
Foreign
Others
37.3
13.9
36.1
12.8
Mar-12
37.4
13.4
41.7
7.5
Jun-11
37.2
5.7
45.6
11.5
18 July 2012
10

Axis Bank
Financials and Valuations
18 July 2012
11

Axis Bank
Financials and Valuations
18 July 2012
12

Axis Bank
N O T E S
18 July 2012
13

Disclosures
This report is for personal information of the authorized recipient and does not construe to be any investment, legal or taxation advice to you. This research report does not constitute an offer, invitation or inducement
to invest in securities or other investments and Motilal Oswal Securities Limited (hereinafter referred as MOSt) is not soliciting any action based upon it. This report is not for public distribution and has been
furnished to you solely for your information and should not be reproduced or redistributed to any other person in any form.
Unauthorized disclosure, use, dissemination or copying (either whole or partial) of this information, is prohibited. The person accessing this information specifically agrees to exempt MOSt or any of its affiliates
or employees from, any and all responsibility/liability arising from such misuse and agrees not to hold MOSt or any of its affiliates or employees responsible for any such misuse and further agrees to hold MOSt
or any of its affiliates or employees free and harmless from all losses, costs, damages, expenses that may be suffered by the person accessing this information due to any errors and delays.
The information contained herein is based on publicly available data or other sources believed to be reliable. While we would endeavour to update the information herein on reasonable basis, MOSt and/or its
affiliates are under no obligation to update the information. Also there may be regulatory, compliance, or other reasons that may prevent MOSt and/or its affiliates from doing so. MOSt or any of its affiliates or
employees shall not be in any way responsible and liable for any loss or damage that may arise to any person from any inadvertent error in the information contained in this report . MOSt or any of its affiliates
or employees do not provide, at any time, any express or implied warranty of any kind, regarding any matter pertaining to this report, including without limitation the implied warranties of merchantability, fitness
for a particular purpose, and non-infringement. The recipients of this report should rely on their own investigations.
This report is intended for distribution to institutional investors. Recipients who are not institutional investors should seek advice of their independent financial advisor prior to taking any investment decision
based on this report or for any necessary explanation of its contents.
MOSt and/or its affiliates and/or employees may have interests/positions, financial or otherwise in the securities mentioned in this report. To enhance transparency, MOSt has incorporated a Disclosure of Interest
Statement in this document. This should, however, not be treated as endorsement of the views expressed in the report.
Disclosure of Interest Statement
1. Analyst ownership of the stock
2. Group/Directors ownership of the stock
3. Broking relationship with company covered
4. Investment Banking relationship with company covered
Axis Bank
No
No
No
No
Analyst Certification
The views expressed in this research report accurately reflect the personal views of the analyst(s) about the subject securities or issues, and no part of the compensation of the research analyst(s) was, is, or
will be directly or indirectly related to the specific recommendations and views expressed by research analyst(s) in this report. The research analysts, strategists, or research associates principally responsible
for preparation of MOSt research receive compensation based upon various factors, including quality of research, investor client feedback, stock picking, competitive factors and firm revenues.
Regional Disclosures (outside India)
This report is not directed or intended for distribution to or use by any person or entity resident in a state, country or any jurisdiction, where such distribution, publication, availability or use would be contrary to
law, regulation or which would subject MOSt & its group companies to registration or licensing requirements within such jurisdictions.
For U.K.
This report is intended for distribution only to persons having professional experience in matters relating to investments as described in Article 19 of the Financial Services and Markets Act 2000 (Financial
Promotion) Order 2005 (referred to as "investment professionals"). This document must not be acted on or relied on by persons who are not investment professionals. Any investment or investment activity to
which this document relates is only available to investment professionals and will be engaged in only with such persons.
For U.S.
MOSt is not a registered broker-dealer in the United States (U.S.) and, therefore, is not subject to U.S. rules. In reliance on the exemption from registration provided by Rule 15a-6 of the U.S. Securities Exchange
Act of 1934, as amended (the "Exchange Act") and interpretations thereof by the U.S. Securities and Exchange Commission ("SEC") in order to conduct business with Institutional Investors based in the U.S.,
Motilal Oswal has entered into a chaperoning agreement with a U.S. registered broker-dealer, Marco Polo Securities Inc. ("Marco Polo"). Any business interaction pursuant to this report will have to be executed
within the provisions of this Chaperoning agreement.
This report is intended for distribution only to "Major Institutional Investors" as defined by Rule 15a-6(b)(4) of the Exchange Act and interpretations thereof by SEC (henceforth referred to as "major institutional
investors"). This document must not be acted on or relied on by persons who are not major institutional investors. Any investment or investment activity to which this document relates is only available to major
institutional investors and will be engaged in only with major institutional investors.
The Research Analysts contributing to the report may not be registered /qualified as research analyst with FINRA. Such research analyst may not be associated persons of the U.S. registered broker-dealer, Marco
Polo and therefore, may not be subject to NASD rule 2711 and NYSE Rule 472 restrictions on communication with a subject company, public appearances and trading securities held by a research analyst account.
Motilal Oswal Securities Ltd
Motilal Oswal Tower, Level 9, Sayani Road, Prabhadevi, Mumbai 400 025
Phone: +91 22 3982 5500 E-mail: reports@motilaloswal.com