24 July 2012
1QFY13 Results Update | Sector: Consumer
Dabur India
BSE SENSEX
S&P CNX
16,877
Bloomberg
Equity Shares (m)
52-Week Range (Rs)
1,6,12 Rel. Perf. (%)
M.Cap. (INR b)
M.Cap. (USD b)
5,118
DABUR IN
1,740.7
120/92
6/23/16
205.8
3.7
CMP: INR118
TP: INR113
Neutral
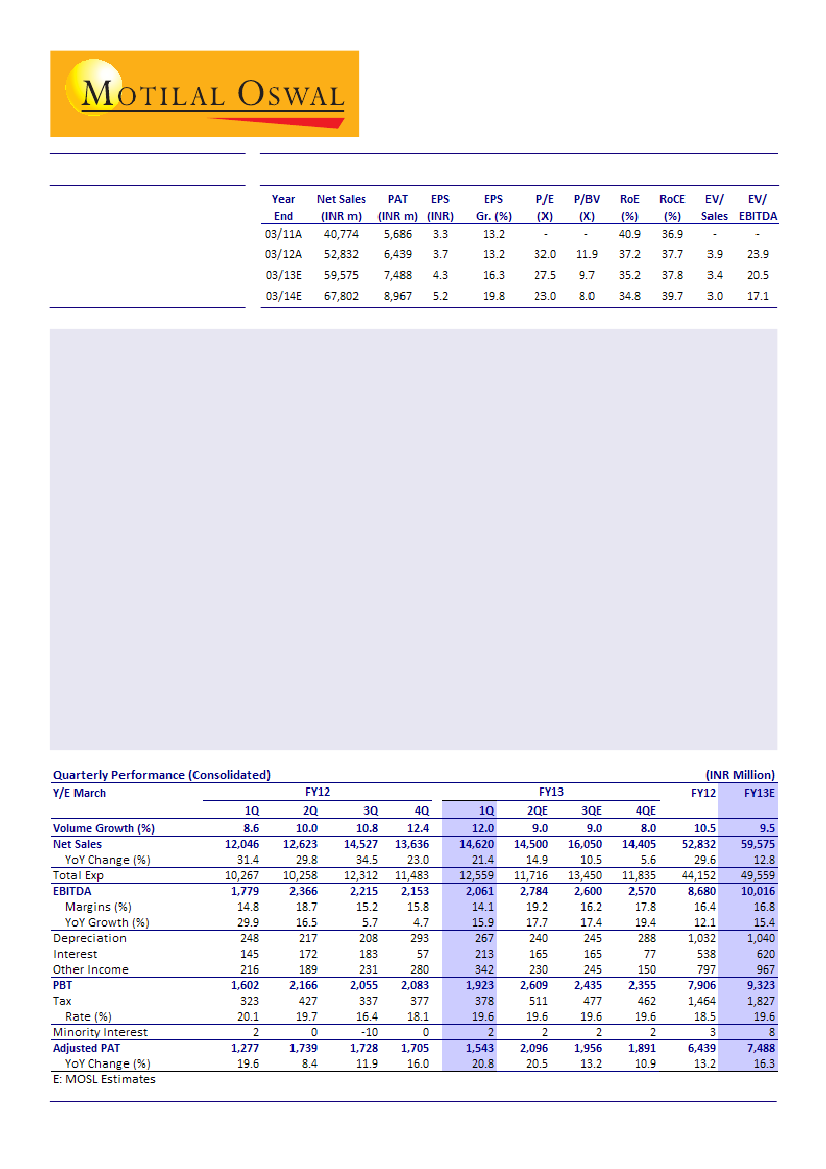
Dabur India has posted in-line results for 1QFY13, with adjusted PAT at INR1.54b against our estimate of
INR1.52b.
Sales growth at 21.4% was higher than we had expected; volumes grew 12%. Gross margin expanded 217bp to
50% on the back of easing input costs and price hikes. EBITDA margin declined 70bp to 14.1% owing to higher
advertising expenses (up 300bp). EBITDA grew 16% to INR2.1b against our estimate of INR2b. Interest cost
increased 47% due to MTM loss on INR1.5b forex debt. A 58% increase in other income and lower tax rate
(down 50bp) led to 21% PAT growth to INR1.54b.
Domestic sales grew 20% to INR10.1b; gross margin expanded 150bp to 45.6%; EBITDA margin remained flat
at 14.3% due to 200bp increase in ad spend. EBITDA grew 18.6%; 46% growth in other income enabled 30.5%
growth in adjusted PAT to INR1.2b.
All key geographies performed well, resulting in healthy 24% growth in International Business Division (IBD).
Dabur has integrated Namaste and Hobi into Dabur International.
The management has indicated high single-digit volume growth for FY13. It expects competitive intensity to
sustain in major businesses, including shampoos and skin care.
We expect Dabur to continue with aggressive pricing and higher ad spends, which will continue to impact
profit margins. We estimate PAT CAGR of 18% over FY12-14. The stock trades at 27.5x FY13E and 23x FY14E EPS.
Maintain
Neutral.
Sreekanth P.V.S.
(Sreekanth.P@MotilalOswal.com); +9122 3029 5120
Investors are advised to refer through disclosures made at the end of the Research Report.
1

Dabur India
Consol volumes up 12%, standalone 11.6%; ad spends increase; noticeable
gross margin expansion
Domestic
sales growth was 20% at INR 10.1b with volumes up 11.6%. Gross margin
expanded 150bp to 45.6%; EBITDA margin remained flat at 14.3% due to 200bp
increase in ad spend. EBITDA grew 18.6%; 46% growth in other income enabled
Adj PAT growth of 30.5% at INR1.2b.
Consolidated
Net sales grew 21.4% with volumes up 12%. Gross margin expanded
217bp to 50% on the back of easing input costs and price hikes.
EBITDA margin declined 70bp to 14.1%
owing to higher ad expenses (up 300bp).
EBITDA grew 16% to INR2.1b (est INR2b).
Interest cost rose 47%
due to MTM loss on INR1.5b forex debt. A 58% increase in
Other income and lower tax rate (down 50bp) boosted 21% PAT growth to INR
1.54b (est INR1.52b).
Sales up 21.4% driven by 24% growth in international business… …. Healthy volume growth at 12%
EBITDA margins decline 70bp YoY
Healthy PAT growth driven by other income
Source: Company, MOSL
Domestic business: Hair oils up 8.4%, shampoos 23%, home care 14.4%,
foods 34.5%
Hair oils posted 8.4% growth
led by double digit growth in Amla hair oil, while
Vatika reported a modest growth.
Shampoos posted 23% growth;
Henna (green variant) was the best performer in
this category with27.3% growth.
24 July 2012
2

Dabur India
Toothpastes grew double digits
with Meswak and Dabur Red performing well,
While Babool sales was impacted due to price hikes.
Skin care growth was at 13.3%,
with Fem growing at 13.4% and registering market
share gains.
Home care posted 14.4% growth
led by Odomos; while Odonil sales remained
under pressure due to low CSD sales.
Foods segment grew 34.5%;
Real and Activ did well, up 37.6%. Grape Juice, Real
Plum and Burrst Aam Panna were the new flavors during the quarter.
OTC and ethicals grew 12.7%,
while Digestive grew 9.8%, health supplements
grew 18% during 1QFY13.
Dabur has been aggressively investing in its brands and we expect it will continue
to do so in order to gain market share. We believe aggressive ad spends will keep
profit margins under check.
Dabur is expanding its rural distribution meaningfully
which should enable it grow
ahead of the market and increase share, even if the rural market growth slows
down.
Management expects competitive intensity to sustain
in major businesses
including shampoos and skin care. It also indicated that bad monsoon could lower
the pace of growth due to weak consumer sentiment and higher input costs.
Margin contraction in Consumer care and Foods consolidated)
Y/E March
Net Sales (INR m)
Consumer Care
Foods
Retail
Others
EBIT (INR m)
Consumer Care
Foods
Retail
Others
EBIT Margin (%)
Consumer Care
Foods
Retail
Others
1QFY13
15,389
11,748
2,115
133
624
2,936
2,397
334
-24
44
19.1
20.4
15.8
(18.1)
7.0
1QFY12
12,815
10,163
1,557
84
242
2,536
2,126
250
(26)
2
19.8
20.9
16.0
(31.3)
0.9
% Chg
20.1
15.6
35.9
58.2
157.8
15.8
12.8
33.8
-8.7
1,886.4
-0.7
-0.5
-0.2
13.3
6.1
FY12
52,832
44,896
6,022
424
1,490
10,822
9,755
1,111
(116)
73
21.7
18.4
(27.4)
4.9
FY11
43,926
34,813
4,933
205
823
9,861
8,975
941
(91)
36
% Chg
20.3
29.0
22.1
106.7
81.0
9.8
8.7
18.0
27.2
101.4
-4.1
-0.6
17.1
0.5
MOSL
25.8
19.1
(44.6)
4.4
Source: Company,
IBD and Food record impressive growth
Category Growth (%)
Hair Care
Health Supplements
Oral Care
Foods
Digestives
Skin care
Home Care
IBD (organic)
1QFY11 2QFY11 3QFY11 4QFY11 1QFY12 2QFY12 3QFY12 4QFY12 1QFY13
8.9
2.7
3.8
11.1
9.0
15.9
19.6
19.8
10.4
43.0
29.4
12.7
20.7
0.0
7.8
13.5
10.9
18.0
20.2
10.4
9.4
8.9
12.7
6.0
11.6
7.7
8.1
21.2
21.4
42.0
30.1
31.5
27.5
17.4
30.4
34.5
14.7
14.1
11.3
-3.8
7.8
3.8
19.3
19.4
9.8
12.4
9.6
18.0
26.3
16.3
0.0
4.9
17.6
13.3
31.5
43.3
24.2
31.1
24.9
0.5
18.0
18.0
14.4
28.7
17.9
14.2
9.9
12.5
22.8
37.8
45.8
24.0
Source: Company, MOSL
24 July 2012
3

Dabur India
International business: Healthy performance across all geographies
International business organic sales grew 24%;
growth was largely led by GCC
(22% in constant currency), Egypt (18%) and Nigeria (21%).
Dabur has integrated Namaste and Hobi into Dabur international.
Dabur plans to manufacture products locally in Africa in order to increase supply
chain efficiencies.
New products
such as hair serums and professional hair care products under the
Vatika brand were launched.
Valuation and view: Sustained competitive intensity to keep margins under
check; Neutral
We note that Dabur has been aggressive in distribution expansion and investing
in it key brands. We believe this will keep profitability under check.
Also it is facing aggression on the pricing and promotion fronts from Colgate
(toothpaste), HUL & P&G (shampoo), Marico (hair oils) and several players in skin
care. To maintain/increase market share, we expect Dabur to continue with
aggressive pricing and higher ad spends which will impact profit margins.
We estimate PAT CAGR of 18% for FY12-14. The stock trades at 27.5x FY13E and 23x
FY14E EPS. Maintain
Neutral.
24 July 2012
4

Dabur India
Dabur India: an investment profile
Company description
Dabur India is the second largest FMCG company in India,
in terms of Product portfolio. Dabur is a market leader
in
Chyawanprash
category and is increasing its presence
in other traditional categories like Hair Care, oral care,
household care and foods. Dabur's acquisition of Fem
Care given it a strategic presence in the high potential
skin care segment.
squeeze in sales growth and margins) and 4) Skin
care (rising focus of MNCs on the mass to mid
premium segment).
Recent developments
Dabur plans to manufacture products locally in Africa
in order to increase supply chain efficiencies.
New products
such as hair serums and professional
hair care products under the Vatika brand were
launched.
Key investment arguments
Strong herbal positioning with little competition
from MNC in categories like Hair Oil, CHD, Health
Supplements etc.
Dabur has the second broadest product portfolio
(after HUL) with presence in high potential
categories like skin care, hair care, oral care and
Health supplements.
The company is likely to be under MAT for the next
7-8 years, resulting in huge tax savings.
Valuation and view
Our EPS estimate stands at INR4.3 for FY13E and
INR5.2 for FY14E, implying a PAT CAGR of 18% over
FY12-14E.
The stock trades at 27.5x FY13E and 23x FY14E EPS.
Maintain
Neutral.
Sector view
We have a cautious view on the sector on back of
inflationary tendency, volatile input cost
environment and a possible slowdown in the rural
economy.
Companies with low competitive pressures and
broad product portfolios will be able to better with
stand any slowdown in a particular segment.
Longer term prospects bright, given rising incomes
and low penetration.
EPS: MOSL forecast v/s consensus (INR)
MOSL
Consensus
Forecast
Forecast
FY13
4.3
4.4
FY14
5.2
5.2
Key investment risks
Higher than anticipated ad spends could impact
profitability adversely.
We believe that will face rising competitive intensity
in some of the key business segments; 1) Toothpaste
(likely entry of P&G) 2) Hair Oils (aggressive strategy
of Marico and Emami) 3) Shampoo (aggressive
strategy of P&G, HUL, Garnier etc resulting in
Comparative valuations
Dabur
P/E (x)
P/BV (x)
EV/Sales (x)
EV/EBITDA (x)
FY13E
FY14E
FY13E
FY14E
FY13E
FY14E
FY13E
FY14E
27.5
23.0
9.7
8.0
3.4
3.0
20.5
17.1
Marico
28.0
22.3
5.9
4.8
2.6
2.1
18.9
15.0
GCPL
26.7
21.9
6.2
5.4
3.5
2.8
19.4
15.8
Variation
(%)
-1.9
0.2
Target Price and Recommendation
Current
Price (INR)
118
Target
Price (INR)
113
Upside
(%)
-4.2
Reco.
Neutral
Stock performance (1 year)
Shareholding pattern (%)
Promoter
Domestic Inst
Foreign
Others
24 July 2012
Jun-12
68.7
6.7
18.0
6.6
Mar-12
68.7
6.5
18.8
6.1
Jun-11
68.7
5.8
19.2
6.2
5

Dabur India
Financials and Valuation
24 July 2012
6

Dabur India
N O T E S
24 July 2012
7

Disclosures
This report is for personal information of the authorized recipient and does not construe to be any investment, legal or taxation advice to you. This research report does not constitute an offer, invitation or inducement
to invest in securities or other investments and Motilal Oswal Securities Limited (hereinafter referred as MOSt) is not soliciting any action based upon it. This report is not for public distribution and has been
furnished to you solely for your information and should not be reproduced or redistributed to any other person in any form.
Unauthorized disclosure, use, dissemination or copying (either whole or partial) of this information, is prohibited. The person accessing this information specifically agrees to exempt MOSt or any of its affiliates
or employees from, any and all responsibility/liability arising from such misuse and agrees not to hold MOSt or any of its affiliates or employees responsible for any such misuse and further agrees to hold MOSt
or any of its affiliates or employees free and harmless from all losses, costs, damages, expenses that may be suffered by the person accessing this information due to any errors and delays.
The information contained herein is based on publicly available data or other sources believed to be reliable. While we would endeavour to update the information herein on reasonable basis, MOSt and/or its
affiliates are under no obligation to update the information. Also there may be regulatory, compliance, or other reasons that may prevent MOSt and/or its affiliates from doing so. MOSt or any of its affiliates or
employees shall not be in any way responsible and liable for any loss or damage that may arise to any person from any inadvertent error in the information contained in this report . MOSt or any of its affiliates
or employees do not provide, at any time, any express or implied warranty of any kind, regarding any matter pertaining to this report, including without limitation the implied warranties of merchantability, fitness
for a particular purpose, and non-infringement. The recipients of this report should rely on their own investigations.
This report is intended for distribution to institutional investors. Recipients who are not institutional investors should seek advice of their independent financial advisor prior to taking any investment decision
based on this report or for any necessary explanation of its contents.
MOSt and/or its affiliates and/or employees may have interests/positions, financial or otherwise in the securities mentioned in this report. To enhance transparency, MOSt has incorporated a Disclosure of Interest
Statement in this document. This should, however, not be treated as endorsement of the views expressed in the report.
Disclosure of Interest Statement
1. Analyst ownership of the stock
2. Group/Directors ownership of the stock
3. Broking relationship with company covered
4. Investment Banking relationship with company covered
Dabur India
No
No
No
No
Analyst Certification
The views expressed in this research report accurately reflect the personal views of the analyst(s) about the subject securities or issues, and no part of the compensation of the research analyst(s) was, is, or
will be directly or indirectly related to the specific recommendations and views expressed by research analyst(s) in this report. The research analysts, strategists, or research associates principally responsible
for preparation of MOSt research receive compensation based upon various factors, including quality of research, investor client feedback, stock picking, competitive factors and firm revenues.
Regional Disclosures (outside India)
This report is not directed or intended for distribution to or use by any person or entity resident in a state, country or any jurisdiction, where such distribution, publication, availability or use would be contrary to
law, regulation or which would subject MOSt & its group companies to registration or licensing requirements within such jurisdictions.
For U.K.
This report is intended for distribution only to persons having professional experience in matters relating to investments as described in Article 19 of the Financial Services and Markets Act 2000 (Financial
Promotion) Order 2005 (referred to as "investment professionals"). This document must not be acted on or relied on by persons who are not investment professionals. Any investment or investment activity to
which this document relates is only available to investment professionals and will be engaged in only with such persons.
For U.S.
MOSt is not a registered broker-dealer in the United States (U.S.) and, therefore, is not subject to U.S. rules. In reliance on the exemption from registration provided by Rule 15a-6 of the U.S. Securities Exchange
Act of 1934, as amended (the "Exchange Act") and interpretations thereof by the U.S. Securities and Exchange Commission ("SEC") in order to conduct business with Institutional Investors based in the U.S.,
Motilal Oswal has entered into a chaperoning agreement with a U.S. registered broker-dealer, Marco Polo Securities Inc. ("Marco Polo"). Any business interaction pursuant to this report will have to be executed
within the provisions of this Chaperoning agreement.
This report is intended for distribution only to "Major Institutional Investors" as defined by Rule 15a-6(b)(4) of the Exchange Act and interpretations thereof by SEC (henceforth referred to as "major institutional
investors"). This document must not be acted on or relied on by persons who are not major institutional investors. Any investment or investment activity to which this document relates is only available to major
institutional investors and will be engaged in only with major institutional investors.
The Research Analysts contributing to the report may not be registered /qualified as research analyst with FINRA. Such research analyst may not be associated persons of the U.S. registered broker-dealer, Marco
Polo and therefore, may not be subject to NASD rule 2711 and NYSE Rule 472 restrictions on communication with a subject company, public appearances and trading securities held by a research analyst account.
Motilal Oswal Securities Ltd
Motilal Oswal Tower, Level 9, Sayani Road, Prabhadevi, Mumbai 400 025
Phone: +91 22 3982 5500 E-mail: reports@motilaloswal.com