2 August 2012
1QFY13 Results Update | Sector: Retail
Titan Industries
BSE SENSEX
S&P CNX
17,257
Bloomberg
Equity Shares (m)
52-Week Range (INR)
1,6,12 Rel. Perf. (%)
M.Cap. (Rs b)
M.Cap. (US$ b)
5,241
TTAN IN
887.8
255/154
-1/13/3
197.1
3.6
CMP: INR222
TP: INR220
Neutral
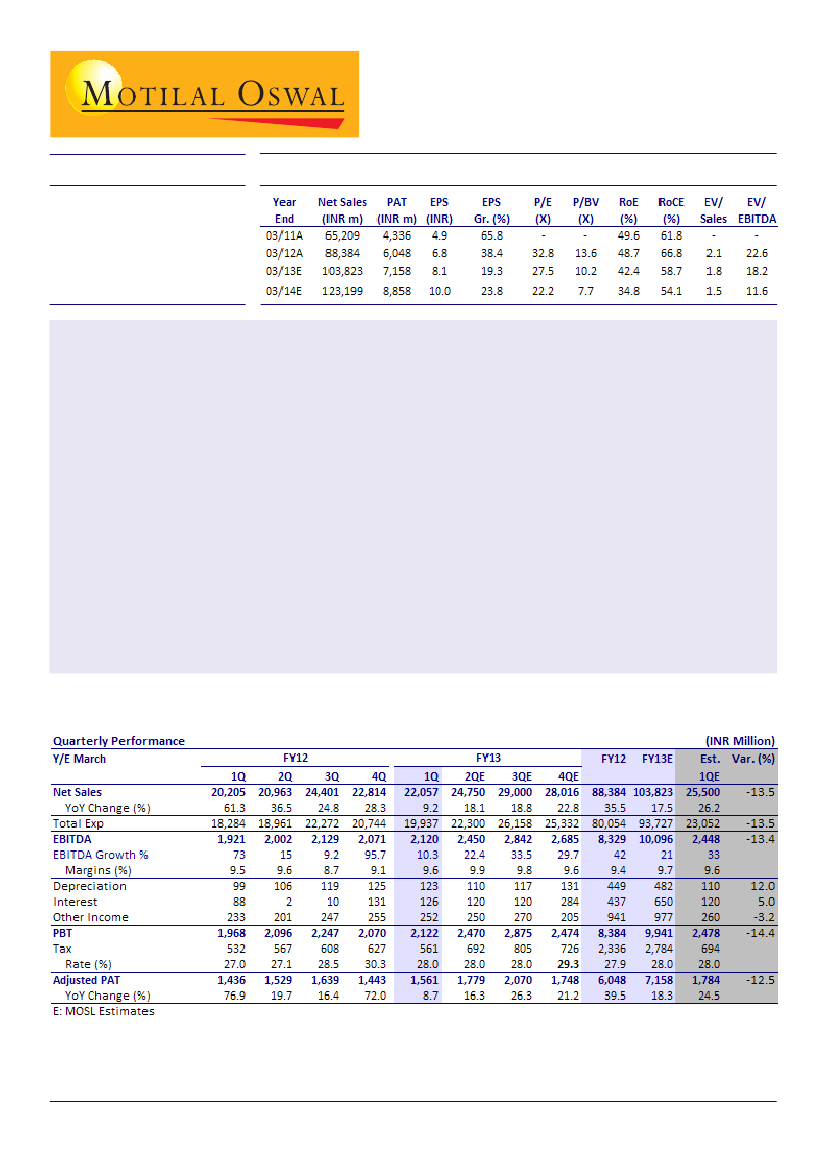
Titan Industries (TTAN) posted lower than expected numbers for 1QFY13. Performance was weak for both
Jewelry and Watches. Adjusted PAT for the quarter was INR1.6b against our estimate of INR1.8b.
Jewelry volumes declined 21% due to high gold prices and slowdown in consumer demand. Sales grew 8%
and EBIT grew 9%; margins remained flat YoY at 10.2%.
Watch business reported 14% sales growth (3% decline in volumes) while Eyewear sales grew 6% though like-
to-like (LTL) sales growth was just 1%. PE (Precision Engineering) business continued to be profitable.
The management indicated aggressive store expansion plan for FY13 - 100 Fastrack stores and 35 Helios
stores.
Jewelry volumes have suffered due to high gold prices and weak consumer sentiment due to high inflationary
environment.
We have been cautious on the volume growth scenario in the Jewelry business. However, we are positive on
TTAN's store expansion strategy to drive volumes. This will work in favor of the company due to the franchisee
model. Our estimates are under review.
The stock trades at 27.5x FY13E and 22.2x FY14E EPS. Maintain
Neutral.
Sreekanth P.V.S.
(Sreekanth.P@MotilalOswal.com); +9122 3029 5120
Investors are advised to refer through disclosures made at the end of the Research Report.
1

Titan Industries
Jewelry: Volumes decline 21%; margins remain flat YoY, studded share declines;
estimated jewelry market decline at ~40%
Jewelry sales increased 8% to INR17.7b; EBIT grew 8.7% to INR1.8b; EBIT margin
remained flat to 10.2%. Studded jewelry proportion declined to 25% (32% in
4QFY12).
Jewelry volumes declined 21%; LTL sales growth in Tanishq was 3% (25% in 4Q)
while it declined for GoldPlus by 8% (23% in 4Q).
32% YoY higher Gold prices and poor consumer sentiment impacted the demand
conditions.
TTAN added 5 World of Titan stores and 8 Fastrack stores during the quarter.
Customer decline during the quarter stood at 2.4%, however ticket size increased
by 11%. Studded jewelry sales grew by 22% in 1QFY13.
Segmental performance: 4QFY12 Jewelry margins cross 10%; watch sales increase 27% YoY
INR m
Total Sales
Watches
YoY Growth (%)
Jewellery
YoY Growth (%)
Others
YoY Growth (%)
Total EBIT
Watches
YoY Growth (%)
EBIT Margin (%)
Jewellery
YoY Growth (%)
EBIT Margin (%)
Others
1QFY11
12,584
2540
21.8%
9,505
49.6
538
37.5
1,116
416
46.9
16.4
683
223.0
7.2
17
2QFY11
15,428
3594
21.6%
11,274
37.0
560
80.6
1,754
774
32.9
21.5
1,026
77.8
9.1
-47
3QFY11
19,633
3268
35.6%
15,808
49.9
557
38.4
2,051
602
70.2
18.4
1,500
102.3
9.5
-52
4QFY11
17,662
3257
15.6%
13,617
37.3
788
90.5
1,039
65
-83.7
2.0
1,073
67.8
7.9
(99)
1QFY12
20,400
3154
24.2%
16,471
73.3
775
44.0
2,106
480
15.4
15.2
1,661
143.4
10.1
(36)
2QFY12
21,138
4174
16.1%
16,312
44.7
652
16.3
2,157
672
-13.2
16.1
1,499
46.0
9.2
(14)
3QFY12
24,632
3831
17.2%
19,859
25.6
942
69.1
2,316
480
-20.2
12.5
1,785
18.9
9.0
51
4QFY12
1QFY13
23,055
22,258
4138
3607
27.0%
14.4%
17,997
17,755
32.2
7.8
920
896
16.8
15.7
2,310
2,293
534
504
722.8
4.9
12.9
14.0
1,823
1,806
69.9
8.7
10.1
10.2
(47)
(16)
Source: Company, MOSL
Jewelry volumes decline 21% YoY …
…continuous decline in jewelry volumes due to high gold prices
Source: Company, MOSL
2 August 2012
2

Titan Industries
LTL sales growth slows down; Gold Plus performance disappointing
2QFY12
Tanishq GoldPlus
Sales Gr %
39
44
LTL Growth %
31
49
Stores
125
30
Jewelry
3QFY12
Tanishq GoldPlus
33
24
26
13
129
32
4QFY12
1QFY13
Tanishq GoldPlus
Tanishq GoldPlus
38
36
11
(1)
25
23
3
(8)
129
32
132
32
Source: Company, MOSL
Jewelry volumes decline 21%
Jewelry
Volume Gr %
Customer Gr %
Studded Share %
Sales Gr %
2QFY12
3
28
45
3QFY12
(5)
8
26
25
4QFY12
1QFY13
(7)
(21)
4
(2)
32
25
31
8
Source: Company, MOSL
Watches: 14% sales growth; volume decline 3%; margins decline 130bp
YoY
1QFY13 Watch sales increased 14% YoY to INR3.6b; volume decline by 3% (14%
growth in 4QFY12).
World of Titan and large format stores reported muted increase in LTL sales growth;
Helios and Fastrack reported double digit growth in LTL sales growth.
World of Titan sales increased 14%, Fastrack sales increased 86% and Helios sales
increased 177%. Like to like growth in World of Titan was 9% (18% in 4QFY12), in
Helios at 19% (-9% in 4QFY12) and in Fastrack at 12% (16% in 4QFY12). Large format
watch stores posted a 3% increase in LTL sales growth (19% in 4QFY12).
EBIT margins declined 130bp YoY due to a 2% increase in excise duty despite price
hikes.
Watch sales growth picks up; aggressive expansion plans across format
Watches
2QFY12
Sales
LTL
20
400
100
52
16
19
16
10
72
24
Stores
(x)
317
14
64
NA
3QFY12
Sales
LTL
10
470
77
24
17
11
8
18
21
(1)
Stores
(x)
326
21
85
NA
4QFY12
Sales
LTL
18
390
95
34
27
14
14
(9)
16
19
Stores
(x)
332
25
102
NA
1QFY13
Sales
LTL
Stores
(x)
337
25
110
NA
World of Titan
Helios
Fastrack
LFS - Watches
Sales Gr
Volume Growth
14
9
177
19
86
12
23
3
14
(3)
Source: Company, MOSL
Eyewear sales up 6%; EBIT losses reduce to INR16mn; PE business profitable
Others reported 16% increase in sales and EBIT of INR-16m with losses in
accessories and Eyewear even as PE business continued to grow profitably.
Eyewear reported 6% sales growth with LTL sales growth of 1%.
Titan Eye+ LTL sales up due to promotions
Stores
Sales Gr%
LTL Gr %
2QFY12
185
16
(19)
3QFY12
191
77
26
4QFY12
205
32
(1)
1QFY13
209
20
1
Source: Company, MOSL
3
2 August 2012

Titan Industries
Valuation and view
We remain cautious on the volume growth scenario in the Jewelry business. We are
lowering our earnings estimates by 4-8% for FY13 and FY14 to factor in lower jewelry
volumes and watch sales. We believe demand would remain subdued in both the
segments in the coming quarters. However, we are positive on TTAN's store expansion
strategy to drive volumes. This will work in favor of the company due to the franchisee
model. The stock trades at 27.5x FY13E and 22.2x FY14E EPS. Maintain
Neutral.
2 August 2012
4

Titan Industries
Titan Industries: an investment profile
Company description
Titan is one of the largest specialty retailers in India.
The company is a market leader in watches and a
pioneer in the branded jewelry market. The company's
economy segment watch 'Sonata' is the largest selling
watch in the country. Titan entered the branded jewelry
segment in 1996 with the Tanishq brand and continues
to be the largest player in this segment.
Key investment risks
Rise in gold prices would impact volume growth in
Jewelry division impacting the margins.
Longer than expected break even period of Titan
Eye+ is likely to strain profitability of the company.
Recent developments
TTAN added 5 World of Titan stores and 8 Fastrack
stores during the quarter.
Key investment arguments
Titan is a market leader in the organized segment
of the domestic watch industry with ~60% market
share. The branded watch retailing segment is
expected to report strong growth given that 60% of
the watch retailing industry is dominated by the
unorganized segment.
Tanishq, Titan's branded jewelry brand, is the largest
player in the Rs70b branded jewelry market in India.
Branded jewelry accounts for less than 10% of the
total jewelry market in India and is expected to
report 40% CAGR over the next 5 years.
Operating margins are expected to expand, as fiscal
benefits from units in backward areas and aggressive
cost cutting initiatives undertaken by the company
yield results.
Valuation and view
We are cutting FY13 and FY14 estimates by 4-8% to
INR8.1 in FY13 and INR10 in FY14.
The stock trades at 27.5x FY13E and 22.2x FY14E EPS.
Maintain
Neutral.
Sector view
We believe specialty retailers are better placed to
ward off the impact of the current slowdown. Ability
to generate cash flows to adequately finance
expansion plans put them in a better position.
Comparative valuations
Titan
Inds.
P/E (x)
EV/EBITDA (x)
EV/Sales (x)
P/BV (x)
FY13E
FY14E
FY13E
FY14E
FY13E
FY14E
FY13E
FY14E
27.5
22.2
18.2
11.6
1.8
1.5
10.2
7.7
Shoppers
Stop
35.9
26.3
16.0
12.5
1.2
0.9
4.1
3.6
EPS: MOSL forecast v/s consensus (INR)
MOSL
Forecast
FY13
FY14
8.1
10.0
Consensus
Forecast
8.5
10.6
Variation
(%)
-4.4
-5.8
Target Price and Recommendation
Current
Price (INR)
222
Target
Price (INR)
220
Upside
(%)
-1.1
Reco.
Neutral
Stock performance (1 year)
Shareholding pattern (%)
Jun-12
Promoter
Domestic Inst
Foreign
Others
2 August 2012
53.1
3.8
16.2
27.0
Mar-12
53.4
4.5
15.0
27.1
Jun-11
53.3
6.2
12.5
28.0
5

Titan Industries
Financials and valuations
2 August 2012
6

Titan Industries
N O T E S
2 August 2012
7

Disclosures
This report is for personal information of the authorized recipient and does not construe to be any investment, legal or taxation advice to you. This research report does not constitute an offer, invitation or inducement
to invest in securities or other investments and Motilal Oswal Securities Limited (hereinafter referred as MOSt) is not soliciting any action based upon it. This report is not for public distribution and has been
furnished to you solely for your information and should not be reproduced or redistributed to any other person in any form.
Unauthorized disclosure, use, dissemination or copying (either whole or partial) of this information, is prohibited. The person accessing this information specifically agrees to exempt MOSt or any of its affiliates
or employees from, any and all responsibility/liability arising from such misuse and agrees not to hold MOSt or any of its affiliates or employees responsible for any such misuse and further agrees to hold MOSt
or any of its affiliates or employees free and harmless from all losses, costs, damages, expenses that may be suffered by the person accessing this information due to any errors and delays.
The information contained herein is based on publicly available data or other sources believed to be reliable. While we would endeavour to update the information herein on reasonable basis, MOSt and/or its
affiliates are under no obligation to update the information. Also there may be regulatory, compliance, or other reasons that may prevent MOSt and/or its affiliates from doing so. MOSt or any of its affiliates or
employees shall not be in any way responsible and liable for any loss or damage that may arise to any person from any inadvertent error in the information contained in this report . MOSt or any of its affiliates
or employees do not provide, at any time, any express or implied warranty of any kind, regarding any matter pertaining to this report, including without limitation the implied warranties of merchantability, fitness
for a particular purpose, and non-infringement. The recipients of this report should rely on their own investigations.
This report is intended for distribution to institutional investors. Recipients who are not institutional investors should seek advice of their independent financial advisor prior to taking any investment decision
based on this report or for any necessary explanation of its contents.
MOSt and/or its affiliates and/or employees may have interests/positions, financial or otherwise in the securities mentioned in this report. To enhance transparency, MOSt has incorporated a Disclosure of Interest
Statement in this document. This should, however, not be treated as endorsement of the views expressed in the report.
Disclosure of Interest Statement
1. Analyst ownership of the stock
2. Group/Directors ownership of the stock
3. Broking relationship with company covered
4. Investment Banking relationship with company covered
Titan Industries
No
No
No
No
Analyst Certification
The views expressed in this research report accurately reflect the personal views of the analyst(s) about the subject securities or issues, and no part of the compensation of the research analyst(s) was, is, or
will be directly or indirectly related to the specific recommendations and views expressed by research analyst(s) in this report. The research analysts, strategists, or research associates principally responsible
for preparation of MOSt research receive compensation based upon various factors, including quality of research, investor client feedback, stock picking, competitive factors and firm revenues.
Regional Disclosures (outside India)
This report is not directed or intended for distribution to or use by any person or entity resident in a state, country or any jurisdiction, where such distribution, publication, availability or use would be contrary to
law, regulation or which would subject MOSt & its group companies to registration or licensing requirements within such jurisdictions.
For U.K.
This report is intended for distribution only to persons having professional experience in matters relating to investments as described in Article 19 of the Financial Services and Markets Act 2000 (Financial
Promotion) Order 2005 (referred to as "investment professionals"). This document must not be acted on or relied on by persons who are not investment professionals. Any investment or investment activity to
which this document relates is only available to investment professionals and will be engaged in only with such persons.
For U.S.
MOSt is not a registered broker-dealer in the United States (U.S.) and, therefore, is not subject to U.S. rules. In reliance on the exemption from registration provided by Rule 15a-6 of the U.S. Securities Exchange
Act of 1934, as amended (the "Exchange Act") and interpretations thereof by the U.S. Securities and Exchange Commission ("SEC") in order to conduct business with Institutional Investors based in the U.S.,
Motilal Oswal has entered into a chaperoning agreement with a U.S. registered broker-dealer, Marco Polo Securities Inc. ("Marco Polo"). Any business interaction pursuant to this report will have to be executed
within the provisions of this Chaperoning agreement.
This report is intended for distribution only to "Major Institutional Investors" as defined by Rule 15a-6(b)(4) of the Exchange Act and interpretations thereof by SEC (henceforth referred to as "major institutional
investors"). This document must not be acted on or relied on by persons who are not major institutional investors. Any investment or investment activity to which this document relates is only available to major
institutional investors and will be engaged in only with major institutional investors.
The Research Analysts contributing to the report may not be registered /qualified as research analyst with FINRA. Such research analyst may not be associated persons of the U.S. registered broker-dealer, Marco
Polo and therefore, may not be subject to NASD rule 2711 and NYSE Rule 472 restrictions on communication with a subject company, public appearances and trading securities held by a research analyst account.
Motilal Oswal Securities Ltd
Motilal Oswal Tower, Level 9, Sayani Road, Prabhadevi, Mumbai 400 025
Phone: +91 22 3982 5500 E-mail: reports@motilaloswal.com