10 August 2012
1QFY13 Results Update | Sector: Automobiles
Tata Motors
BSE SENSEX
17,561
Bloomberg
Diluted Eq.Shares (m)
52-Week Range (INR
1,6,12 Rel. Perf. (%)
M.Cap. (INR b)
M.Cap. (USD b)
S&P CNX
5,323
TTMT IN
3,323.8
321/138
-3/-5/46
794.4
14.4
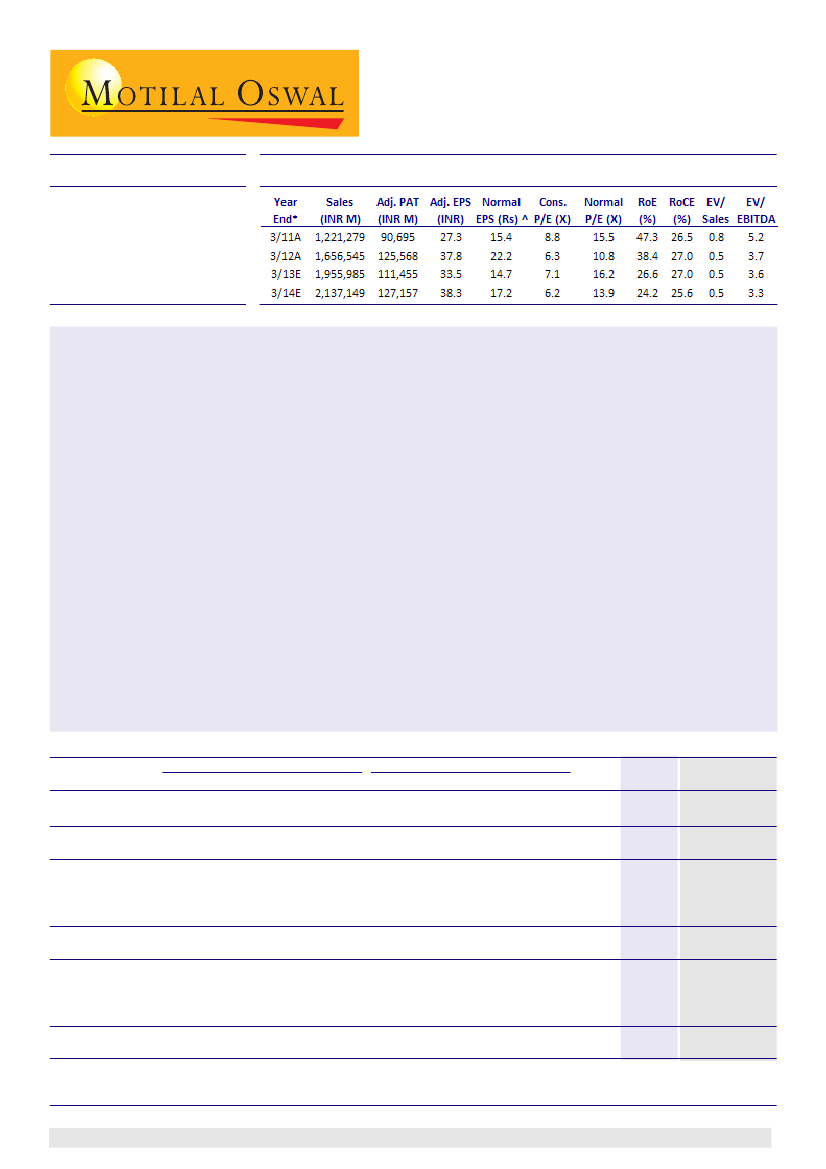
* Consolidated; ^ Normalized for capitalized expenses
CMP: INR239
TP: INR300
Buy
Tata Motors’ (TTMT) operating performance for 1QFY13 was better than we had expected. Margins in both the JLR
and standalone businesses were higher than our expectations. Consolidated EBITDA margin was 13.3% (v/s our
estimate of 12.2%) and adjusted PAT was INR25.6b (v/s our estimate of INR23.3b), driven by (a) favorable mix and
lower forex loss in JLR, (b) favorable mix, lower raw material cost and higher other income in standalone business,
(c) currency gains on JLR translation, (d) despite higher tax in JLR.
JLR’s realizations improved 3.2% QoQ (flat YoY) to GBP43,594 (v/s our estimate of GBP42,363), driven by
favorable mix. EBITDA margin declined 10bp QoQ (increased 110bp YoY) to 14.5% (v/s our estimate of 13.7%),
driven by higher capitalization (~120bp QoQ), which offset the impact of ~130bp QoQ higher cost. However,
higher tax at 29% (v/s our estimate of 19%) restricted JLR’s adjusted PAT.
S/A volumes declined 4% YoY (34% QoQ), impacted by decline in M&HCVs and PVs, despite growth in LCV
volumes. Realizations declined ~5% YoY (2% QoQ) to INR557k on adverse product mix, resulting in revenue
decline of 9% YoY (36% QoQ) to INR105b. EBITDA margin declined 220bp QoQ (150bp YoY) to 7.3% (v/s our
estimate of 5.5%), impacted by negative operating leverage.
While the management indicated that demand for Evoque remains healthy, it highlighted that JLR may not
remain isolated from the worsening macro environment in some key markets. However, it has maintained its
FY13 volume guidance of ~370,000 units and EBITDA margin of ~15%.
Valuation and view:
Our consolidated EPS estimate for FY13 has been downgraded by ~5% to INR33.5 (11%
downgrade in normalized EPS to INR14.7) due to increase in JLR’s tax rate, despite 9% upgrade in our EBITDA
estimate. The stock is trading at 7.1x FY13E and 6.2x FY14E consolidated EPS. Maintain
Buy.
Consolidated Quarterly Performance
Y/E March
1Q
Total Op Income
332,888
Growth (%)
23.0
EBITDA
42,358
EBITDA Margins (%)
12.7
Depreciation
11,432
Other Income
1,658
Interest Expenses
8,556
EO Exp/(Inc)
570
PBT after EO Exp
23,458
Tax rate (%)
15.0
PAT
19,939
Minority Interest
-39
Share
of Associates
96
Adj PAT
20,481
Growth (%)
(3.5)
E: MOSL Estimates
FY12
FY13
FY12
FY13E
2Q
3Q
4Q
1Q
2Q
3Q
4Q
361,975 452,603 509,079 433,236 463,481 479,878 579,390 1,656,545 1,955,985
26.9
44.0
44.3
30.1
28.0
6.0
13.8
35.6
18.1
45,039 68,270 67,445 57,548 60,716 58,545 75,971 223,112 252,781
12.4
15.1
13.2
13.3
13.1
12.2
13.1
13.5
12.9
13,308 16,159 15,354 15,659 16,000 16,500 21,179 56,254 69,338
608
1,675
1,586
2,386
1,250
1,500
1,700
6,618
6,836
5,251
7,204
7,721
8,044
7,000
7,000
7,831 29,822 29,875
4,390
1,643
1,713
4,405
0
0
0
8,315
4,405
22,700 44,938 44,243 31,826 38,966 36,545 48,661 135,339 155,999
16.0
23.8
-41.3
27.3
31.3
31.3
31.5
-0.3
30.5
19,069 34,227 62,504 23,138 26,789 25,125 33,321 135,739 108,373
-335
-210
-239
-276
-250
-175
22
-823
-679
40
22,461
6.4
38
35,307
43.9
75
44,403
79.2
-414
25,651
25.2
160
26,699
18.9
190
25,140
-28.8
764
249
700
34,107 125,568 111,455
-23.2
38.5
-11.2
(INR Million)
FY13
Var
1QE
(%)
430,668
1
28.28
52,542
10
12.2 110bp
16,500
-5
1,350
77
7,500
7
0
29,432
8
20.87 640bp
23,290
-1
-100
176
150
23,340
28.2
-376
10
Jinesh Gandhi
(Jinesh@MotilalOswal.com) + 91 22 3982 5416
Chirag Jain
(Chirag.Jain@MotilalOswal.com) + 91 22 3982 5418
Investors are advised to refer through disclosures made at the end of the Research Report.