1 October 2012
Update | Sector: Automobiles
Tata Motors
BSE SENSEX
S&P CNX
18,763
5,703
CMP: INR267
TP: INR370
Buy
JLR momentum to sustain; 13.4% volume CAGR over FY12-15
Strong FCF to drive de-leveraging despite significant investment program
Bloomberg
TTMT IN
Actual Eq. Shares (m)
3,173.8
Diluted Eq.Shares (m) 3,323.8
52-Week Range (INR
321/145
1,6,12 Rel. Perf. (%)
7/-11/57
M.Cap. (INR b)
889.0
M.Cap. (USD b)
16.9
JLR product action, market expansion to drive 13.4% CAGR (FY12-15)
Luxury vehicle market volume momentum remains intact. Top 4 players grew
~9.3% in FY13YTD (Apr-Aug) led by 21% growth in China. Luxury SUV (JLR's strength)
growth remains robust across markets; FY13YTD, SUV volume growth is 40% for
JLR and 18% for Mercedes Benz. Expect JLR's volumes to grow ~15% in FY13 leading
the 13.4% CAGR over FY12-15E on the back of product expansion (40 product
actions over 5 years) and further market penetration. JLR's China volumes should
benefit from expected ~18% CAGR in the market over CY11-15, JLR's own dealer
expansion and Chery JV enabling JLR to compete better with a production base
in China.
Valuation summary (INR b)
Y/E March
2012 2013E 2014E
Net Sales
1,657 1,971 2,186
EBITDA
237
271
310
NP
126
110
137
EPS (INR)
37.8 33.2 41.3
EPS Gr. (%)
38
-12
24
BV/Sh. (INR) 103.0 133.8 169.8
P/E (x)
7.1
8.0
6.5
Norm. P/E (x) 12.0 19.1 13.7
P/BV (x)
2.6
2.0
1.6
EV/EBITDA (x) 4.4
3.7
3.1
EV/Sales (x)
0.6
0.5
0.4
RoE (%)
38.4 25.2 24.7
RoCE (%)
24.1 23.9 24.2
M&HCV segment could witness strong revival in FY14
Likely bottoming out of IIP growth (1.4% in FY13, lowest since FY92), expected
interest rate downcycle, and favorable macro impetus (e.g. FDI in retail) should
augur well for M&HCV business. We expect Tata Motors' (TTMT) M&HCV volume
to grow 10% in FY14, recovering from likely 12% de-growth in FY13. LCV volume
momentum remains strong with ~20% growth in FY13YTD. Expect 15% CAGR in
LCV volumes over 2 years, driven by SCVs.
Consolidated EBITDA margin to improve in FY14, strong FCF despite
aggressive capex
We expect Consolidated EBITDA margin to recover 50bp in FY14 to 14.2%. JLR's
EBITDA margin should improve 60bp to 15% in FY14 on the back of better mix and
operating leverage. We believe TTMT has multiple levers to support/improve
margins over next 3-4 years. Our estimates for FY15 are yet to factor in any benefits
from the Chery JV and own engine plant in UK & India. Our estimates suggest
consolidated FCF generation of INR274b over FY13-15, despite investing ~INR600b,
transforming it into a net cash company by FY15.
Shareholding pattern %
As on
Jun-12 Mar-12 Jun-11
Promoter
34.8
34.9
34.9
Dom. Inst 12.0
12.7
13.7
Foreign
44.9
44.5
43.1
Others
8.4
7.9
8.3
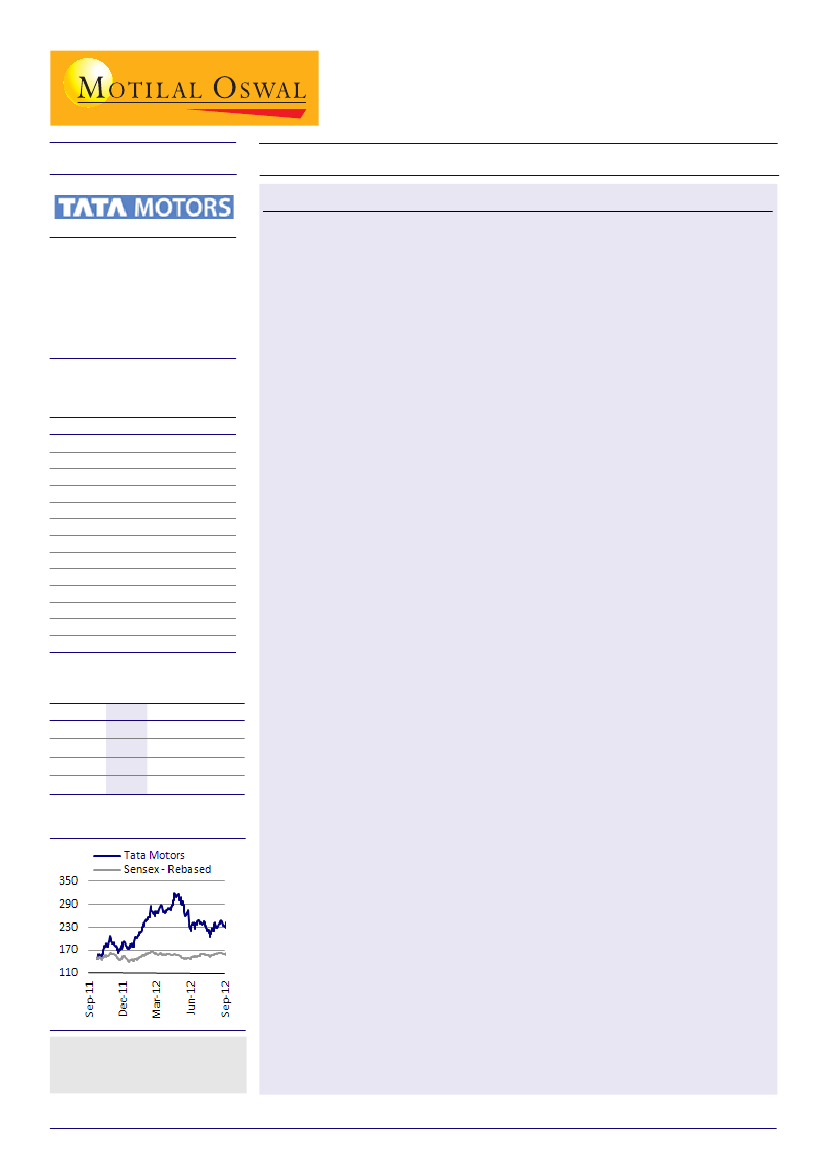
Stock performance (1 year)
8% upgrade in FY14 EPS; Buy with TP of INR370/223 (ordinary/DVR)
We believe JLR is on the right strategic path and is investing in the right areas,
resulting in its evolution to a much stronger and balanced player in the luxury
vehicle market. The CV business, which contributes ~35% to fair value, is expected
to witness recovery in FY14, resulting in significant improvement in standalone
operations. We are upgrading our FY14 consolidated EPS by 8.1% to INR41.1 to
factor in for improvement in JLR's product mix. The ordinary/DVR stock is currently
trading at 8x/4.8x FY13E and 6.5x/3.9x FY14E consolidated EPS. Maintain
Buy
with
revised target price of INR370 (FY14 SOTP based) for ordinary share and INR223
for DVR (40% discount to ordinary).
Investors are advised to refer
through disclosures made at the end
of the Research Report.
Jinesh Gandhi
(Jinesh@MotilalOswal.com); + 91 22 3982 5416
Chirag Jain
(Chirag.Jain@MotilalOswal.com); + 91 22 3982 5418

Tata Motors
Story in charts Volume momentum to sustain; Strong FCF to drive de-leveraging
Driven by new product actions & further market
penetration, JLR volumes estimated to grow at
13.4% CAGR over FY12-15E.
FY14 EBITDA margins to benefit from mix
improvement and operating leverage. Our FY15
estimates yet to factor in for any benefit of Chery
JV and own engine plant.
In worst case scenario of ~10% volume de-growth
in FY14 JLR volumes, TTMT's SOTP is INR286.
Consolidated FCF generation of INR274b over
FY13-15, despite investing ~INR600b,
transforming it into a net cash company by FY15.
With bottoming out of IIP in FY13 at 1.4%, lowest
since FY92, favorable macro impetus and expected
interest rate downcycle should augur well for
M&HCV business.
JLR volumes est. to grow at 13.4% CAGR over FY12-15E
'000 Units
JLR: FY14 Volumes Sensitivity Analysis
Scenario
Base Case
Volumes (units)
396,087
Monthly run-rate (units)
33,007
Growth (%)
9.2
EBITDA (GBP m)
2,619
EBITDA Margins (%)
15.0
PAT (GBP m)
1,358
Growth (%)
-8.3
TTMT Consol EPS (INR)
41.3
TTMT SOTP TP (INR/Share)
371
Upside (%)
42.9
A
326,304
27,192
-10.0
1,791
12.4
771
-48.0
23.2
286
10.2
C
362,560
30,213
0.0
2,221
13.9
1,076
-27.4
31.0
330
27.2
E
416,944
34,745
15.0
2,866
15.6
1,534
3.6
42.8
397
52.7
M&HCV volumes are sensitive to interest rate movements
Consolidated EBITDA margins to improve in FY14
TTMT to generate ~INR274b of FCF, despite investing ~INR600b over FY13-15, transforming it into a net cash company by FY15
(INR b)
(INR b)
1 October 2012
2

Tata Motors
JLR: Product actions to drive volume CAGR of 13.4% (FY12-15)
China volume momentum intact; to get boost by dealership expansion
Luxury vehicle market volume momentum remains intact. Top 4 players grew ~9.3% in
FY13YTD led by 21% growth in China.
Luxury SUV growth remains robust across markets; FY13YTD, SUV volume growth is 40%
for JLR and 18% for Mercedes Benz.
Expect JLR's volumes to grow ~15% in FY13 leading the 13.4% CAGR over FY12-15E on the
back of product and market expansion.
JLR's China volumes should benefit from expected ~18% CAGR in the market over CY11-15
as well as JLR's own dealer expansion.
Luxury vehicle momentum intact, with strong growth for luxury SUVs
Momentum in the global luxury vehicles market remains intact despite challenging
macro environment. Volumes of top 4 players (Audi, BMW, JLR and Mercedes Benz
(MB)] are up 10% in Aug-12 and 9% FY13YTD (Apr-Aug 2012). Volumes across key
markets are holding up well, with China continuing to grow strongly, and US/UK markets
steadily. In China, wholesale volumes of top 3 (Audi, BMW, MB) grew 21% in FY13YTD.
In US/UK, retail volumes for top 4 (Top 3 + JLR) grew 10%/5%.
Further, luxury SUV volume growth remains robust across markets and players, and
has been one of the key contributors to overall volume growth. Most players do not
disclose SUV volumes separately; however, their commentary on volumes distinctly
highlights strong growth in this category e.g. FY13YTD, SUV volumes grew 40% for JLR
and 18% for MB.
Volume momentum for top-4 remains intact
China momentum remains strong *
Volume momentum remains intact, with ~9% FY13YTD growth for top-4 players. In China, wholesale volumes of top 3
(Audi, BMW, MB) grew 21% in FY13YTD. In US/UK, retail volumes for top 4 (Top 3 + JLR) grew 10%/5%.
* Aggregate wholesale volumes of Audi, BMW and Mercedes Benz
Source: BMW, Company, MOSL
1 October 2012
3

Tata Motors
Retail volume growth holding up well in both US and UK ^
^ Aggregate retail volumes of Audi, BMW, JLR and Mercedes Benz
Source: BMW,Company, MOSL
Expect JLR to deliver 15.3% growth in FY13 and 13.4% CAGR over FY12-15
We expect JLR to deliver 15.3% volume growth in FY13 on the back of (1) momentum
in luxury vehicle market, coupled with (2) strength in Evoque volumes, and (3) other
new product actions. We expect FY13 Evoque volumes at 100-110,000, and non-Evoque
portfolio to grow 5-7% (v/s 9% de-growth in FY13YTD). Recovery in non-Evoque
volumes would be driven by several product actions in 2HFY13: (a) new Range Rover
launch, (b) AWD Jaguar in USA, (c) MY13 Freelander 2, and (d) expansion of dealer
network in China by 35 to ~145 dealers by Mar-13. Also, recent capacity addition in
Halewood plant (25,000 units) will ease capacity constraints on Freelander.
We believe JLR's 2HFY13 launches coupled with its future product pipeline will
diversify and enhance its offerings, thus strengthening its business. It plans to
complete 40 new product actions over next 5 years, which includes (1) a new platform
every 7 years, (2) major refreshes every 4 years for each model, and (3) minor refreshes
every 2 years. FY14 will see full benefit of new Range Rover (retail launch in Jan-13),
XF Sportbrake and launch of new Range Rover Sport , whereas FY15 could see launch
of smaller Jaguar, new Defender and a Jaguar Crossover. Of these new launches, smaller
Jaguar would be a very important product as it will be positioned in the high-volume
executive luxury car segment. This is 1.25m cars per annum market dominated by
BMW 3 series, Mercedes C Class, etc, and where JLR has no presence currently. As a
result, we expect JLR to deliver ~13.4% volume CAGR over FY12-15.
1 October 2012
4

Tata Motors
Expect JLR volume to improve from Oct-12, despite high base (units)
Source: Autocar
Jaguar's - New product pipeline
Launch
schedule
2012 (late)
2013
2013
2013
2013
2013
2014
2014
2015
(mid)
(mid)
(late)
(Mid)
(mid)
(late)
(mid)
Model
XF Sportbrake
(estate)
XE sports car
XJ Facelift
New XK
F-Type
C-X75
Compact saloon
Crossover
New XF
Comments/ features
1st estate from Jaguar; BMW & Audi gets cum.
~0.1m vols from this segment
All-new Boxter competitor
Segment volumes
m units
0.1
Launches new styling theme
Sportscar
Sportscar
Marks entry into Executive segment having volumes of over 1.1m p.a
1.25
Marks entry into Crossover segment; Platform variant of Saloon/ SUV E segment
Alloy Chasis-5-series rival
1
Source: Autocar
0.25
0.25
Land Rover's - New product pipeline
Sep-11
2012
2012
2013
2014
2014
2016
2016
Evoque
New Range Rover
MY13 Freelander 2
New RR Sport
New Defender
Grand Evoque
New Freelander
New Discovery
Source: Autocar
Smallest Range Rover
Ligher than current model, based on PLA platform
Revamped interiors and minor tweaks on exterior
New ZF eight-speed gearbox and based on PLA platform
Defender replacement, focusing on segment having ~0.2m p.a volumes
Based on Evoque's platform and to be positioned in SUV D segment,
where JLR has weak presence
0.6
0.4
0.6
0.3
0.3
~40 product actions to drive 13.4% CAGR in volumes over FY12-15E ('000 units)
Source: Autocar
1 October 2012
5

Tata Motors
China volumes driven by strong demand, dealer expansion and Cherry JV
China is already one of the biggest markets for luxury cars and is expected to become
number one in next 1-2 years, driven by strong demand on the back of rising income
levels and urbanization. The Chinese luxury car market is expected to grow @ 18%
over CY11-15 and 11% over CY11-20 (source: Global Insights).
China is one of the most important and profitable markets for JLR. Like most luxury
carmakers, JLR too is taking several initiatives to improve its competitiveness in the
Chinese market. These include:
(1) Increasing dealer network from ~110 dealers to 145 by March 2013, with focus on
tier-2/3 cities.
(2) Modifying products to suit local taste with changes like long wheelbase, smaller
petrol engines, etc.
(3) Setting up manufacturing operations in China through a JV with local company
Chery Auto (government approvals are awaited).
China luxury vehicle market estimated to growth at
11% CAGR over CY11-20
Dealer network in China (Nos)
JLR's volume in China to benefit from strong underlying growth & dealer expansion
CAGR
2011-2020
11.3%
Strong volume growth coupled with higher realizations is driving increasing contribution from China
GBP
Chinese market is one of the most important and profitable market for JLR
*FY12/FY13
Source: BMW, Company, MOSL
6
1 October 2012

Tata Motors
JV with Chery Auto to improve JLR's competitiveness in China
JLR has entered into an equal JV with Chery Auto of China to develop,
manufacture and sell in China certain JLR vehicles, and at least one own-branded
model. The term of the JV is 30 years.
JLR would be investing ~GBP350m as its equity contribution in this JV. The total
investment by the JV is reported to be GBP2.3b.
Chery, founded in 1997, is China's largest independent carmaker with CY11
volume of ~0.64m. It does not have a presence in the luxury car segment.
The JV will leverage the strength of both partners, and enable JLR to compete
better with a production base in China (its global peers already have
manufacturing presence here). China imposes import duties of ~80% on CBUs
and ~30% on CKDs.
1 October 2012
7

Tata Motors
M&HCV segment could revive strongly in FY14 on better macro
LCV volume momentum to remain strong
Likely bottoming out of IIP growth (1.4% in FY13, lowest since FY92), expected interest
rate downcycle, and favorable macro impetus (e.g. FDI in retail) should augur well for
M&HCV business.
We expect TTMT's M&HCV volume to grow 10% in FY14, recovering from likely 12% de-
growth in FY13.
LCV volume momentum remains strong with ~20% growth in FY13YTD. Expect 15% CAGR
in LCV volumes over two years, driven by SCVs.
Rising contribution of LCVs (~69% of CV volumes v/s 58% in FY09) has reduced volatility in
CV business for TTMT.
M&HCV: Near-term pressure given slowing economy
The domestic M&HCV market is facing volume pressure (down 12% YoY FY13YTD),
reflecting the slowdown in industrial and economic activity. Our channel interaction
indicates that fleet operators have been reluctant to expand their fleet size given the
currently weak economy. Moreover, discount levels have increased substantially over
the last few months as recent entrants attempt to gain market share in a slowing
market.
Unlike the 2008 financial crisis, there has been no major constraint on financing
environment with Net NPA levels of NBFCs being less than 1%, although there are
increasing instances of delayed payments by fleet operators. Also, post recent
production cuts, channel inventory is currently at comfortable levels.
M&HCVs - Goods Domestic (units)
Aug-12 volumes
positively surprised us,
as we expecting higher
de-growth
Source: Company, MOSL
M&HCV volumes could recover strongly in FY14
Recent reform initiatives of the India government have improved sentiment
somewhat, and could help revive the economy in FY14. Key macro-economic variables
influencing the M&HCV market, viz, interest rates, industrial activity and infrastructure
development, are expected to improve, which augur well for demand. We believe
M&HCV growth could surprise on the upside as pent-up demand (deferred FY13
replacement demand) gets realized.
1 October 2012
8

Tata Motors
M&HCV volumes are highly sensitive to Industrial activity and interest rate movements
Our economist believes IIP growth has bottomed out at 1.4%
for FY13, the lowest since 1992. Industrial activity will benefit
from favorable macro impetus, expected interest rate
downcycle, and a low base. These factors will likely result in
an upturn of industrial growth to 5.6% in FY14.
M&HCV cycles are generally sharp & severe. Hence there is
high upside risk to our FY14 volume growth estimates
*data prior to FY02 relates to CY; ^ positive interest rate movement indicates rate cuts
Source: SIAM
LCVs continue to grow at healthy rates, lowering cyclicality
Small CVs to drive 15% growth in LCVs:
Domestic LCV market momentum remains
robust with FY13YTD volume growth at 20% and TTMT at 17%. Led by relatively
stable consumption expenditure and need for last mile connectivity (especially
in rural markets), LCVs continue to register healthy growth driven by small CVs
(e.g. Ace).
Rising share of LCVs CV-mix improving margins, lowering cyclicality:
With the
launch of Tata ACE in 2005, small CV sales clocked a robust 24% CAGR over FY05-12.
LCV now contributes ~69% of CV volumes (v/s 58% in FY09), resulting in relatively
lower volatility in CV volumes. As small CVs are relatively less cyclical and more
profitable, higher LCV share is improving TTMT's CV business profile (LCV is TTMT's
most profitable domestic segment).
Strong growth in LCVs driven by Small CVs
Tata Motor's domestic LCV volume growth of ~17% (including
passenger variants of SCVs).
Tata Motors: LCVs contribution on continuous uptrend
Increasing contribution of LCVs (~69% of CV volumes (v/s 58%
in FY09) have reduced volatility in CV business for Tata Motors.
Source: SIAM
1 October 2012
9

Tata Motors
Improvement in both JLR and CV business to drive up EBITDA
margin in FY14
Generating FCF despite aggressive capex; balance sheet further deleveraged
We expect consolidated EBITDA margin to expand by 50bp in FY14 to 14.2%.
JLR's EBITDA margin should expand 60bp to 15% in FY14, driven by mix improvement and
operating leverage. There are multiple levers to support/enhance margins over the next
3-4 years.
Standalone business is likely to witness ~80bp margin expansion to 8.8%, driven by recovery
in M&HCV volumes and continuance of strong LCV volumes.
Consolidated FCF generation of INR274b over FY13-15, despite TTMT investing ~INR600b,
would transform it into a net cash company by FY15. Our estimates do not fully factor in
the benefits of the investment program.
JLR margins - limited downside from current level; multiple levers to drive
margins
We expect JLR's profitability to remain under pressure over the next six months due
to higher discounts for running out the old Range Rover and seasonally weaker 2Q.
However, EBITDA margin should expand from 4QFY13, driven by market mix tilting in
favor of China (24.5% volume contribution by FY14 v/s 17.3% in FY12), product mix
shifting in favor of the new Range Rover (~12% premium to the old one) and favorable
forex. In the long term, commissioning of the Chery JV in China (by FY15) and own
engine plant (for 4-cylinder engines) in UK and India (FY15/FY16) would also improve
JLR's cost competitiveness and EBITDA margin. We discuss below the key drivers in
detail.
EBITDA margin to improve in FY14
We expect EBITDA margin
for FY14 to be favourably
impacted by mix
improvement and
operating leverage. Our
estimates for FY15 are yet
to factor in any benefits
from the Chery JV and
own engine plant.
Source: Company, MOSL
Mix improvement (product and market):
With strong growth expected in China
due to market expansion, dealer expansion and launch of localized products,
contribution of China to FY14 volumes and revenues is likely to increase to 24.5%
and 41%, respectively (from 17% and 29%, respectively in FY12). The market mix
improvement will be supplemented by improvement in product mix, driven by
launch of premium products like the new Range Rover (4QFY13), new Range Rover
Sport (mid-FY14) and F-Type Sport car (mid-CY13). Our estimates partly factor in
improvement in product mix, but are yet to factor in improvement in market mix.
10
1 October 2012

Tata Motors
Mix improvement to be driven by strong growth in China and launch of premium products (%)
Source: Company, MOSL
Range Rover: List price for entry trim level (UK)
New Range Rover at
~12% premium to
outgoing model
GBP
3 Ltr V6 Diesel
4.4Ltr SDV8 Diesel
5 Ltr V8 Petrol
New
58,983
64,354
81,092
Old
-
57,494
71,368
Premium (%)
NA
11.9
13.6
Source: Company, MOSL
Favorable forex movement:
Favorable movement in the USD (net exporter) and
EUR (net importer) against the GBP would support EBITDA margin. We estimate
~30bp QoQ margin improvement in 2QFY13 based on the prevailing GBP/USD and
EUR/GBP rates.
Operating leverage:
We estimate ~13.7% volume CAGR over FY12-15. However,
our estimates do not fully factor in the resultant operating leverage. In fact, our
estimates factor in ~40bp increase in fixed costs over FY12-14. Operating leverage
in the luxury car business is very high and lower volumes is a key reason behind
the lower profitability for JLR vis-à-vis its peers.
Trend in volumes and fixed cost (as % of sales)
Our estimates do not
fully factor in the benefit
of operating leverage
Source: Company, MOSL
1 October 2012
11

Tata Motors
Chery JV to improve JLR's competitiveness and profitability:
Upon commissioning
of the Chery JV in China, JLR would be on equal footing in the Chinese market
with its peers, who already have local manufacturing bases in China and do not
have to pay very high import duties. On comparing the prices of luxury vehicles in
China, we note that (a) vehicles are priced at premium (v/s UK pricing) even after
adjusting for import duty, and (b) locally manufactured as well as imported vehicles
are similarly priced. We believe that JLR would also be able to retain some pricing
premium upon having local manufacturing facilities.
Pricing premium in China (v/s UK pricing) also due to high import duty
Similar pricing for model which is imported as well as locally made (CNY '000)
Luxury vehicles enjoy
premium pricing in China
as compared to other
markets, even after
adjusting for import
duties
Source: BMW, Company, MOSL
Captive source for engines from FY15:
JLR has announced plans to invest GBP355m
in an engine plant at Wolverhampton, UK. The new plant will design, engineer
and manufacture engines with lower emissions than current models for a new
range of four-cylinder gasoline and diesel vehicles. However, it would continue
to source V6s and V8s, both diesel and petrol, from Ford. Having captive source of
engines will help JLR compete with its peers, especially in the growth markets of
China and Russia. Apart from the engine plant in UK, it is also planning to set up a
similar engine plant in India, with an investment of ~GBP400m. According to media
articles, these engines will be modular in design and up to 2.0 liters in capacity.
When both the plants are operational by FY15, engine capacity could reach 500,000
units per year, which would be sufficient to cater to its expanded operations
(including Chinese JV).
12
1 October 2012

Tata Motors
Incentives at higher levels, impacted by model change and moderation in
demand
The level of incentives offered by luxury car makers has increased over the last few
months in key markets. However, the biggest driver of higher incentives is the ongoing
model change for several key models across key markets, necessitating higher
discounts for run-out old models. Also, increased supply and some moderation in
demand growth have resulted in withdrawal of premium charged by dealers, especially
in markets like China. This has resulted in normalization of dealer margins. Earlier,
dealers used to earn super-normal margins due to very high waiting periods on key
models in China. While current incentive levels for JLR are normal, if demand weakens
further, it would have to increase incentives to support demand. Further, as the
contribution of new products (Evoque, New Range Rover and New Range Rover Sport)
increases, it would restrict the impact of any increase in incentives, as new products
generally tend to have no discounts.
Multiple model changes necessitating higher incentives to run-
out old model
Month
May-12
Jun-12
Jul-12
Aug-12
Model Changes
BMW 6 Series Gran Coupé in June 2012
Mercedes: New GLK
Audi: New generations of the A4 & A5 in US
BMW: New 7 Series & X1
Audi Q3 in China
New BMW 3 Series with xDrive
Mercedes: End-August new B Class in China;
New A Class in Sep-12
Audi A3 & updated Q5
Source: Company, MOSL
Higher contribution of new products to restrict impact of any
increase in incentives (%)
Source: Company, MOSL
Domestic margins to remain stable - benign RM cost, better product mix
(LCVs) negated by higher discounts on M&HCV/PVs
The management has indicated that RM cost has been stable, with commodity prices
softening. This coupled with favorable mix (higher LCV volumes) would offset the
impact of lower volumes and higher discounts in the M&HCV/PV business. We estimate
stable EBITDA margin in FY13 at 8% (10bp lower than FY12) - the ~100bp decline in RM
cost would be offset by higher discounts and lower operating leverage. Current EBITDA
margin is near the historical low of 6.7% in FY09 as against the 10-year average of
~10.4%. While we expect volume recovery in M&HCVs from FY14, we estimate just
~70bp margin expansion in FY13, driven by operating leverage and softening in RM
cost, but benefit of which would be diluted by higher competitive intensity in the
domestic M&HCV industry.
1 October 2012
13

Tata Motors
Improving product mix (in favor of LCVs, %)
RM cost to moderate, reflecting soft commodity prices and
better product mix
Source: Company, MOSL
Lower volumes resulting in negative operating leverage in FY13 EBITDA margin to remain well below LPA of 10.4%
Source: Company, MOSL
Strong FCF generation despite higher capex to drive continued balance sheet
deleveraging
TTMT would be investing ~INR600b over FY13-15 in R&D and capacity creation in both
JLR and domestic business. JLR would be investing ~GBP2b/year over the next three
years in product development, engine plants in UK and India, and the Chery JV.
Domestic business has plans to invest ~INR30b/year in product development, new
capacities and marketing infrastructure.
Despite its significant investment program, the benefit of which will be realized only
in the future, TTMT is likely to generate FCF of ~INR274b over FY13-15, driven strong
cash flow from operations (CFO) of ~INR870b. We estimate JLR's FCF generation at
~GBP680m, based on CFO of ~GBP7.25b, whereas the domestic business would
generate FCF/ CFO of ~INR81b/171b.
1 October 2012
14

Tata Motors
TTMT to generate ~INR274b of FCF, despite investing
~INR600b over FY13-15… (INR b)
…transforming it into a net cash company by FY15 (INR b)
Source: Company, MOSL
1 October 2012
15

Tata Motors
Sustained growth to drive deleveraging; upgrading FY14 EPS 8%
Target price of INR370 implies 39% upside; Buy
While we maintain our consolidated EPS estimate for FY13 at INR33.5, we are upgrading
our FY14 consolidated EPS estimate by 8.1% to INR41.1 to factor in improvement in JLR's
product mix.
We believe JLR is on the right strategic path and is investing in the right areas, resulting in
its evolution to a much stronger and balanced player in the luxury vehicle market.
The CV business, which contributes ~35% to fair value, is expected to witness recovery in
FY14, resulting in significant improvement in standalone operations.
Maintain Buy with a revised target price of INR370 (FY14E SOTP-based) for ordinary shares
and INR223 for DVR (~40% discount to the TP for ordinary shares).
Upgrading EPS estimate for FY14 by 8%
While we maintain our consolidated EPS estimate for FY13 at INR33.5, we are upgrading
our consolidated EPS estimate for FY14 by 8.1% to INR41.1 and normalized EPS
estimate by 13.9% to INR19.5 to factor in improvement in JLR's product mix, though
we are yet to factor in the benefit of operating leverage. Our key assumptions are:
JLR volume growth of 15.3%/9.2% in FY13/FY14 to 362,560/396,087units. Driven by
product mix improvement, we expect EBITDA margin to recover to 15% in FY14
(from 14.4% in FY13), resulting in 16% EBITDA growth in FY14 (12% in FY13).
However, increase in depreciation (due to new launches) would result in 22% PAT
de-growth in FY13 and 17% PAT growth in FY14.
Domestic volumes are likely to grow just 1.5%/14.5% in FY13/FY14, with growth of
-12%/7.5% for M&HCVs, 15%/15% for LCVs and -4%/18% for PVs. We expect EBITDA
margin to remain stable at 8% in FY13, but improve 70bp to 8.7% in FY14, driven by
operating leverage.
Revised forecast (INR b)
Rev
Consolidated - Key Assumptions
Net Sales
EBITDA
EBITDA Margins (%)
Net Profit
Cons EPS
Normal. EPS
JLR - Key Assumptions (IFRS)
Volumes ('000 units)
Normal. EBITDA
EBITDA Margins (%)
Net Profit
Standalone - Key Assumptions
Volumes ('000 units)
EBITDA
EBITDA Margins (%)
Net Profit
1,971
271
13.7
111
33.5
14.2
363
120
14.4
101
937
43
8.0
24
FY13E
Old
1,956
268
13.7
111
33.5
14.7
365
116
14.3
99
970
46
8.1
17
Chg (%)
0.8
0.9
0bp
-0.2
-0.2
-3.2
-0.7
3.3
10bp
2.5
-3.4
-7.4
-10bp
44.2
Rev
2,180
309
14.2
137
41.1
19.3
396
138
15.0
116
1,072
53
8.7
21
FY14E
Old
2,137
293
13.7
127
38.3
17.2
399
123
14.3
102
1,072
56
8.7
24
Source:
Chg (%)
2.0
5.2
40bp
7.6
7.5
12.6
-0.7
11.9
60bp
13.3
0.0
-5.1
0bp
-10.8
MOSL
Our JLR estimates are to
factor in for any benefit
from own engine plant
and Chery JV
1 October 2012
16

Tata Motors
Buy with a target price of ~INR370, an upside of 39%
We believe JLR is on the right strategic path and is investing in the right areas,
resulting in its evolution to a much stronger and balanced player in the luxury
vehicle market.
JLR's volume momentum is likely to remain strong, driven by product actions,
though there are potential macro headwinds that can impact volumes in the EU
(~23% of volumes). Strength in volumes coupled with mix improvement would
drive EBITDA margin.
The CV business, which contributes ~35% to fair value, is expected to witness
recovery in FY14, resulting in significant improvement in standalone operations.
The stock is currently trading at 8x FY13E and 6.5x FY14E consolidated EPS. The
DVR stock trades at 4.8x FY13E and 3.9x FY14E consolidated EPS.
Maintain
Buy,
with a revised target price of INR370 (FY14E SOTP-based) for ordinary
shares and INR223 for DVR (~40% discount to the TP for ordinary shares).
Tata Motors: Sum-of-the-parts valuation (INR b)
Valuation Parameter Multiple (x)
SOTP Value
Tata Motors - Standalone
JLR (Adj for R&D capitalization)
HV Axles
HV Transmission
Tata Technologies
Tata Daewoo
Total EV
Less: Net Debt (Ex FCCB & TMFL)
Add: Other Investments
Tata Motors Finance
Other Associates/JVs
Tata Sons
Total Equity Value
Fair Value (INR/Sh) - Ord Sh
Upside (%)
Fair Value (INR/Sh) - DVR
Upside (%)
EV/EBITDA
EV/EBITDA
EV/EBITDA
EV/EBITDA
EV/EBITDA
EV/EBITDA
8
4
4
4
4
4
FY13E
342
588
9
8
10
10
968
52
25
9
59
1,008
303
13.4
182
13.2
FY14E
433
673
10
9
12
13
1,150
12
FY15E
490
736
12
11
13
14
1,275
(29)
We value JLR business at
~15% discount to BMW's
EV/EBITDA, whereas
domestic business is
valued at 10% premium
to Ashok Leyland's LPA
EV/EBITDA
P/BV
1
Carrying Cost
20% discount to mkt value
Fully Diluted
@ 40% discount
27
30
10
11
59
59
1,234
1,403
371
422
38.8
57.8
223
253
38.6
57.6
Source: MOSL
Valuing TTMT's dometic business at 10% premium to Ashok Leyland's average EV/EBITDA
Ashok Leyland's long
period average
EV/EBITDA is 7.3x
Source: MOSL
1 October 2012
17

Tata Motors
JLR: FY14 Volumes Sensitivity Analysis
Scenario
Base Case
Volumes (units)
396,087
Monthly run-rate (units)
33,007
Growth (%)
9.2
JLR (GBP m)
Sales
17,492
EBITDA
2,619
EBITDA Margins (%)
15.0
EBITDA (adj for R&D cap)
1,969
Adj EBITDA Margins (%)
11.3
PBT
1,913
PAT
1,358
Growth (%)
-8.3
Normalized PAT
531
Growth (%)
-46.9
CFO
2,354
FCF
104
TTMT Net Auto Debt (INR b)
45.1
TTMT Consol EPS (INR)
41.3
TTMT Normal Consol EPS (INR)
19.5
TTMT SOTP TP (INR/Share)
370
Upside (%)
38.8
A
326,304
27,192
-10.0
14,410
1,791
12.4
1,142
7.9
1,085
771
-48.0
-56
-105.6
1,526
-724
125.0
23.2
1.6
284
7.0
B
344,432
28,703
-5.0
15,210
2,006
13.2
1,357
8.9
1,300
923
-37.7
96
-90.4
1,741
-509
106.7
27.1
5.5
307
15.2
C
362,560
30,213
0.0
D
380,688
31,724
5.0
E
416,944
34,745
15.0
In worst case scenario of
~10% volume de-growth
in FY14 JLR volumes,
TTMT's SOTP is INR286
16,011
16,811
18,413
2,221
2,436
2,866
13.9
14.5
15.6
1,572
1,787
2,217
9.8
10.6
12.0
1,515
1,730
2,160
1,076
1,229
1,534
-27.4
-17.0
3.6
249
402
707
-75.1
-59.8
-29.3
1,956
2,171
2,601
-294
-79
351
88.3
69.9
33.2
31.0
35.0
42.8
9.5
13.4
21.2
329
351
395
23.5
31.8
48.3
Source: Company, MOSL
Benchmarking JLR's valuations to BMW's implied valuations for non-NBFC
business
For valuing JLR, we benchmark JLR to BMW's implied core business (ex NBFC). To
determine BMW's implied valuations for the core business, we strip-off the value
of the NBFC business (@1x P/BV) from market cap, and add net debt (ex NBFC) to
determine the implied EV. Similarly, for EBITDA, we add back depreciation of the
core business (ex NBFC) to core EBIT (ex NBFC). We get implied EV/EBITDA for BMW's
core business (ex NBFC) at 4.8x CY12E and 4.6x CY13E. We value JLR at an EV of 4x
FY14E EBITDA (~15% discount to BMW), at which the implied FY14E EV/Sales is 0.45x.
BMW: Valuing core business (excl NBFC)
EUR m
CY10 *
Total Market Cap
29,812
Less: NBFC @ 1x P/BV
5,216
MCap for non-NBFC business
24,596
Add: Net Debt (Non-NBFC)
28,634
EV for Non-NBFC business
53,230
EBITDA (excl NBFC)
7,502
Implied EV/EBITDA (for core business)
7.1
* based on average stock price during the year
CY11 *
38,076
7,169
30,907
22,555
53,462
9,823
5.4
CY12E
CY13E
39,464
39,464
8,574
9,969
30,890
29,495
22,555
22,555
53,445
52,050
11,066
11,415
4.8
4.6
Source: BMW, Company, MOSL
BMW's implied valuation
for core business
(excluding NBFC
business) is ~4.6x CY13
1 October 2012
18

Tata Motors
JLR: Financials
Income Statement
Y/E March
Total Income
Change (%)
Expenditure
EBITDA
% of Net Sales
Normalized EBITDA
% of Net Sales
Depreciation
EBIT
Interest
PBT
Tax
Reported PAT
Net Profit
Normalized PAT *
E: MOSL Estimates; * Normalized for
2010
2011
2012
6,527
9,871
13,512
31.1
51.2
36.9
6,635
8,900
12,236
-108
971
1,276
-1.7
9.8
9.4
-429
516
646
-6.6%
5.2%
4.8%
317
397
465
-425
574
811
50
23
69
-475
551
742
28
79
26.0
-503
472
716
-503
472
716
-824
17
86
capitalized R&D expenses
2013E
15,697
16.2
14,323
1,374
8.8
639
4.1%
576
798
54
743
474.3
269
269
-466
(GBP Million)
2014E
17,492
11.4
15,877
1,615
9.2
788
4.5%
661
954
45
909
555
354
354
-473
Balance Sheet
Y/E March
Share Capital
Reserves
Net Worth
Loans
Deferred Tax
Capital Employed
Application of Funds
Gross Fixed Assets
Net Fixed Assets
Capital WIP
Investments
Curr.Assets
Inventory
Sundry Debtors
Cash & Bank Balances
Others
Current Liab. & Prov.
Sundry Creditors
Provisions
Net Current Assets
Appl. of Funds
E: MOSL Estimates
2010
645
-1,107
-463
3,030
-44
2,524
3,345
2,884
29
94
2,570
995
669
680
226
2,576
1,931
644
-5
3,001
2011
1,501
-25
1,475
1,382
-111
2,746
4,096
3,292
83
130
3,044
1,156
567
1,028
293
3,224
2,385
839
-180
3,326
2012
1,501
1,424
2,924
1,974
-473
4,425
5,505
4,251
136
291
5,046
1,497
662
2,430
457
4,236
3,285
951
811
5,489
(GBP Million)
2013E
1,501
2,585
4,085
1,677
-473
5,289
6,984
5,153
500
291
5,024
1,720
774
2,014
516
4,821
3,870
951
203
6,147
2014E
1,501
3,943
5,444
1,379
-473
6,350
9,057
6,565
500
291
5,116
1,917
863
1,762
575
5,264
4,313
951
-148
7,208
1 October 2012
19

Tata Motors
Tata Motors: Financials and Valuation
Income Statement (Consolidated)
Y/E March
2010
Total Income
925,193
Change (%)
30.5
Expenditure
839,051
EBITDA
86,142
% of Net Sales
9.3
Depreciation
38,871
EBIT
47,270
Product Dev. Exp.
4,982
Interest
22,397
Other Income
416
EO Exp/(Inc)
-14,075
Forex Gain/ (Loss)
-845
PBT
35,226
Tax
10,058
Effective Rate (%)
28.6
Reported PAT
25,169
Minority Interest
-303
Share of profit of associate
845
Net Profit
25,711
Adj. PAT
15,051
Change (%)
-171.2
*Normalized for capitalized expenses
2011
1,221,279
32.0
1,043,129
178,150
14.6
46,555
131,595
9,976
23,853
4,295
0
-2,310
104,372
12,164
11.7
92,208
-485
1,014
92,736
90,695
502.6
2012
1,656,545
35.6
1,419,540
237,005
14.3
56,254
180,751
13,892
29,822
6,618
1,774
6,541
135,339
-400
-0.3
135,739
-823
249
135,165
125,568
38.5
2013E
1,971,042
19.0
1,700,346
270,696
13.7
71,528
199,168
15,315
30,132
6,836
4,405
0
156,152
48,010
30.7
108,142
-671
700
108,171
111,222
-11.4
(INR Million)
2014E
2,180,419
10.6
1,871,798
308,621
14.2
79,841
228,780
16,871
26,530
7,011
0
0
192,390
55,781
29.0
136,609
-767
852
136,693
136,693
22.9
Balance Sheet (Consolidated)
Y/E March
Share Capital
Reserves
Net Worth
Loans
Deferred Tax
Capital Employed
Gross Fixed Assets
Less: Depreciation
Net Fixed Assets
Capital WIP
Goodwill
Investments
Curr.Assets
Inventory
Sundry Debtors
Cash & Bank Bal.
Loans & Advances
Current Liab. & Prov.
Sundry Creditors
Other Liabilities
Net Current Assets
Appl. of Funds
E: MOSL Estimates
1 October 2012
2010
5,706
76,359
82,065
351,924
11,536
447,660
648,518
344,135
304,383
80,680
34,229
22,191
425,296
113,120
71,912
87,433
152,807
417,208
221,875
118,898
8,088
447,660
2011
6,377
185,338
191,715
303,622
14,638
512,440
715,231
396,987
318,245
117,289
35,848
25,443
506,995
140,705
65,257
114,096
178,422
491,378
279,031
112,776
15,616
512,440
2012
6,348
320,638
326,985
387,041
-23,743
693,354
971,112
453,241
517,872
50,000
40,937
89,177
705,933
182,160
82,368
182,381
249,952
710,564
366,863
215,284
-4,632
693,354
2013E
6,559
411,542
418,101
362,878
-23,743
760,979
1,146,112
524,769
621,344
60,000
40,937
89,878
742,637
232,205
124,203
94,258
291,952
793,817
415,809
216,005
-51,180
760,979
(INR Million)
2014E
6,559
529,051
535,610
354,563
-23,743
870,940
1,336,112
604,610
731,502
70,000
40,937
90,729
815,912
256,871
137,396
87,672
333,952
878,141
459,979
238,950
-62,230
870,940
20

Tata Motors
Tata Motors: Financials and Valuation
Ratios (Consolidated)
Y/E March
Basic (INR)
EPS
EPS Fully Diluted
Normalized EPS ^
EPS Growth (%)
Cash EPS
Book Value (Rs/Share)
DPS
Payout (Incl. Div. Tax) %
Valuation (x)
Consolidated P/E
Cash P/E
EV/EBITDA
EV/Sales
Price to Book Value
Dividend Yield (%)
Profitability Ratios (%)
RoE
RoCE
Turnover Ratios
Debtors (Days)
Inventory (Days)
Creditors (Days)
Asset Turnover (x)
Leverage Ratio
Debt/Equity (x)
18.3
10.7
28
45
88
2.1
4.3
47.3
26.5
20
42
83
2.4
1.6
2010
5.3
4.5
-4.3
-79.9
18.9
28.8
1.2
65.9
2011
28.4
27.3
15.4
-461.6
43.0
60.1
4.0
16.2
2012
39.6
37.8
22.2
43.7
57.3
103.0
4.0
11.8
7.1
4.7
4.4
0.6
2.6
1.5
38.4
27.0
18
40
81
2.4
1.2
2013E
33.9
33.5
14.2
-35.8
55.7
127.5
4.5
15.5
8.0
4.8
3.7
0.5
2.0
1.7
26.6
27.1
23
43
77
2.6
0.9
2014E
41.7
41.1
19.3
35.7
66.0
163.3
5.0
14.0
6.5
4.0
3.1
0.4
1.6
1.9
25.5
27.1
23
43
77
2.5
0.7
Cash Flow Statement (Consolidated)
Y/E March
OP/(Loss) before Tax
Int/Div. Received
Depreciation
Direct Taxes Paid
(Inc)/Dec in WC
Other Items
Extra-ordinary Items
CF after EO Items
(Inc)/Dec in FA+CWIP
(Pur)/Sale of Invest.
CF from Inv Activity
Issue of Shares
Inc/(Dec) in Debt
Interest Paid
Dividends Paid
CF from Fin Activity
Inc/(Dec) in Cash
Add: Opening Bal.
Closing Balance
E: MOSL Estimates
1 October 2012
2010
47,270
23,055
38,826
-12,292
26,009
-28,408
-4,489
89,971
-84,532
9,202
-75,331
15,167
45,300
-28,553
-3,496
28,417
43,058
41,213
87,433
2011
131,595
19,781
46,510
-13,912
-40,484
-28,651
-7,773
107,066
-81,128
10,471
-70,657
31,561
-10,688
-24,691
-10,195
-14,013
22,397
87,433
109,830
2012
180,751
6,618
56,254
-37,980
88,534
-18,951
-8,315
266,910
-188,592
-63,735
-252,327
14,958
83,419
-29,822
-14,853
53,702
68,285
109,830
178,115
2013E
199,168
6,836
71,528
-48,010
-41,576
-14,614
-4,405
168,927
-185,000
-700
-185,700
211
-24,162
-30,132
-17,266
-71,350
-88,123
178,115
89,992
(INR Million)
2014E
228,780
7,011
79,841
-55,781
4,465
-16,019
0
248,296
-200,000
-852
-200,852
0
-8,315
-26,530
-19,185
-54,030
-6,585
89,992
83,406
21

Disclosures
This report is for personal information of the authorized recipient and does not construe to be any investment, legal or taxation advice to you. This research report does not constitute an offer, invitation or inducement
to invest in securities or other investments and Motilal Oswal Securities Limited (hereinafter referred as MOSt) is not soliciting any action based upon it. This report is not for public distribution and has been
furnished to you solely for your information and should not be reproduced or redistributed to any other person in any form.
Unauthorized disclosure, use, dissemination or copying (either whole or partial) of this information, is prohibited. The person accessing this information specifically agrees to exempt MOSt or any of its affiliates
or employees from, any and all responsibility/liability arising from such misuse and agrees not to hold MOSt or any of its affiliates or employees responsible for any such misuse and further agrees to hold MOSt
or any of its affiliates or employees free and harmless from all losses, costs, damages, expenses that may be suffered by the person accessing this information due to any errors and delays.
The information contained herein is based on publicly available data or other sources believed to be reliable. While we would endeavour to update the information herein on reasonable basis, MOSt and/or its
affiliates are under no obligation to update the information. Also there may be regulatory, compliance, or other reasons that may prevent MOSt and/or its affiliates from doing so. MOSt or any of its affiliates or
employees shall not be in any way responsible and liable for any loss or damage that may arise to any person from any inadvertent error in the information contained in this report . MOSt or any of its affiliates
or employees do not provide, at any time, any express or implied warranty of any kind, regarding any matter pertaining to this report, including without limitation the implied warranties of merchantability, fitness
for a particular purpose, and non-infringement. The recipients of this report should rely on their own investigations.
This report is intended for distribution to institutional investors. Recipients who are not institutional investors should seek advice of their independent financial advisor prior to taking any investment decision
based on this report or for any necessary explanation of its contents.
MOSt and/or its affiliates and/or employees may have interests/positions, financial or otherwise in the securities mentioned in this report. To enhance transparency, MOSt has incorporated a Disclosure of Interest
Statement in this document. This should, however, not be treated as endorsement of the views expressed in the report.
Disclosure of Interest Statement
1. Analyst ownership of the stock
2. Group/Directors ownership of the stock
3. Broking relationship with company covered
4. Investment Banking relationship with company covered
Tata Motors
No
No
No
No
Analyst Certification
The views expressed in this research report accurately reflect the personal views of the analyst(s) about the subject securities or issues, and no part of the compensation of the research analyst(s) was, is, or
will be directly or indirectly related to the specific recommendations and views expressed by research analyst(s) in this report. The research analysts, strategists, or research associates principally responsible
for preparation of MOSt research receive compensation based upon various factors, including quality of research, investor client feedback, stock picking, competitive factors and firm revenues.
Regional Disclosures (outside India)
This report is not directed or intended for distribution to or use by any person or entity resident in a state, country or any jurisdiction, where such distribution, publication, availability or use would be contrary to
law, regulation or which would subject MOSt & its group companies to registration or licensing requirements within such jurisdictions.
For U.K.
This report is intended for distribution only to persons having professional experience in matters relating to investments as described in Article 19 of the Financial Services and Markets Act 2000 (Financial
Promotion) Order 2005 (referred to as "investment professionals"). This document must not be acted on or relied on by persons who are not investment professionals. Any investment or investment activity to
which this document relates is only available to investment professionals and will be engaged in only with such persons.
For U.S.
MOSt is not a registered broker-dealer in the United States (U.S.) and, therefore, is not subject to U.S. rules. In reliance on the exemption from registration provided by Rule 15a-6 of the U.S. Securities Exchange
Act of 1934, as amended (the "Exchange Act") and interpretations thereof by the U.S. Securities and Exchange Commission ("SEC") in order to conduct business with Institutional Investors based in the U.S.,
Motilal Oswal has entered into a chaperoning agreement with a U.S. registered broker-dealer, Marco Polo Securities Inc. ("Marco Polo"). Any business interaction pursuant to this report will have to be executed
within the provisions of this Chaperoning agreement.
This report is intended for distribution only to "Major Institutional Investors" as defined by Rule 15a-6(b)(4) of the Exchange Act and interpretations thereof by SEC (henceforth referred to as "major institutional
investors"). This document must not be acted on or relied on by persons who are not major institutional investors. Any investment or investment activity to which this document relates is only available to major
institutional investors and will be engaged in only with major institutional investors.
The Research Analysts contributing to the report may not be registered /qualified as research analyst with FINRA. Such research analyst may not be associated persons of the U.S. registered broker-dealer, Marco
Polo and therefore, may not be subject to NASD rule 2711 and NYSE Rule 472 restrictions on communication with a subject company, public appearances and trading securities held by a research analyst account.
Motilal Oswal Securities Ltd
Motilal Oswal Tower, Level 9, Sayani Road, Prabhadevi, Mumbai 400 025
Phone: +91 22 3982 5500 E-mail: reports@motilaloswal.com