20 October 2012
2QFY13 Results Update | Sector: Consumer
ITC
BSE SENSEX
S&P CNX
18,682
Bloomberg
Equity Shares (m)
52-Week Range (INR)
1,6,12 Rel. Perf. (%)
M.Cap. (INR b)
M.Cap. (USD b)
5,684
ITC IN
7,738.1
299/189
16/14/34
2,306.0
42.8
CMP: INR298
TP: INR320
Buy
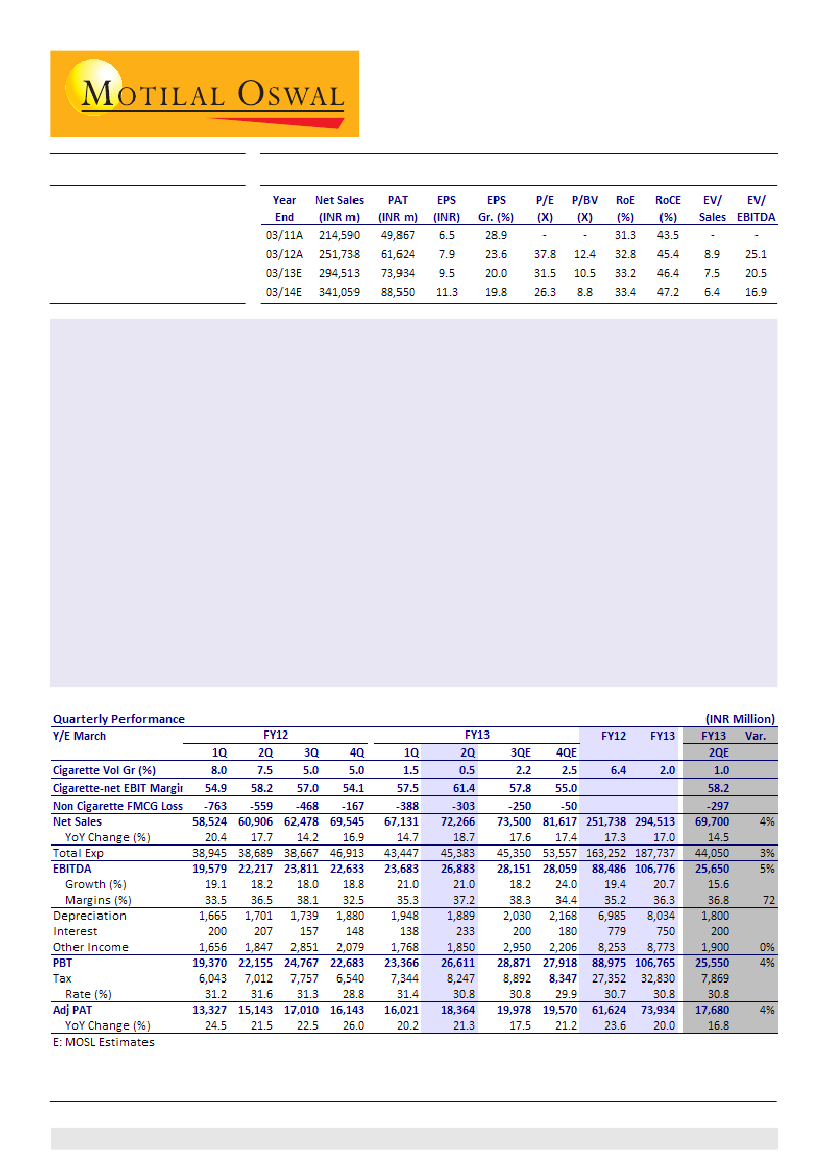
ITC’s 2QFY13 results exceeded expectations, with adjusted PAT growing 21.3% to INR18.3m (v/s our estimate
of INR17.6b). ITC has posted its 13th consecutive quarter of 20%+ PAT growth, demonstrating strong earnings
visibility with acceleration in earnings growth trajectory from 15%+ to 20%.
Cigarette volumes remained flat despite ~17% price hike YoY, underscoring ITC’s pricing power. We believe ITC
is gaining share from VST and GPI.
EBITDA margin expanded 73bp to 37.2% on account of 21% EBIT growth in Cigarettes, and reduction in staff
costs and other expenditure.
In line with our expectations, non-Cigarette FMCG losses declined to INR303m. Revenue grew 26%, led by
healthy volume growth and strong traction in Packaged Foods.
Notwithstanding the steep excise duty increase, ITC’s performance in Cigarettes remains robust. ITC has once
again delivered 20%+ EBIT growth in Cigarettes, with 320bp EBIT margin expansion.
We upgrade our EPS estimates for FY13 and FY14 by 2% and 4%, respectively to incorporate the higher than
expected sales and PAT for 2QFY13. We maintain our 2% Cigarette volume growth estimate for FY13, as we
expect further pick-up in the 64mm segment for ITC. We now forecast 20% PAT CAGR over FY12-14.
The stock trades at 31.5x FY13E and 26.3x FY14E EPS. Maintain
Buy
with a revised target price of INR320 (28x
FY14E EPS). We expect ITC to sustain premium valuations owing to strong earnings visibility, acceleration in
earnings growth trajectory to 20% and Cigarette volume outperformance v/s the industry.
Gautam Duggad
(Gautam.Duggad@MotilalOswal.com); +9122 3982 5404
Sreekanth P V S
(Sreekanth.P@MotilalOswal.com); +9122 3029 5120
Investors are advised to refer through disclosures made at the end of the Research Report.
1

ITC
Sales up 18.8% on healthy growth in Cigarettes, FMCG
2QFY13 revenue grew 18.8% to INR72.2b (v/s our estimate of INR69.7b), led by an
impressive 26% sales growth in FMCG and 15% increase in Cigarettes. Cigarette
volumes remained flat, while FMCG losses declined 46% to INR303m (1QFY13 loss
was INR388m, while 2QFY12 loss was INR559m). We continue to model 4QFY13
breakeven for non-Cigarette FMCG.
EBITDA posted robust 21.1% YoY growth to INR26.8b (v/s our estimate of INR25.6b),
while margins expanded 73bp to 37.2% (v/s our estimate of 36.8%).
Adjusted PAT grew 21.3% to INR18.3b (v/s our estimate of INR17.6b) despite
marginal increase in other income to INR1.85b (up 2%).
Segmental performance: Strong margin expansion in Cigarettes and FMCG
1QFY12
Sales (INR m)
Cigarettes
FMCG - Others
Hotels
Agri business
Paper and packaging
EBIT (INR m)
Cigarettes
FMCG - Others
Hotels
Agri business
Paper and packaging
EBIT growth (YoY)
Cigarettes
FMCG - Others
Hotels
Agri business
Paper and packaging
EBIT Margin (%)
Cigarettes
FMCG - Others
Hotels
Agri business
Paper and packaging
28,736
11,978
2,305
17,071
9,596
15,767
-763
513
1,571
2,270
20.8
-14.5
33.2
27.7
20.4
54.9
-6.4
22.3
9.2
23.7
2QFY12
29,681
13,407
2,111
14,345
10,054
17,289
-559
434
2,388
2,897
18.6
-16.4
9.0
15.0
17.9
58.2
-4.2
20.6
16.6
28.8
3QFY12
32,328
13,707
2,787
11,394
9,784
18,442
-468
1,017
1,417
2,243
20.3
-36.4
14.8
9.7
17.2
57.0
-3.4
36.5
12.4
22.9
4QFY12
32,499
16,165
2,858
14,142
9,799
17,579
-167
829
1,056
1,958
19.5
-75.4
-16.8
5.8
1.1
54.1
-1.0
29.0
7.5
20.0
1QFY13
33,042
14,731
2,324
16,914
10,361
18,998
-388
262
1,714
2,647
20.5
-49.1
-48.9
9.1
16.6
2QFY13
33,852
16,908
2,170
20,239
10,590
20,802
-303
153
2,597
2,825
20.3
-45.8
-64.8
8.8
-2.5
% Gr.
14.0
26.1
2.8
41.1
5.3
20.3
-45.8
-64.8
8.8
-2.5
57.5
61.4
3.2
-2.6
-1.8
2.4
11.3
7.1
-13.5
10.1
12.8
-3.8
25.5
26.7
-2.1
Source: Company, MOSL
Cigarette volumes flat; price increases, improved mix enable 320bp margin
expansion
2QFY13 Cigarette volumes remained flat while net sales grew 15% to INR33b, led
by ~17% realization growth. Flat volumes despite 17% price hike in Cigarettes
portfolio underscores ITC’s dominant market standing once again. We believe ITC
has gained market share during the quarter (VST posted ~15% volume decline in
2Q).
EBIT margin expanded 320bp to 61.4% on the back of price increases (to ward off
hike in central excise and state VAT duties) and continued mix improvement.
ITC has received encouraging response in its 64mm foray and is expanding
presence across geographies in this segment. We expect ITC to gain further share,
as it goes national with its 64mm offerings. We do not see dilution in margins
20 October 2012
2

ITC
owing to 64mm cigarettes, as gross margins do not differ materially in the 64mm
and 69mm segments (excise duties for the 64mm segment are 40% lower compared
to the 69mm segment).
We maintain our 2% volume growth estimate for Cigarettes in FY13.
Cigarettes: 2Q volumes flat despite 17% price hike; margins expand 320bp aided by better mix
Source: Company, MOSL
FMCG: Strong sales growth of 26%; EBIT losses decline 46% to INR303m
FMCG sales grew 26% to INR16.9b and EBIT losses declined 46% to INR303m.
Incremental EBIT margins were higher at 7.4%, indicating higher growth in
Packaged Foods and Education/Stationery segments, which have already broken
even.
Packaged Foods posted strong sales growth across categories. Growth was led by
Biscuits (Sunfeast performed well, with products like
Dream Cream, Dark Fantasy
Choco Fills),
Atta (Aashirwad growing in volumes and realizations, with
Multigrain
and
Select)
and
Bingo.
We believe the premiumization strategy in biscuits is driving
margins for ITC’s food products and also garnering higher market share (likely
gaining shares from Britannia, in our view).
Personal Care traction remains strong, especially in Soaps. New launches in Skin
Care and increase in distribution footprint are creating new growth drivers. ITC
launched
Exotic Dream Transparent Gel Bar
in some markets under the
Fiama Di
Wills
brand.
EBIT losses declined 46%. We believe ITC’s non-Cigarette FMCG division is on
track to break even in 4QFY13.
FMCG: 26% revenue growth; losses decline to INR303m
EBIT margins at 7.4% on incremental sales in FMCG
ITC’s market share in Soaps
Source: Company, MOSL
20 October 2012
3

ITC
ITC's market share in soaps (%)
Source: Company, MOSL
Agri business: Sales growth robust on account of wheat exports
Agri business sales were up 41% to INR20.2b while EBIT grew 9% to INR2.5b; margins
contracted 380bp to 12.8%. EBIT margin contraction in the division has been due
to lower realizations.
The leaf tobacco threshing facility in Mysore is fully operational and ITC has started
benefiting in terms of better supply chain and quality.
Despite volatility in its profitability due to seasonality, ITC has been able to
maintain structural EBIT margins in the Agri business at 11-12%.
Agri business: Wheat exports drive revenue, lower realizations pull down margins
Source: Company, MOSL
Hotels business: Sales growth flat; EBIT margins record steep fall of 1,350bp
Hotel revenues disappointed, with flat sales at INR2.1b, largely due to weak global
economic environment and higher supply of room inventory. EBIT margin
contracted 1,350bp to 11.3%. Commencement of Chennai property increased start-
up costs, resulting in sharp margin contraction.
Lower foreign tourist arrivals due to a weak global economic situation led to lower
demand; increasing supply kept occupancies and average room rates flat, which
impacted performance in 2Q.
ITC started operations of its Chennai property, while Kolkata and Gurgaon
properties are under construction and are progressing as per plan.
We expect Hotels performance to remain sedate. Recovery, if any in the industry,
is only expected to be gradual.
20 October 2012
4

ITC
Hotels: Flat revenue YoY; steep margin decline
Source: Company, MOSL
Paper & Paperboard: 5.3% sales growth; 213bp margin contraction
Paper & Paperboard sales grew 5.3% YoY to INR10.6b while EBIT decreased 2.5%
YoY to INR2.8b.
Revenue growth was driven by higher realizations and improved product mix.
However, increase in the price of wood dragged margins by 213bp to 26.7%.
Expansion:
ITC is currently expanding its Bhadrachalam plant, and a new carton
line at Haridwar is expected to commence by the end of FY13.
Paper & Paperboard: Revenue growth modest; margins contract 213bp
Source: Company, MOSL
Valuation and view: Raise estimates by 2-4%; maintain Buy with revised TP
of INR320
ITC’s flawless performance in Cigarettes, notwithstanding steep excise and VAT
duty hikes continue to enhance medium-term earnings visibility, in our view. Flat
volumes despite 17% price increase reiterate ITC’s pricing power in Cigarettes.
Volume uptick from the 64mm segment will be a strong catalyst for FY13 volumes,
in our view.
Cigarette EBIT growth trajectory has moved up from 16-17% to 20%, driving earnings
visibility for ITC.
We upgrade our EPS estimates for FY13 and FY14 by 2% and 4%, respectively, to
incorporate higher than expected sales and PAT for 2QFY13. We maintain our 2%
Cigarette volume growth estimate for FY13, as we expect further pick-up in the
64mm segment for ITC. We now forecast 20% PAT CAGR over FY12-14.
20 October 2012
5

ITC
The stock trades at 31.5x FY13E and 26.3x FY14E EPS. Maintain
Buy
with a revised
target price of INR320 (28x FY14E EPS). We expect ITC to sustain premium valuations
owing to strong earnings visibility, acceleration in earnings growth trajectory to
20% and Cigarette volume outperformance v/s the industry.
Change in Estimates (INR m)
Old
FY13E
Sales
EBITDA
PAT
291,436
104,652
72,463
FY14E
334,890
122,653
85,226
FY13E
294,513
106,776
73,934
New
FY14E
341,059
127,454
88,550
Change (%)
FY13E
FY14E
1.1
2.0
2.0
1.8
3.9
3.9
Source: MOSL
20 October 2012
6

ITC
ITC: an investment profile
Company description
Recent developments
ITC is an associate of BAT (British American Tobacco)
ITC undertook a price hike of ~7% in the Gold Flake
controls more than 2/3rd of the cigarette market in India.
Filter category to offset UP VAT rate hike in
ITC has emerged as a diversified conglomerate with
cigarettes.
leading presence in Paperboards, Hotels and Processed
ITC launched
Exotic Dream Transparent Gel Bar
in
foods. E-Choupal, the agri rural initiative of the company
some markets under the
Fiama Di Wills
brand.
has been widely appreciated for its foresight in
Valuation and view
harnessing the potential in the rural market.
We upgrade our EPS estimates for FY13 and FY14 by
2% and 4%, respectively, to incorporate higher than
Key investment arguments
expected sales and PAT for 2QFY13.
Strong pricing power due to dominant market share
The stock trades at 31.5x FY13E and 26.3x FY14E EPS.
in the cigarettes.
Maintain
Buy
with a revised target price of INR320
Paperboard businesses has achieved self sustenance
(28x FY14E EPS).
levels.
Hotel business on a steady recovery.
Sector view
Key investment risks
Increase in excise in the forthcoming budget could
be a risk factor for the volume growth assumption in
cigarette.
Higher than expected losses in New FMCG business
will impact profitability.
We are positive on long term demand growth in
cigarette business due to rising affordability and
huge demand potential in small towns and rural
areas.
Non Cigarette businesses like Hotels, paper can fund
their own growth; demand potential continues to
be strong.
Comparative valuations
P/E (x)
EV/EBITDA (x)
EV/Sales (x)
P/BV (x)
FY13E
FY14E
FY13E
FY14E
FY13E
FY14E
FY13E
FY14E
ITC
31.5
26.3
20.5
16.9
7.5
6.4
10.5
8.8
HUL
36.5
31.4
28.4
24.3
4.5
4.0
26.3
19.9
Nestle
40.9
34.6
24.8
20.5
5.5
4.5
25.7
19.2
EPS: MOSL forecast v/s consensus (INR)
MOSL
Forecast
9.5
11.3
Consensus
Forecast
9.4
11.0
Variation
(%)
1.4
2.3
FY13
FY14
Target price and recommendation
Current
Price (INR)
298
Target
Price (INR)
320
Upside
(%)
7.4
Reco.
Buy
Stock performance (1 year)
Shareholding pattern (%)
Sep-12
Promoter
Domestic Inst
Foreign
Others
0.0
33.8
49.9
16.3
Jun-12
0.0
34.1
49.4
16.4
Sep-11
0.0
35.2
47.2
17.6
20 October 2012
7

ITC
Financials and Valuation
20 October 2012
8

ITC
N O T E S
20 October 2012
9

Disclosures
This report is for personal information of the authorized recipient and does not construe to be any investment, legal or taxation advice to you. This research report does not constitute an offer, invitation or inducement
to invest in securities or other investments and Motilal Oswal Securities Limited (hereinafter referred as MOSt) is not soliciting any action based upon it. This report is not for public distribution and has been
furnished to you solely for your information and should not be reproduced or redistributed to any other person in any form.
Unauthorized disclosure, use, dissemination or copying (either whole or partial) of this information, is prohibited. The person accessing this information specifically agrees to exempt MOSt or any of its affiliates
or employees from, any and all responsibility/liability arising from such misuse and agrees not to hold MOSt or any of its affiliates or employees responsible for any such misuse and further agrees to hold MOSt
or any of its affiliates or employees free and harmless from all losses, costs, damages, expenses that may be suffered by the person accessing this information due to any errors and delays.
The information contained herein is based on publicly available data or other sources believed to be reliable. While we would endeavour to update the information herein on reasonable basis, MOSt and/or its
affiliates are under no obligation to update the information. Also there may be regulatory, compliance, or other reasons that may prevent MOSt and/or its affiliates from doing so. MOSt or any of its affiliates or
employees shall not be in any way responsible and liable for any loss or damage that may arise to any person from any inadvertent error in the information contained in this report . MOSt or any of its affiliates
or employees do not provide, at any time, any express or implied warranty of any kind, regarding any matter pertaining to this report, including without limitation the implied warranties of merchantability, fitness
for a particular purpose, and non-infringement. The recipients of this report should rely on their own investigations.
This report is intended for distribution to institutional investors. Recipients who are not institutional investors should seek advice of their independent financial advisor prior to taking any investment decision
based on this report or for any necessary explanation of its contents.
MOSt and/or its affiliates and/or employees may have interests/positions, financial or otherwise in the securities mentioned in this report. To enhance transparency, MOSt has incorporated a Disclosure of Interest
Statement in this document. This should, however, not be treated as endorsement of the views expressed in the report.
Disclosure of Interest Statement
1. Analyst ownership of the stock
2. Group/Directors ownership of the stock
3. Broking relationship with company covered
4. Investment Banking relationship with company covered
ITC
No
No
No
No
Analyst Certification
The views expressed in this research report accurately reflect the personal views of the analyst(s) about the subject securities or issues, and no part of the compensation of the research analyst(s) was, is, or
will be directly or indirectly related to the specific recommendations and views expressed by research analyst(s) in this report. The research analysts, strategists, or research associates principally responsible
for preparation of MOSt research receive compensation based upon various factors, including quality of research, investor client feedback, stock picking, competitive factors and firm revenues.
Regional Disclosures (outside India)
This report is not directed or intended for distribution to or use by any person or entity resident in a state, country or any jurisdiction, where such distribution, publication, availability or use would be contrary to
law, regulation or which would subject MOSt & its group companies to registration or licensing requirements within such jurisdictions.
For U.K.
This report is intended for distribution only to persons having professional experience in matters relating to investments as described in Article 19 of the Financial Services and Markets Act 2000 (Financial
Promotion) Order 2005 (referred to as "investment professionals"). This document must not be acted on or relied on by persons who are not investment professionals. Any investment or investment activity to
which this document relates is only available to investment professionals and will be engaged in only with such persons.
For U.S.
MOSt is not a registered broker-dealer in the United States (U.S.) and, therefore, is not subject to U.S. rules. In reliance on the exemption from registration provided by Rule 15a-6 of the U.S. Securities Exchange
Act of 1934, as amended (the "Exchange Act") and interpretations thereof by the U.S. Securities and Exchange Commission ("SEC") in order to conduct business with Institutional Investors based in the U.S.,
Motilal Oswal has entered into a chaperoning agreement with a U.S. registered broker-dealer, Marco Polo Securities Inc. ("Marco Polo"). Any business interaction pursuant to this report will have to be executed
within the provisions of this Chaperoning agreement.
This report is intended for distribution only to "Major Institutional Investors" as defined by Rule 15a-6(b)(4) of the Exchange Act and interpretations thereof by SEC (henceforth referred to as "major institutional
investors"). This document must not be acted on or relied on by persons who are not major institutional investors. Any investment or investment activity to which this document relates is only available to major
institutional investors and will be engaged in only with major institutional investors.
The Research Analysts contributing to the report may not be registered /qualified as research analyst with FINRA. Such research analyst may not be associated persons of the U.S. registered broker-dealer, Marco
Polo and therefore, may not be subject to NASD rule 2711 and NYSE Rule 472 restrictions on communication with a subject company, public appearances and trading securities held by a research analyst account.
Motilal Oswal Securities Ltd
Motilal Oswal Tower, Level 9, Sayani Road, Prabhadevi, Mumbai 400 025
Phone: +91 22 3982 5500 E-mail: reports@motilaloswal.com