22 October 2012
2QFY13 Results Update | Sector: Automobiles
Bajaj Auto
BSE SENSEX
S&P CNX
18,682
Bloomberg
Equity Shares (m)
1,6,12 Rel.Perf.(%)
M.Cap. (INR b)
M.Cap. (USD b)
5,684
BJAUT IN
289.4
0/-4/-1
512.2
9.5
CMP: INR1,770
TP: INR1,825
Buy
52-Week Range (INR) 1,850/1,410
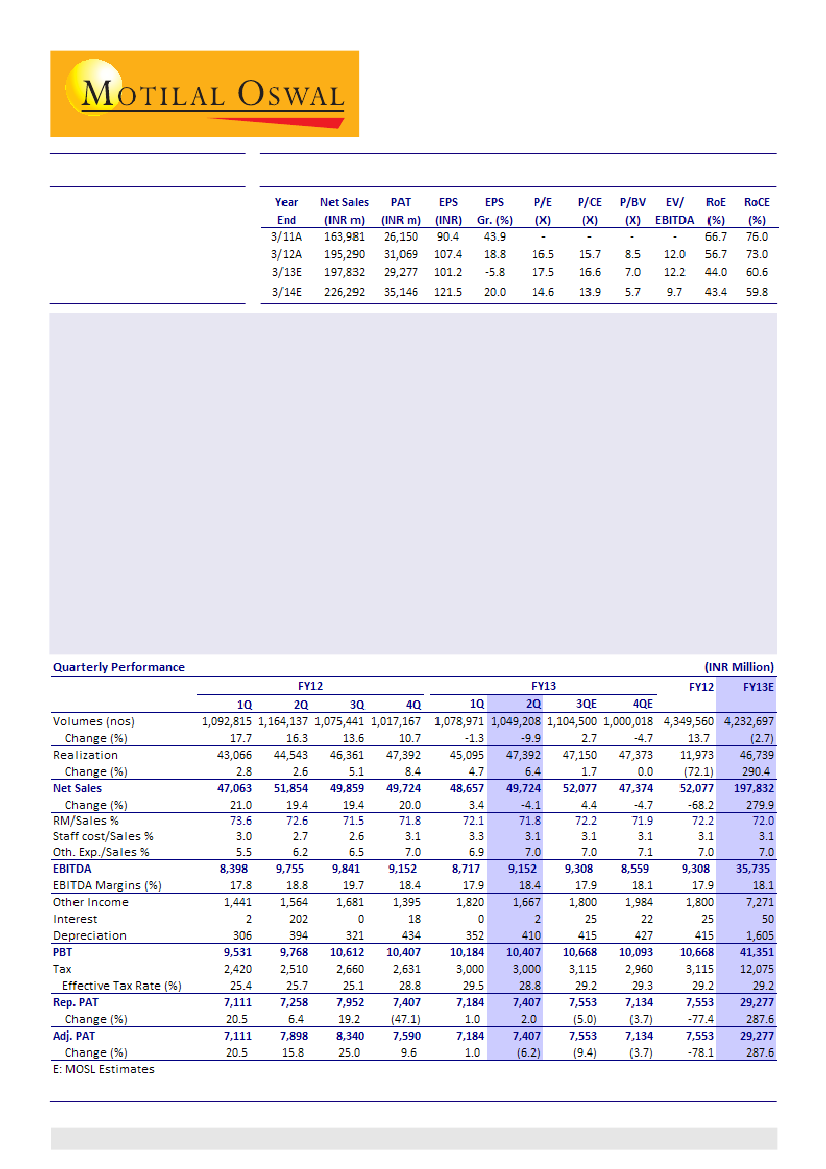
Bajaj Auto (BJAUT) posted better than expected results for 2QFY13, with EBITDA margin at 18.4% (v/s our estimate
of 17.8%) and adjusted PAT at INR7.4 (v/s our estimate INR7.05b), driven by higher domestic realizations (up 6.4%
YoY, 5.1% QoQ) on mix improvement .
Earnings call highlights:
(1) Domestic demand:
Flat/marginally positive during the first five days of the Navratri
festival; expects FY13 industry growth at 3-4%.
(2) New launches:
Pulsar 200NS
(8k/month) and
Discover 125ST
(34k/month) ramping up well;
New Discover 100
to be launched in January 2013; probable launch of four-
wheeler,
RE60
in 1QFY14.
(3) Demand in Africa remains healthy,
with 10-15% growth; ex-Africa and Sri Lanka,
demand largely flat, in line with global weakness.
(4) FY14 forex hedge:
USD600m (~40%) hedged at INR53/
USD (v/s our assumption of INR52.5/USD).
(5) Duty drawback cut:
To increase export prices by ~2.5% from
November 2012.
Successful ramp-up of recent motorcycle launches and opening-up of three-wheeler permits would be key
drivers for the stock over the next 6-9 months.
We upgrade our FY13/FY14 EPS estimates by 4.7%/3.3% to factor in higher realizations on better product mix.
We build-in partial pass through (2.5%) of the impact of recent cut in duty drawback rates by 3.5%, with
consequent impact on export volume growth for FY14. For FY13/FY14, we expect volumes to decline 2.7% /
grow 11.9% and estimate EBITDA margin at 18.1% / 18.8%. Maintain
Buy
with a target price of INR1,825.
Jinesh Gandhi
(Jinesh@MotilalOswal.com) + 91 22 3982 5416
Chirag Jain
(Chirag.Jain@MotilalOswal.com) + 91 22 3982 5418
Investors are advised to refer through disclosures made at the end of the Research Report.
1

Bajaj Auto
Volumes remain under pressure, but product mix improves QoQ
Net revenue declined 4.1% YoY (grew 2.2% QoQ) to INR49.7b (v/s our estimate of
INR48.3b), driven by volume de-growth of 9.9% YoY (2.8% QoQ) to 1.049m units
(v/s our estimate of 1.045m units). Realizations improved 6.4% YoY (5.1% QoQ) to
INR47,392/unit (v/s our estimate of INR46,151/unit) on better product mix (new
launches and higher three-wheeler volumes).
Domestic volumes declined 11% YoY (0.7% QoQ), with decline of ~12.1% YoY (2.7%
QoQ) in motorcycles and 4.7% YoY (10.3% QoQ) in three-wheelers.
Export volumes de-grew 8% YoY, impacted by 4.7% YoY and 21.9% YoY de-growth in
motorcycles and three-wheelers, respectively. Three-wheeler exports were
significantly impacted due to headwinds in the key markets of Sri Lanka (50%
increase in customs duty w.e.f. April 2012). While Africa continues to perform
well, other export markets have been weak.
Better product mix, with new launches and higher three-wheeler volumes led to
sequential improvement in realizations. While export realizations improved by
2% QoQ, domestic realizations improved by 6.5% QoQ.
BJAUT’s market share improved in the domestic market, driven by new launches.
The new
Discover 125ST
has helped to increase BJAUT’s share in the commuter
(deluxe) segment from ~16% in April 2012 to ~25% in September 2012. Its market
share in the premium segment (Pulsar
200NS)
has also improved from ~45% in
April 2012 to ~50% in September 2012. BJAUT’s overall share in the motorcycles
market increased 220bp QoQ (declined 120bp YoY) to 25.7% in 2QFY13.
Trend in product mix (units)
2Q
FY13
Motorcycles
Domestic
Exports
Total Motorcycles
% of total
Three Wheelers
Domestic
Exports
Total 3Ws
% of total
Total Volumes
2Q
FY12
YoY
(%)
-12.1
-4.7
-9.6
1QFY13
QoQ
(%)
FY13
YTD
FY12
YTD
YoY
(%)
-6.7
1.2
-4.0
601,876 684,671
326,648 342,686
928,524 1,027,357
88.5
88.3
57,047
55,332
63,637
81,448
120,684 136,780
11.5
11.7
1,049,208 1,164,137
618,489
364,134
982,623
91.1
-2.7 1,220,365 1,307,846
-10.3 690,782 682,562
-5.5 1,911,147 1,990,408
89.8
88.2
3.1
-21.9
-11.8
44,837
51,511
96,348
8.9
-9.9 1,078,971
27.2 101,884
97,608
4.4
23.5 115,148 168,936
-31.8
25.3 217,032 266,544
-18.6
10.2
11.8
-2.8 2,128,179 2,256,979
-5.7
Source: Company, MOSL
Trend in market share (%)
2QFY13
Dom. Motorcycles
Total Motorcycles
Total Dom. 2W
Total 2W (incl exports)
Dom. 3W
3W (incl exports)
25.7
33.2
18.3
24.8
41.0
56.0
2QFY12
26.9
33.7
20.0
26.2
39.9
58.3
YoY (BP)
-120
-50
-170
-140
110
-230
1QFY13
QoQ (BP)
23.5
220
31.4
180
17.4
90
24.3
50
40.3
70
56.3
-30
Source: SIAM, MOSL
22 October 2012
2

Bajaj Auto
Realizations improved in domestic market (INR '000)
Market share improved in domestic two-wheeler market (%)
Source: Company, MOSL
Better mix, lower staff cost/other expenses drive QoQ profitability
improvement
EBITDA margin expanded 50bp QoQ (declined 40bp YoY) to 18.4% (v/s our estimate
of 17.8%), driven by better product mix (new launches and higher three-wheeler
volumes) and pricing action in July together with lower staff cost (down 20bp
QoQ; up 40bp YoY) and stable other expenditure. Based on old Schedule VI, EBITDA
margin improved by 30bp QoQ (down 40bp YoY) to 19.7%.
EBITDA grew 5% QoQ (6.2% YoY) to INR9.15b (v/s our estimate of INR8.57b). Tax
rate increased to 28.8% (v/s our estimate of 29.5%) compared to 25.7% in 2QFY12,
on expiry of partial income tax exemption for Pantnagar plant. Adjusted PAT
declined 6.2% YoY (grew 3.1% QoQ) to INR7.4b (v/s our estimate of INR7.05b), in
line with EBITDA de-growth.
During the quarter, BJAUT booked reversal of MTM loss of INR630m incurred in
FY12 (v/s 330m in 1QFY13) under ‘Other Income’. Also, the company provided
INR120m loss (v/s 360m in 1QFY13) in ‘Other Expenditure’ for shortfall in exports
with respect to budgeted/hedged exports.
BJAUT indicated that forex has impacted 2Q/1HFY13 EBITDA margin by ~60bp.
RM cost declined QoQ on better mix/price increase
Source: Company, MOSL
22 October 2012
3

Bajaj Auto
Trend in EBITDA and EBITDA margin
Source: Company, MOSL
Other takeaways
Domestic demand:
The management indicated that demand during the first five
days of the Navratri festival has been flat to marginally positive YoY. It expects the
industry to grow by 3-4% in FY13, as there could be meaningful inventory correction
in 2HFY13.
Recent/new launches:
Recent launches of
Pulsar 200NS
(8k/month) and
Discover
125ST
(34k/month) have been ramping-up well and are the key reasons for
domestic market share improvement. New
Discover 100
is likely to be launched in
January 2013. The four-wheeler,
RE60
would be launched in 1QFY14, probably
starting with the export markets.
Share in domestic market improves,
driven by new launches. The new
Discover
125ST
has helped to increase share in the commuter (deluxe) segment from ~16%
in April 2012 to ~25% in September 2012. With the help of new
Discover 100
launch
in January 2013, the company expects to touch 30% market share in the commuter
(deluxe) segment by the end of March 2013. Market share in the premium segment
(Pulsar
200NS)
has also improved from ~45% in April 2012 to ~50% in September
2012.
Three-wheelers:
The launch of diesel variants helped BJAUT to gain market share
in three-wheelers. It currently has a market share of ~41% in the diesel segment
and ~85% in the petrol/alternate fuel segment. The management is optimistic on
the recent issue of 10k three-wheeler permits in Delhi and 20k permits in
Hyderabad. BJAUT expects to maintain three-wheeler sales of 17k-18k units/
month. If new permits are issued, its three-wheeler sales could touch 22k-23k
units/month.
Exports:
During the quarter, BJAUT exported 7.5k three-wheelers per month
(against the usual 10k per month) and 7k two-wheelers per month (against the
usual 12k per month). Better performance in the Egypt market helped to partially
offset the loss of sales in Sri Lanka. The management expects demand in Africa to
remain healthy, with 10-15% growth for the next couple of quarters. Ex-Africa and
Sri Lanka, demand is largely flat, in line with global weakness.
Forex hedge:
Net realizations for exports were at INR48.81/USD for 2QFY13. BJAUT
has guided INR49.5/USD for 2HFY13. It has hedged USD600m (~40%) at INR53/USD
(v/s our assumption of INR52.5/USD) for FY14.
4
22 October 2012

Bajaj Auto
Post the recent cut in duty drawback rates, BJAUT plans to raise export prices by
~2.5% from November 2012.
The company has increased prices on Discover 125ST by INR750, Discover 100 by
INR200 in Oct-12. It has also raised prices in domestic 3Ws by INR1,000-1,500.
Volumes from Pantanagar stood at ~267k units (~25% of sales) in 2QFY13
RM contracts for 3QFY13 are marginally lower than 2Q levels.
Capex (excl. aircraft purchase of INR2.5b) for next two years guided at INR5b.
As at September 2012, surplus cash stood at INR45.2b (v/s INR56.8b as at June
2012), as dividend was paid out in 2QFY13.
Upgrading FY13/FY14 EPS estimates by ~4.7%/3.3%
We upgrade our FY13/FY14 EPS estimates by 4.7%/3.3% to factor in higher
realizations on better product mix.
We build in partial pass-through (2.5%) of the impact of the recent cut in duty
drawback rates (from 5.5% to 2%), with consequent pressure on export growth
for FY14. For FY13/FY14, we expect volumes to decline 2.7% / grow 11.9% and
estimate EBITDA margin at 18.1% / 18.8%.
We model INR/USD at 50/52.5 for FY13/FY14. Our estimates could see upgrades, as
BJAUT hedges its FY14 receivables at a favorable rate of INR53-55/USD.
Revised forecast (INR M)
Rev
Volumes (units)
Net Sales
EBITDA
EBITDA Margins (%)
Net Profit
EPS (INR)
4,232,697
197,832
35,735
18.1
29,277
101.2
FY13E
Old
4,257,832
194,101
33,943
17.5
27,951
96.6
Chg (%)
-0.6
1.9
5.3
60
4.7
4.7
Rev
4,734,861
226,292
42,637
18.8
35,146
121.5
FY14E
Old
4,803,628
223,652
40,898
18.3
34,025
117.6
Chg (%)
-1.4
1.2
4.3
60
3.4
3.3
Source: MOSL
Valuation and view
While the short-term volume outlook remains challenging, changing competitive
structure poses a risk in the long term. However, BJAUT is relatively better placed
due to its diversified portfolio, with just ~30% of volumes coming from sale of
<125cc motorcycles in the domestic market.
Successful ramp-up of recent launches in the motorcycle segment and opening-
up of permits for three-wheelers would be key drivers for the stock over the next
6-9 months.
The stock trades at 17.5x FY13E EPS of INR101.2 and 14.6x FY14E EPS of INR121.5.
Maintain
Buy,
with a target price of INR1,825 (15x FY14E EPS).
22 October 2012
5

Bajaj Auto
Bajaj Auto: an investment profile
Company background
Bajaj Auto (BJAUT), the flagship of the Bajaj group, is a
leading manufacturer of two-wheelers (~88% of
volumes) and three-wheelers (~12% of volumes). It is
the market leader in three-wheelers, and is the second
largest player in motorcycles, with leadership in the
premium segment. It is also the largest exporter of two-
wheelers and three-wheelers (~36% of its volumes).
Political/other disruptions in any of the major export
markets.
Recent developments
Has taken price increases of INR1,000-1,500 on
domestic 3Ws, INR750 on Discover 125ST and INR200
on Discover 100cc. Exports prices increased by
average 2.5% from Nov-12.
RM contracts for 3QFY13 are marginally lower than
2Q levels.
Key investment arguments
Well diversified product/market mix, with dom.
>125cc 2W contributing ~33% of vols., 2W export ~29%
and 3W's ~12% of volumes. Its exposure to domestic
<125cc segment, where competitive intensity is set
to increase, is only ~26%.
Prime beneficiary of up-trading, over the longer
term, with rise in customers' income and aspiration
levels helped by its leadership in premium
motorcycle segment.
Exports, which are scaling up rapidly to ~40% in FY13,
are expected to benefit from alliance with Kawasaki
(market access) and KTM (access to technology &
markets).
Valuation and view
The stock trades at 17.5x FY13E EPS of INR101.2 and
14.6x FY14E EPS of INR121.5.
Maintain
Buy,
with a target price of INR1,825 (15x
FY14E EPS).
Sector view
Demand drivers in place, driven by increasing
penetration in rural markets and replacement
demand from urban markets
Two-wheeler exports provide huge opportunity, with
~2x the India opportunity in markets similar to India.
Industry dynamics favorable, with focus on
profitability rather than market share.
Key investments risks
Increasing competitive intensity in the domestic
two-wheeler market could restrict pricing power.
Comparative valuations
Bajaj Auto
P/E (x)
EPS Gr (%)
RoE (%)
EV/EBITDA (x)
FY13E
FY14E
FY13E
FY14E
FY13E
FY14E
FY13E
FY14E
17.5
14.6
-5.8
20.0
44.0
43.4
12.2
9.7
Hero MotoCorp
17.1
14.9
-9.3
14.9
41.8
39.7
10.4
8.5
EPS: MOSL forecast v/s consensus (INR)
MOSL
Forecast
101.2
121.5
Consensus
Forecast
111.1
130.0
Variation
(%)
-8.9
-6.5
FY13
FY14
Target price and recommendation
Current
Price (INR)
1,770
Target
Price (INR)
1,825
Upside
(%)
3.1
Reco.
Buy
Stock performance (1 year)
Shareholding pattern (%)
Sep-12
Promoter
Domestic Inst
Foreign
Others
22 October 2012
50.0
10.0
15.5
24.5
Jun-12
50.0
9.8
15.3
24.9
Sep-11
50.0
8.3
16.4
25.2
6

Bajaj Auto
Financials and Valuation
22 October 2012
7

Disclosures
This report is for personal information of the authorized recipient and does not construe to be any investment, legal or taxation advice to you. This research report does not constitute an offer, invitation or inducement
to invest in securities or other investments and Motilal Oswal Securities Limited (hereinafter referred as MOSt) is not soliciting any action based upon it. This report is not for public distribution and has been
furnished to you solely for your information and should not be reproduced or redistributed to any other person in any form.
Unauthorized disclosure, use, dissemination or copying (either whole or partial) of this information, is prohibited. The person accessing this information specifically agrees to exempt MOSt or any of its affiliates
or employees from, any and all responsibility/liability arising from such misuse and agrees not to hold MOSt or any of its affiliates or employees responsible for any such misuse and further agrees to hold MOSt
or any of its affiliates or employees free and harmless from all losses, costs, damages, expenses that may be suffered by the person accessing this information due to any errors and delays.
The information contained herein is based on publicly available data or other sources believed to be reliable. While we would endeavour to update the information herein on reasonable basis, MOSt and/or its
affiliates are under no obligation to update the information. Also there may be regulatory, compliance, or other reasons that may prevent MOSt and/or its affiliates from doing so. MOSt or any of its affiliates or
employees shall not be in any way responsible and liable for any loss or damage that may arise to any person from any inadvertent error in the information contained in this report . MOSt or any of its affiliates
or employees do not provide, at any time, any express or implied warranty of any kind, regarding any matter pertaining to this report, including without limitation the implied warranties of merchantability, fitness
for a particular purpose, and non-infringement. The recipients of this report should rely on their own investigations.
This report is intended for distribution to institutional investors. Recipients who are not institutional investors should seek advice of their independent financial advisor prior to taking any investment decision
based on this report or for any necessary explanation of its contents.
MOSt and/or its affiliates and/or employees may have interests/positions, financial or otherwise in the securities mentioned in this report. To enhance transparency, MOSt has incorporated a Disclosure of Interest
Statement in this document. This should, however, not be treated as endorsement of the views expressed in the report.
Disclosure of Interest Statement
1. Analyst ownership of the stock
2. Group/Directors ownership of the stock
3. Broking relationship with company covered
4. Investment Banking relationship with company covered
Bajaj Auto
No
No
No
No
Analyst Certification
The views expressed in this research report accurately reflect the personal views of the analyst(s) about the subject securities or issues, and no part of the compensation of the research analyst(s) was, is, or
will be directly or indirectly related to the specific recommendations and views expressed by research analyst(s) in this report. The research analysts, strategists, or research associates principally responsible
for preparation of MOSt research receive compensation based upon various factors, including quality of research, investor client feedback, stock picking, competitive factors and firm revenues.
Regional Disclosures (outside India)
This report is not directed or intended for distribution to or use by any person or entity resident in a state, country or any jurisdiction, where such distribution, publication, availability or use would be contrary to
law, regulation or which would subject MOSt & its group companies to registration or licensing requirements within such jurisdictions.
For U.K.
This report is intended for distribution only to persons having professional experience in matters relating to investments as described in Article 19 of the Financial Services and Markets Act 2000 (Financial
Promotion) Order 2005 (referred to as "investment professionals"). This document must not be acted on or relied on by persons who are not investment professionals. Any investment or investment activity to
which this document relates is only available to investment professionals and will be engaged in only with such persons.
For U.S.
MOSt is not a registered broker-dealer in the United States (U.S.) and, therefore, is not subject to U.S. rules. In reliance on the exemption from registration provided by Rule 15a-6 of the U.S. Securities Exchange
Act of 1934, as amended (the "Exchange Act") and interpretations thereof by the U.S. Securities and Exchange Commission ("SEC") in order to conduct business with Institutional Investors based in the U.S.,
Motilal Oswal has entered into a chaperoning agreement with a U.S. registered broker-dealer, Marco Polo Securities Inc. ("Marco Polo"). Any business interaction pursuant to this report will have to be executed
within the provisions of this Chaperoning agreement.
This report is intended for distribution only to "Major Institutional Investors" as defined by Rule 15a-6(b)(4) of the Exchange Act and interpretations thereof by SEC (henceforth referred to as "major institutional
investors"). This document must not be acted on or relied on by persons who are not major institutional investors. Any investment or investment activity to which this document relates is only available to major
institutional investors and will be engaged in only with major institutional investors.
The Research Analysts contributing to the report may not be registered /qualified as research analyst with FINRA. Such research analyst may not be associated persons of the U.S. registered broker-dealer, Marco
Polo and therefore, may not be subject to NASD rule 2711 and NYSE Rule 472 restrictions on communication with a subject company, public appearances and trading securities held by a research analyst account.
Motilal Oswal Securities Ltd
Motilal Oswal Tower, Level 9, Sayani Road, Prabhadevi, Mumbai 400 025
Phone: +91 22 3982 5500 E-mail: reports@motilaloswal.com