23 October 2012
2QFY13 Results Update | Sector: Financials
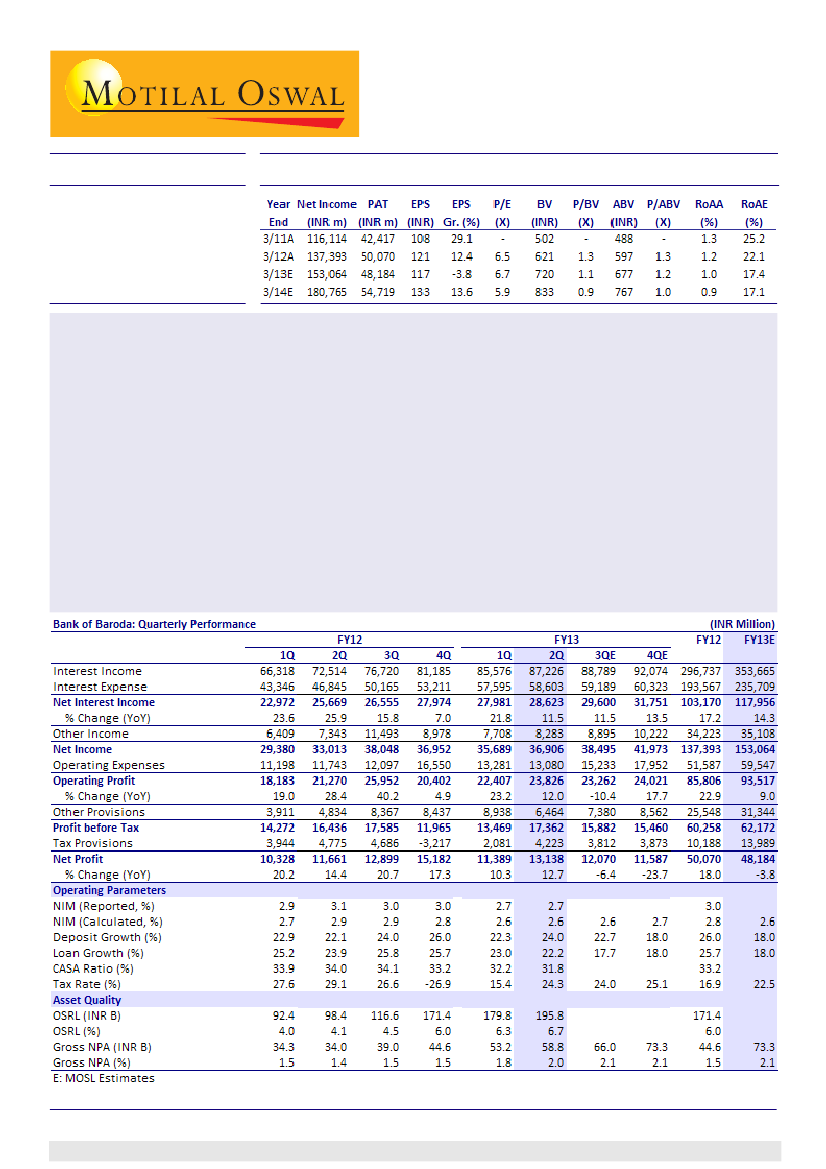
Bank of Baroda
SENSEX
S&P CNX
18,710
Bloomberg
Equity Shares (m)
52-Week Range (INR)
1,6,12 Rel.Perf.(%)
M.Cap. (INR b)
M.Cap. (USD b)
5,691
BOB IN
412.4
881/606
0/-5/-7
323.1
6.0
CMP: INR783
TP: INR835
Neutral
Bank of Baroda reported 2QFY13 PAT grew 13% YoY to INR13.1b (21% above est.) driven by write-back of INR1.3b
on investment, lower coverage (down 330bp QoQ) and lower than expected opex (11% below est.).
Key highlights:
Slippages for 2QFY13 were at an elevated level of INR14.2b (annualized slippage ratio of 2.4%) and recoveries
and up-gradation were largely stable QoQ at INR2.8b. Bank restructured ~INR16b during the quarter, thereby
net stress addition for 2QFY13 increased to INR27.3b as compared to INR18.9b in 1QFY13.
Global and domestic NIMs were stable QoQ at 2.7% and 3.2%. Improvement in domestic yield was off-set by
higher cost of deposits (+6bp QoQ to 7.36%) and 270bp QoQ fall in domestic CD ratio.
Global loans grew 22% YoY, of which domestic loan growth was at 17%. Growth in overseas loans was strong at
33% YoY, however adjusted for currency depreciation growth would have been at 24-25%.
Other highlights:
(1) Domestic CASA declined further by 50bp QoQ to 31.75%. (2) Tax rate at 24.3% v/s expectation of
26% and (3) Trading gains were strong at INR1.1b v/s INR815m in 1QFY13 and INR102m in 2QFY12 - helping PAT growth.
Valuation and view:
While valuations are reasonable, it needs to be seen in context of expected fall in RoA / RoE
in FY13/FY14. Near term headwinds are (a) Top management change in CY12 and (b) Challenging macros leading
to higher slippages. Maintain
Neutral.
Alpesh Mehta
(Alpesh.Mehta@MotilalOswal.com); + 91 22 3982 5415
Sohail Halai
(Sohail.Halai@motilaloswal.com); + 91 22 3982 5430
Investors are advised to refer through disclosures made at the end of the Research Report.
1

Bank of Baroda
Quarterly performance: Above est. led by lower opex and provisions (INR m)
Y/E March
Net Interest Income
% Change (YoY)
Other Income
Net Income
Operating Expenses
Operating Profit
% Change (YoY)
Other Provisions
Profit before Tax
Tax Provisions
Net Profit
% Change (YoY)
2QFY13A
28,623
12
8,283
36,906
13,080
23,826
12
6,464
17,362
4,223
13,138
13
2QFY13E
28,785
25
8,523
37,308
12,696
24,612
35
8,116
16,496
4,949
11,547
12
Var. (%)
2
-9
-1
-11
6
-17
19
11
21
Comments
Margin in-line with est.
Muted fee income growth
Slippages remain at an elevated level; write back of INR1.3b
Lower opex and provisions boost PAT
Source: Company, MOSL
Slippages remain at an elevated level
Gross slippages stood at INR14.2b (annualized slippage ratio of ~2.4%) v/s INR12.6b in
1QFY13. Slippages was led by sectors viz. agriculture and SME segment and only couple
of large accounts worth INR2b each slipped into NPA during the quarter. Recoveries
and up-gradation improved marginally QoQ to INR2.8b as compared to INR2.6b in
1QFY13, but was up significantly from year ago level of INR1.9b. Management expects
recoveries and up-gradation to improve led by recoveries in small accounts.
Aggressive write-offs contain GNPA
Bank resorted to aggressive write-offs of INR5.8b v/s INR2b a quarter ago. As a result
QoQ increase in GNPA (absolute terms) was contained at 11%. Credit cost for the
quarter stood at 1% as compared to 1.13% (adjusted for excess provisioning credit
cost was 70bp) in 1QFY13 and 0.5% in 2QFY12. NNPA increased 29% QoQ and PCR (cal)
declined to 60% as compared to 65% in 1QFY13. PCR(including technical write-off)
declined as well to 75.7% as compared to 79% a quarter ago - but still remains as one
of the best among peers.
In percentage terms GNPA was up 14bp QoQ to ~2% and NNPA was up 17bp QoQ to
0.82%. Segmental GNPAs declined in all segments except retail (2.3% v/s 2% a quarter
ago). GNPA in small scale industries segment declined QoQ to 4.1% (v/s 4.8% a quarter
ago) but is high as compared to 1.65% in 2QFY12. GNPA in agriculture segment declined
marginally QoQ to 4.58% v/s 4.66% in 1QFY13 and that in large corporate segment was
stable at 1.63%.
Restructured loan of ~INR16b during the quarter
During the quarter, BoB restructured loan of ~INR16b (domestic loan of INR9.3b) as
compared to INR8.3b in 1QFY13. As a result, o/s domestic restructured portfolio stood
at INR152b (or 7.6% of domestic loans). Including INR44b (4.7% of overseas loan) of
overseas restructured portfolio, the overall restructured portfolio stood at INR196b
~6.7% of global loans. During the quarter bank restructured INR6.6b in large corporate
segment and INR2.3b in SME segment. Wholesale banking (large corporate) and SME
segment forms 75% and SME forms ~14.5% of domestic restructured portfolio.
23 October 2012
2

Bank of Baroda
Stable margins QoQ - largely in line with expectation
Reported domestic margin was stable QoQ at 3.2% - despite slippage being at an
elevated level. While cost of deposits increased 6bp QoQ yield on loans and
investments increased 10bp QoQ (11.75%) and 9bp QoQ (7.9%) respectively. Strong
growth in high yielding SME (+7.5% QoQ and +22% YoY) and retail (+4% QoQ and
+14.6% YoY) coupled with falling share of agricultural loans would have led to
improvement in yield on loans in our view. In-line with domestic margins, global
margins was stable as well at 2.71%. Overseas margins stood at 1.54% (stable QoQ) as
27bp QoQ decline in yield on investment was compensated by 13bp QoQ decline in
cost of deposits and largely stable yield on loans.
Healthy loan growth YoY; Domestic CASA ratio falls further
While, the global loan book grew 22% YoY (+2% QoQ) to INR2.92t, domestic loans
grew 17.5% YoY and 1.5% QoQ to INR1.98t. Meanwhile, overseas loans grew 33% YoY
and 4% QoQ been partially led by currency depreciation, adjusted for which overseas
loan growth would have been 24-25%. Global deposits grew by 24% YoY (+6.6% QoQ),
of which domestic deposits grew by 20% YoY (+5.4% QoQ). As a result domestic CD
ratio declined to 67.8% from 70.54% in 1QFY13 and 72.1% in 4QFY12. Sequential growth
in domestic CASA was healthy at 3.8% led by strong growth of 7% QoQ (up just 5.7%
YoY) in CA deposits. SA deposit growth was healthy at 3% QoQ and 13% YoY. Importantly,
despite healthy growth in CASA deposits, domestic CASA ratio declined further by
~50bp QoQ to 31.7%.
Fee income
performance has been
muted in 1HFY13 and
overall non-interest
income growth been
driven by treasury gains
Fee income disappoints (INR m)
2QFY13
CEB
Forex Income
Sale of Invt
Recoveries
4,676
1,832
1,120
655
1QFY13 QoQ Gr. (%) 2QFY12
4,142
1,921
815
830
12.9
-4.6
37.4
-21.1
4,549
1,473
102
1,220
YoY Gr.
2.8
24.3
N.A.
-46.3
1HFY13
8,818
3,753
1,935
1,485
1HFY12 YoY Gr. (%)
8,530
2,873
842
1,507
3.4
30.6
129.9
-1.5
Source: Company, MOSL
Provision write-back helps profit growth
2QFY13
1QFY13 QoQ Gr. (%) 2QFY12 YoY Gr. (%) 1HFY13
8,121
1.1
33
760
24
-11
N.A.
-276
609
2,981
0.5
469
1,450
-67
142
-13
-192
-350
15,350
1.1
441
-581
191
1HFY12 YoY Gr. (%)
4,301
0.4
1,599
2,835
9
257
-72
-120
N.A
Credit cost
continue to be at an
elevated level as
pressure on asset quality
persists
Provisions
NPA
Credit cost
Std Assets
Dep. on Invt
Others
7,229
1.0
408
-1,340
167
Source: Company, MOSL
Valuation and view
Despite higher slippages and muted loan growth, BoB has maintained margins at
2.7% (domestic NIM at 3.2%). Management remains confident of maintaining margins
(with an upward bias) in the current range over next two quarters. This coupled with
healthy loan growth would translate into NII CAGR of ~16% over FY12/14.
Fee income (ex forex) growth remains very volatile and has not been able to keep
pace with balance growth; fee income to average assets have declined from 60bp in
23 October 2012
3

Bank of Baroda
FY09 to just 45bp in FY12 (38bp in 1HFY13). We expect fee income CAGR of 11% as
against 18.5% for balance sheet growth. Further cost to average assets have improved
significantly over past to 1.3% in FY12 as against 1.8% in FY09 led by higher share of
overseas business and further improvement in the same seems challenging. Thereby
core operating profits to average assets are unlikely to improve over FY13/14.
Stress has been increasing on balance sheet however; BOB is effectively utilizing
gains of lower tax rate and higher non-core income to maintain PCR at the healthy
level of 75-80%. While we largely maintain earnings estimate at the operating profit
level, we upgrade our earnings estimate factoring lower provisions on account of
MTM write-back.
We expect the bank to report EPS of INR117 and INR133 and BV of INR720 and INR833
for FY12 and FY13. The stock currently trades at1.1x FY13E BV and 0.9x FY14E BV. While
valuations are reasonable, it needs to be seen in context of expected fall in RoA / RoE
in FY13/FY14. Near term headwinds are (a) Top management change in CY12 and (b)
Challenging macros leading to higher slippages (room for negative surprise is limited),
though performance in FY12 and 1QFY13 has been than its peers. Maintain
Neutral.
We upgrade our earning estimate to factor in lower provisions (INR b)
Old Estimates
FY13
FY14
116.3
136.6
37.8
43.6
154.1
180.2
60.2
67.9
93.8
112.3
33.8
41.3
60.0
70.9
14.4
17.7
45.6
53.2
2.6
2.6
1.0
1.0
0.9
0.9
16.6
16.8
Rev. Estimates
FY13
FY14
118.0
139.6
35.1
41.1
153.1
180.8
59.5
68.0
93.5
112.8
31.3
39.8
62.2
73.0
14.0
18.2
48.2
54.7
2.6
2.6
1.0
1.0
1.0
0.9
17.4
17.1
Change (%)
FY13
FY14
1.4
2.2
-7.0
-5.6
-0.7
0.3
-1.1
0.1
-0.3
0.5
-7.4
-3.6
3.6
2.9
-2.9
2.9
5.7
2.9
Net Interest Income
Other Income
Total Income
Operating Expenses
Operating Profits
Provisions
PBT
Tax
PAT
Margins (%)
Credit Cost (%)
RoA (%)
RoE (%)
Source: MOSL
Bank of Baroda: One year forward P/E
Bank of Baroda: One year forward P/BV
23 October 2012
4

Bank of Baroda
Quarterly trends
Loan growth remains healthy
Deposit growth picks up QoQ
Overall growth is being driven by strong growth in overseas
portfolio (+33% YoY), and within domestic strong growth
was seen in SME and retail segment
Overseas deposit growth at 36% whereas domestic deposit
growth was at 20%
Domestic CASA ratio declines marginally QoQ
Domestic CD ratio declines QoQ (%)
Sequential growth in domestic CASA was healthy at 3.8%
led by strong growth of 7% QoQ in CA deposits
Bank builds up excess liquidity in the balance sheet which
can aid margin in 2HFY13
Share of overseas loans increases further (%)
Yield on loans and cost of deposits stable QoQ (%)
Strong growth in overseas business partially helped by
depreciation in currency has led to higher share of
overseas loans
While yield on loans and cost of deposits increased QoQ,
they declined in overseas portfolio. As a result on blended
basis it was largely stable QoQ
23 October 2012
5

Bank of Baroda
Quarterly trends (continued)
Margin stable QoQ - in-line with estimates
Core fee income performance remains muted
Reported domestic margin was stable QoQ at 3.2% - despite
slippage at an elevated level.
Balance sheet growth out-paced overall fee income growth
over past few quarters as a consequence fee income to
avg assets have fallen from 0.6% in FY09 to 0.38% in 1HFY13
Cost to core income stable QoQ (%)
Pressure on asset quality continues
Even though pressure on fee continued, control over opex
led to stable cost to core income ratio
Slippages continue to be at an elevated level, however it
was more granular with only two large accounts slipping
into NPA
GNPA increases 11% QoQ; PCR (incl. tech. w/off) at ~76%
Restructured loan of ~INR16b in 2QFY13 v/s INR8.3b in 1QFY13
Aggressive write-off of INR5.8b helped BoB contain GNPA
Overall restructured loan portfolio (including overseas)
stood at INR196b (6.7% of global loans)
23 October 2012
6

Bank of Baroda
Quarterly Snapshot
FY12
1Q
Profit and Loss (INR m)
Net Interest Income
22,972
Other Income
6,409
Trading profits
740
Forex Income
1,400
Recoveries
288
Others (Non core)
3,981
Total Income
29,380
Operating Expenses
11,198
Employee
6,454
Others
4,744
Operating Profits
18,183
Provisions
3,911
NPA provisions
1,320
Provisions on Invst.
1,385
Others
1,206
PBT
14,272
Taxes
3,944
PAT
10,328
Ratios (%)
Fees to Total Income
13.5
Cost to Core Income
41.5
Tax Rate
27.6
CASA Reported
33.9
Loan/Deposit
74.2
Domestic Loan/ Deposit
71.3
CAR
13.1
Tier I
9.1
Margins Global (%)
Yield on loans
9.1
Yield On Investments
7.5
Cost of Deposits
5.4
Margins
2.9
Margins - Domestic (%)
Yield on loans
11.2
Yield On Investments
7.6
Cost of Deposits
6.4
Margins
3.4
Margins - Overseas (%)
Yield on loans
3.4
Yield On Investments
4.9
Cost of Deposits
1.8
Margins
1.4
Franchise
Branches
3,409
ATM
1,657
For %age change QoQ and YoY is bp
2Q
25,669
7,343
102
1,473
1,220
4,549
33,013
11,743
6,466
5,277
21,270
4,834
2,981
1,450
402
16,436
4,775
11,661
13.8
38.9
29.1
34.0
72.6
69.1
12.7
8.8
9.6
7.6
5.6
3.1
12.1
7.7
6.8
3.7
3.4
4.2
1.8
1.4
3,492
1,800
3Q
26,555
11,493
3,855
2,407
711
4,520
38,048
12,097
6,740
5,356
25,952
8,367
5,089
2,241
1,037
17,585
4,686
12,899
11.9
38.9
26.6
34.1
74.6
70.7
13.5
9.3
9.5
7.7
5.7
3.0
12.0
7.8
6.9
3.5
3.6
4.9
2.0
1.6
3,691
1,838
4Q
27,974
8,978
1,370
1,632
1,064
4,912
36,952
16,550
10,196
6,354
20,402
8,437
9,262
-2,713
1,888
11,965
-3,217
15,182
13.3
50.3
-26.9
33.2
74.7
72.1
14.7
10.8
9.3
7.5
5.8
3.0
11.7
7.7
7.2
3.4
3.8
3.8
1.7
1.7
3,993
2,012
FY13
1Q
27,981
7,708
815
1,921
830
4,142
35,689
13,281
7,610
5,671
22,407
8,938
8,121
760
57
13,469
2,081
11,389
11.6
41.3
15.4
32.2
74.7
70.5
13.7
10.1
9.1
7.7
5.9
2.7
11.7
7.8
7.3
3.2
3.5
4.9
1.9
1.6
4,006
2,130
2Q
Variation (%)
Cumulative Numbers
QoQ
YoY 1HFY12 1HFY13 YoY Gr (%)
2
7
37
-5
-21
13
3
-2
-1
-2
6
-28
-11
-276
909
29
103
15
12
13
N.A.
24
-46
3
12
11
16
6
12
34
142
-192
43
6
-12
13
48,641
13,752
842
2,873
1,507
8,530
62,393
22,941
12,920
10,021
39,452
8,744
4,301
2,835
1,608
30,708
8,719
21,989
13.7
40.1
28.4
56,604
15,991
1,935
3,753
1,485
8,818
72,595
26,362
15,122
11,240
46,233
15,402
15,350
-581
632
30,831
6,304
24,527
12.1
40.3
20.4
16
16
130
31
-2
3
16
15
17
12
17
76
257
-120
-61
0
-28
12
28,623
8,283
1,120
1,832
655
4,676
36,906
13,080
7,512
5,568
23,826
6,464
7,229
-1,340
575
17,362
4,223
13,138
12.7
39.3
24.3
31.8
71.6
67.8
12.9
9.6
9.1
7.8
5.9
2.7
11.8
7.9
7.4
3.2
3.5
4.6
1.7
1.5
4,117
2,230
-1
8
-4
-2
10
9
6
1
-3
-27
-13
-1
-57
21
24
-36
-39
20
52
-44
12
40
-9
12
9.4
7.5
5.5
3.0
11.7
7.7
6.6
3.5
3.4
4.6
1.8
1.4
9.1
7.8
5.9
2.7
11.7
7.9
7.3
3.2
3.5
4.8
1.8
1.5
-30
23
39
-25
2
22
71
-31
13
23
-2
15
Source: Company, MOSL
23 October 2012
7

Bank of Baroda
Quarterly Snapshot (Contd..)
INR b
Balance sheet
Deposits
Domestic
Overseas
Loans
Domestic
Overseas
CASA
Domestic
Overseas
Savings Deposits
Domestic
Overseas
Current Deposits
Domestic
Overseas
Loan Break Up
Retail Loans
of which Housing
Agriculture
SME
Others
Asset Quality
GNPA
NNPA
GNPA (%)
NNPA (%)
PCR (Calculated, %)
PCR (Reported, %)
Movement in NPA
Opening
Additions
Deductions
Of Which:
Due to write Off
Due to Upgradtion
Due to Recoveries
Closing
Slippage Ratio (%)
Credit Cost (%)
O/s Restructured loans
% of Loans
For %age change QoQ and YoY
1Q
2,547
1,962
585
1,856
1,357
499
748
691
57
561
548
13
187
143
44
250
108
211
216
1,179
26.6
7.2
1.4
0.4
73.0
85.7
24.0
6.7
4.1
1.6
1.1
1.4
26.6
1.9
0.6
66.0
3.6
is bp
FY11
2Q
3Q
2,697
2,060
637
1,930
1,417
512
798
739
59
593
580
14
205
160
45
272
113
216
235
1,207
27.2
7.3
1.4
0.4
73.1
85.6
26.6
2.9
2.3
0.9
0.4
1.0
27.2
0.8
0.3
66.9
3.5
2,815
2,154
661
2,072
1,520
552
820
756
64
615
601
14
205
155
49
296
119
231
253
1,292
27.7
7.4
1.3
0.4
73.1
85.5
27.2
2.8
2.4
1.2
0.1
1.1
27.6
0.7
0.4
72.8
3.5
FY12
4Q
3,054
2,333
721
2,287
1,694
593
876
802
74
645
630
15
231
172
59
324
125
245
274
1,443
31.5
7.9
1.4
0.4
74.9
85.0
27.6
6.7
2.8
1.3
0.5
1.1
31.4
1.5
0.8
88.7
3.9
1Q
3,129
2,365
764
2,323
1,686
637
872
802
70
657
642
15
216
161
55
309
129
232
284
1,498
34.3
10.2
1.5
0.4
70.1
82.5
31.4
5.8
3.1
1.1
0.7
1.3
34.1
1.3
0.2
92.4
4.0
2Q
3,292
2,447
845
2,391
1,690
701
902
833
69
685
670
15
216
162
54
299
133
220
301
1,570
34.0
11.2
1.4
0.5
67.1
82.0
34.1
5.8
6.1
4.2
0.4
1.5
33.9
1.2
0.5
98.4
4.1
3Q
3,492
2,550
942
2,607
1,802
804
948
868
80
718
702
17
230
167
63
310
137
259
321
1,716
39.0
13.3
1.5
0.5
66.0
80.5
33.9
9.5
4.6
1.6
1.7
1.4
38.8
1.8
0.8
116.6
4.5
4Q
3,849
2,801
1,047
2,874
2,021
853
1,035
929
106
746
726
20
289
204
86
357
141
290
345
1,882
44.6
15.4
1.5
0.5
65.4
80.1
38.8
13.2
7.5
5.3
0.6
1.7
44.5
2.3
1.4
171.4
6.0
FY13
1Q
2Q
3,827
2,778
1,049
2,858
1,960
898
998
896
102
756
735
20
242
160
82
329
145
278
343
1,908
53.2
18.4
1.8
0.7
65.3
79.0
44.6
13.1
4.5
2.0
1.3
1.2
53.2
2.3
1.1
179.8
6.3
4,081
2,929
1,153
2,922
1,987
935
1,053
930
123
778
758
20
274
172
103
342
148
257
369
1,953
58.8
23.8
2.0
0.8
59.4
75.7
Variation (%)
QoQ
YoY
7
5
10
2
1
4
5
4
20
3
3
-2
13
7
26
4
2
-7
7
2
11
29
14
17
-589
-330
24
20
36
22
18
33
17
12
77
14
13
31
27
6
90
15
11
17
22
24
73
113
57
35
-768
-625
53.2
14.2
8
143
8.6
88
41
5.8
196
38
1.0
-23
147
1.7
39
20
58.8
2.4
11
116
1.0
-13
49
195.8
9
99
6.7
41
258
Source: Company/MOSL
23 October 2012
8

Bank of Baroda
Stock Info
EPS: MOSL forecast v/s consensus (INR)
MOSL
Forecast
116.8
132.7
Consensus
Forecast
124.8
144.7
Variation
(%)
-6.4
-8.3
1-year Sensex rebased
FY13
FY14
Shareholding pattern (%)
Sep-12
Promoter
Domestic Inst
Foreign
Others
54.3
19.1
15.4
11.3
Jun-12
54.3
19.7
14.3
11.6
Sep-11
57.0
16.8
14.9
11.4
23 October 2012
9

Bank of Baroda
Financials and valuation
23 October 2012
10

Bank of Baroda
Financials and valuation
23 October 2012
11

Disclosures
This report is for personal information of the authorized recipient and does not construe to be any investment, legal or taxation advice to you. This research report does not constitute an offer, invitation or inducement
to invest in securities or other investments and Motilal Oswal Securities Limited (hereinafter referred as MOSt) is not soliciting any action based upon it. This report is not for public distribution and has been
furnished to you solely for your information and should not be reproduced or redistributed to any other person in any form.
Unauthorized disclosure, use, dissemination or copying (either whole or partial) of this information, is prohibited. The person accessing this information specifically agrees to exempt MOSt or any of its affiliates
or employees from, any and all responsibility/liability arising from such misuse and agrees not to hold MOSt or any of its affiliates or employees responsible for any such misuse and further agrees to hold MOSt
or any of its affiliates or employees free and harmless from all losses, costs, damages, expenses that may be suffered by the person accessing this information due to any errors and delays.
The information contained herein is based on publicly available data or other sources believed to be reliable. While we would endeavour to update the information herein on reasonable basis, MOSt and/or its
affiliates are under no obligation to update the information. Also there may be regulatory, compliance, or other reasons that may prevent MOSt and/or its affiliates from doing so. MOSt or any of its affiliates or
employees shall not be in any way responsible and liable for any loss or damage that may arise to any person from any inadvertent error in the information contained in this report . MOSt or any of its affiliates
or employees do not provide, at any time, any express or implied warranty of any kind, regarding any matter pertaining to this report, including without limitation the implied warranties of merchantability, fitness
for a particular purpose, and non-infringement. The recipients of this report should rely on their own investigations.
This report is intended for distribution to institutional investors. Recipients who are not institutional investors should seek advice of their independent financial advisor prior to taking any investment decision
based on this report or for any necessary explanation of its contents.
MOSt and/or its affiliates and/or employees may have interests/positions, financial or otherwise in the securities mentioned in this report. To enhance transparency, MOSt has incorporated a Disclosure of Interest
Statement in this document. This should, however, not be treated as endorsement of the views expressed in the report.
Disclosure of Interest Statement
1. Analyst ownership of the stock
2. Group/Directors ownership of the stock
3. Broking relationship with company covered
4. Investment Banking relationship with company covered
Bank of Baroda
No
No
No
No
Analyst Certification
The views expressed in this research report accurately reflect the personal views of the analyst(s) about the subject securities or issues, and no part of the compensation of the research analyst(s) was, is, or
will be directly or indirectly related to the specific recommendations and views expressed by research analyst(s) in this report. The research analysts, strategists, or research associates principally responsible
for preparation of MOSt research receive compensation based upon various factors, including quality of research, investor client feedback, stock picking, competitive factors and firm revenues.
Regional Disclosures (outside India)
This report is not directed or intended for distribution to or use by any person or entity resident in a state, country or any jurisdiction, where such distribution, publication, availability or use would be contrary to
law, regulation or which would subject MOSt & its group companies to registration or licensing requirements within such jurisdictions.
For U.K.
This report is intended for distribution only to persons having professional experience in matters relating to investments as described in Article 19 of the Financial Services and Markets Act 2000 (Financial
Promotion) Order 2005 (referred to as "investment professionals"). This document must not be acted on or relied on by persons who are not investment professionals. Any investment or investment activity to
which this document relates is only available to investment professionals and will be engaged in only with such persons.
For U.S.
MOSt is not a registered broker-dealer in the United States (U.S.) and, therefore, is not subject to U.S. rules. In reliance on the exemption from registration provided by Rule 15a-6 of the U.S. Securities Exchange
Act of 1934, as amended (the "Exchange Act") and interpretations thereof by the U.S. Securities and Exchange Commission ("SEC") in order to conduct business with Institutional Investors based in the U.S.,
Motilal Oswal has entered into a chaperoning agreement with a U.S. registered broker-dealer, Marco Polo Securities Inc. ("Marco Polo"). Any business interaction pursuant to this report will have to be executed
within the provisions of this Chaperoning agreement.
This report is intended for distribution only to "Major Institutional Investors" as defined by Rule 15a-6(b)(4) of the Exchange Act and interpretations thereof by SEC (henceforth referred to as "major institutional
investors"). This document must not be acted on or relied on by persons who are not major institutional investors. Any investment or investment activity to which this document relates is only available to major
institutional investors and will be engaged in only with major institutional investors.
The Research Analysts contributing to the report may not be registered /qualified as research analyst with FINRA. Such research analyst may not be associated persons of the U.S. registered broker-dealer, Marco
Polo and therefore, may not be subject to NASD rule 2711 and NYSE Rule 472 restrictions on communication with a subject company, public appearances and trading securities held by a research analyst account.
Motilal Oswal Securities Ltd
Motilal Oswal Tower, Level 9, Sayani Road, Prabhadevi, Mumbai 400 025
Phone: +91 22 3982 5500 E-mail: reports@motilaloswal.com