25 October 2012
3QFY12 Results Update | Sector: Consumer
Castrol India
BSE SENSEX
S&P CNX
18,710
Bloomberg
Equity Shares (m)
52-Week Range (INR)
1,6,12 Rel.Per. (%)
M.Cap (INR b)
M.Cap (USD b)
5,691
CSTRL IN
494.6
338/193
9/19/23
159.7
3.0
CMP: INR323
TP: INR315
Downgrade to Neutral
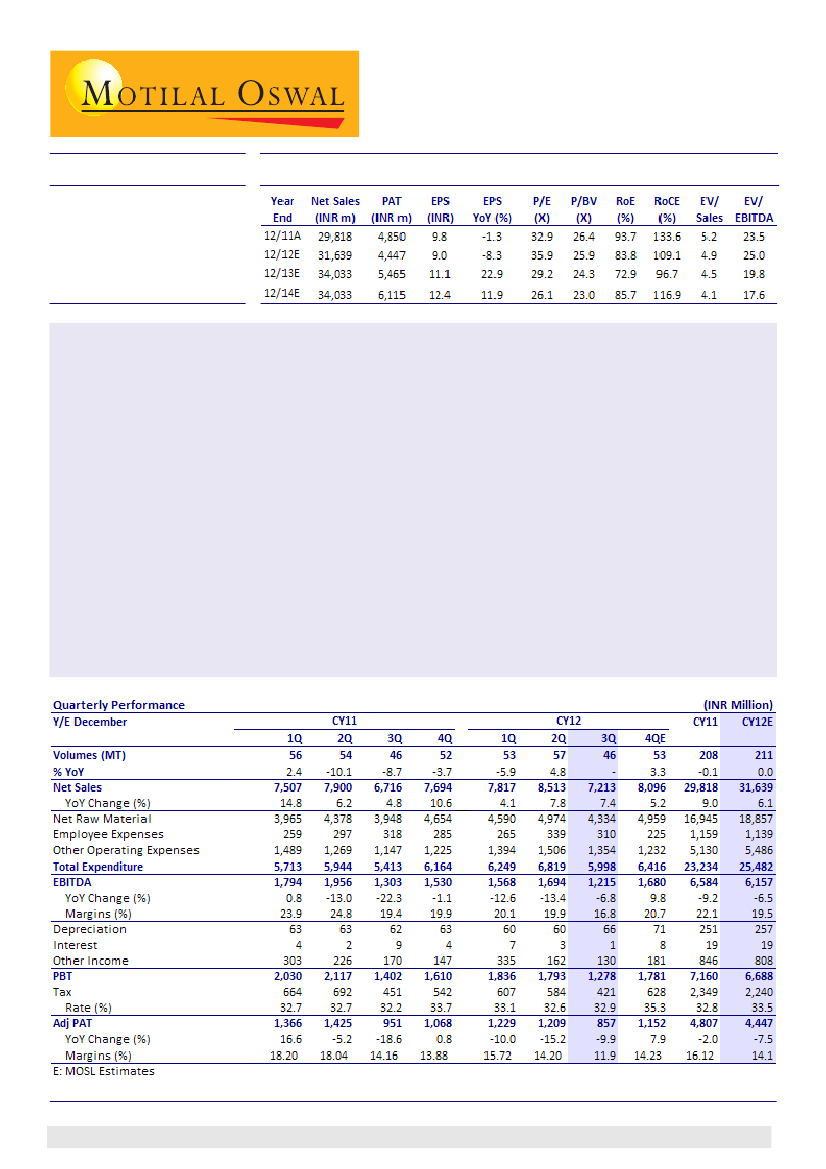
Castrol India (CSTRL) posted lower than expected numbers for 3QCY12. Net sales grew 7.4% YoY to INR7.2b
(v/s our estimate of INR7.7b) and EBITDA declined 6.8% YoY to INR1.2b (v/s our estimate of INR1.5b). EBITDA
margin declined 256bp YoY to 16.8%, negatively impacted by forex loss of INR580m due to INR depreciation.
Automotive volumes grew ~3% YoY, but this was offset by decline in industrial and marine volumes. Overall
volumes were flat. In value terms, automotive sales grew 11% YoY, while non-automotive sales declined 11%
YoY. The automotive segment constitutes ~13% of CSTRL's total sales.
Net profit declined 10% YoY to INR857m (v/s our estimate of INR1b) and net margin dropped to 11.9%, the
lowest since 4QCY08.
We have cut our volume growth assumption for CY12 from +2.1% to +1.5%, but maintain our CY13 volume
growth estimate of +2.4%. We have also cut our CY12/CY13 net profit estimates by 2.5% / 2.7% to INR4.4b /
INR5.5b.
We expect CSTRL to post earnings CAGR of 17% and FCF CAGR of 11% over CY12-14. The stock trades at 29.2x /
26.1x CY13E / CY14E EPS. Our DCF-based price target is INR315. Though we remain positive on CSTRL's long-
term prospects, given that the stock is currently trading above our target price, we downgrade CSTRL from Buy
to
Neutral.
Siddharth Bothra
(Siddharth.Bothra@MotilalOswal.com); +91 22 3029 5127
Investors are advised to refer through disclosures made at the end of the Research Report.
1

Castrol India
Segmental analysis: Drop in non-auto segment volumes offsets auto
segment gains
Automotive volumes grew 3% YoY, faster than the market, enabled by strong
marketing programs targeted towards consumers, trade and influencers. However,
the increase was offset by decline in industrial and marine volumes (impacted by
the overall industrial slowdown). Consequently, total volumes were flat versus
the same quarter last year.
Automotive sales were up 11% YoY in value terms, while non-automotive sales
declined 11% YoY. The non-auto segment accounts for ~13% of CSTRL's total sales.
Auto EBIT was flat at INR1b, while non-auto EBIT declined 42% YoY to INR149m.
Segmental analysis: Margins under pressure for both auto and non-auto segment (INR m)
CY11
1Q
Revenues
Automotive
Non-Automotive
Total Segment Revenue
EBIT
Automotive
Non-Automotive
Total
Capital Employed
Automotive
Non-Automotive
Total Capital Employed
EBIT (%)
Automotive
Non-Automotive
Total
6,507
1,000
7,507
1,646
266
1,912
2,233
1,017
6,901
25.3
26.6
25.5
2Q
6,729
1,171
7,900
1,645
292
1,937
1,997
1,138
6,314
24.4
24.9
24.5
3Q
5,652
1,064
6,716
1,042
257
1,299
2,445
1,174
7,272
18.4
24.2
19.3
4Q
6,653
1,041
7,694
1,283
233
1,516
1,277
1,020
6,042
19.3
22.4
19.7
1Q
6,744
1,073
7,817
1,461
243
1,704
2,595
1,164
7,272
21.7
22.6
21.8
CY12
2Q
7,515
998
8,513
1,499
186
1,685
2,122
1,021
6,468
CY11
3Q
6,248
947
7,195
1,036
149
1,185
2,046
1,042
7,326
25,541
4,276
29,817
5,616
1,048
6,664
1,277
1,020
6,042
22.0
24.5
22.3
MOSL
19.9
16.6
18.6
15.7
19.8
16.5
Source: Company,
Margin/unit to sustain, though volume growth to be muted
Over CY01-11, CSTRL's sales volumes have de-grown, not only due to increasing
drain interval, but also because it has deliberately vacated the price-sensitive
volume-driven market. CSTRL depends on technology innovation and path-
breaking new product launches to drive growth and ability to organically generate
growth through internal initiatives is the most sustainable source of growth. We
model CSTRL's net sales growth over CY12-21 at 9%.
Concerns on account of increasing drain intervals are largely unfounded, as CSTRL
has historically maintained its margin/unit, which we believe it can sustain. We
estimate 2.4% CAGR in CSTRL's volumes over CY12-14. However, revenue would
grow at a CAGR of 9%, driven by 6% CAGR in realizations. We expect EBIT margin to
expand from 19.5% in CY11 to 22.2% in CY14 and estimate net profit CAGR at 17%
over CY12-14.
We estimate volume growth at 1.5% for CY12 and at 2.4% for CY13.
Almost 80% of CSTRL's demand in volume terms is from the replacement market,
while the OEM market accounts for only ~20%. Since profitability in the OEM
segment is very low, the share of OEM market in operating profit is even lower.
25 October 2012
2

Castrol India
We believe CSTRL is unlikely to be much impacted from the current growth
slowdown in few automotive segments such as HCVs and two-wheelers.
3QCY13 overall volume growth flat (YoY)
Source: Company, MOSL
Management's growth outlook for key segments
The management has guided for auto lube volume growth of 2-2.5% over the next
3-5 years. CSTRL's auto lube sales break-up is as follows: diesel engine oils (mostly
CVs) 40%, two-wheelers 20%, passenger cars 15%, and OEM, Construction, Brake
oil, etc 25%.
Its key focus area is the premium personal mobility automobile segment, which
is relatively insulated from economic cycles, unlike the freight and OE market.
The management expects the two-wheeler segment to double in volume terms
in the next 3-4 years, while the other segments are likely to post marginal growth.
The management expects growth in the industrial segment to be marginally
stronger than in the auto segment.
Management growth outlook
Company growth outlook over
% CY12-15
40 Expects very low to marginal
growth
2-Wheelers
20 Expects volumes to double in
3-4 years
Passenger Cars
15 Expects 1% odd growth
OE/ Const/ Others
25 Marginal growth
Total
100 2-2.5% growth
Source: Conference Call post 3QCY11 results
Castrol auto volume
break-up
Diesel Engine Oils
Automobiles: Segment-wise sales break-up
Source: Company, MOSL
25 October 2012
3

Castrol India
Automotive industry break-up
Castrol's automobile lubricant break-up
Almost 75% of the lube demand is derived from CVs
and tractors, largely dominated by diesel engines.
2/ 3 wheelers account for another ~13% of the
market, while 4 wheelers/ MUVs account for ~5% of
the market
Source: Industry, MOSL
Valuation and view
We expect CSTRL to post earnings CAGR of 17% and FCF CAGR of 11% over CY12-14.
The company enjoys tremendous pricing power, with most of its products
commanding 20-25% premium.
We have revised our CY12 volume growth assumption from +2.1% to +1.5%, while
we maintain our CY13 volume growth estimate of 2.4%. We have also revised our
CY12 / CY13 net profit estimates by 2.5% / 2.7% to INR4.4b / INR5.5b.
Over CY02-11, CSTRL generated FCF of INR27b, with total reinvestment of negative
INR3b. CSTRL's cumulative net capex (capex - depreciation) over the period was a
negative INR408m, while cumulative net working capital (net of cash) was a
negative INR2.5b. It paid out 87% of its FCF as dividend. Given its predictable and
stable FCFs, low re-investment requirements and consistent payout ratio, we
believe DCF is the best way to value the company.
Our DCF based price target for CSTRL is INR315. The stock trades at 29.2x / 26.1x
CY13E / CY14E EPS. While we remain positive on CSTRL's long-term prospects,
given that the stock is currently trading above our target price, we downgrade it
from Buy to
Neutral.
25 October 2012
4

Castrol India
Castrol India: an investment profile
Company description
Castrol India (CSTRL), a 71% subsidiary of BP, is a leading
lubricants player in India, with ~20% share of the
domestic automotive lubricants market. It manufactures
and markets a range of automotive and industrial
lubricants. It markets its automotive lubricants under
two brands - Castrol and BP. The company enjoys
leadership in most of the segments it operates in,
including tractor oils, car engine oils, two-wheeler 4-
stroke oils, and multi-grade diesel engine oils.
OEMs introducing own brands.
Exchange rate volatility.
Recent developments
Re-launch of its leading brand in the motorcycle
segment - Castrol Activ, with new Actibond
technology.
Took 2-3% price increase across brands in 3QCY12 to
mitigate increasing raw material cost.
Valuation and view
Key investment arguments
CSTRL is a leading lubricants player, with ~19% market
share in the auto lube bazzar segment.
It provides a vehicle to invest in a company with
multiple and rare moats, huge free cash flows, high
governance standards and reasonable valuations.
Its key focus area is the premium personal mobility
automobile segment, which is relatively insulated
from economic cycles, unlike the freight and OE
market.
We expect CSTRL to post earnings CAGR of 17% and
FCF CAGR of 11% over CY12-14.
Our DCF-based price target is INR315. The stock
trades at 29.2x / 26.1x CY13E / CY14E EPS. While we
remain positive on CSTRL's long-term prospects,
given that the stock is currently trading above our
target price, we downgrade it from Buy to
Neutral.
Sector view
Competitive intensity remains high, with ~15
players. Nonetheless, CSTRL has been able to sustain
its performance, given its niche segmentation
within the premium personal mobility segment.
The lubes industry enjoys high RoCE, given low re-
investment requirements.
Key investment risks
Longer oil drain intervals.
Volatile raw material prices.
Aggressive foray by oil PSUs into bazzar trade.
EPS: MOSL forecast v/s Consensus (INR)
MOSL
Forecast
9.0
11.1
Target price and recommendation
Variation
(%)
-
-
CY12
CY13
Consensus
Forecast
-
-
Current
Price (INR)
323
Target
Price (INR)
315
Upside
(%)
-2.5
Reco.
Neutral
Stock performance (1 year)
Shareholding Pattern (%)
Sep-12
Promoter
Domestic Inst
Foreign
Others
71.0
6.5
8.1
14.4
Jun-12
71.0
7.1
7.9
13.9
Sep-11
71.0
7.1
7.6
14.3
25 October 2012
5

Castrol India
Financials and Valuation
25 October 2012
6

Castrol India
N O T E S
25 October 2012
7

Disclosures
This report is for personal information of the authorized recipient and does not construe to be any investment, legal or taxation advice to you. This research report does not constitute an offer, invitation or inducement
to invest in securities or other investments and Motilal Oswal Securities Limited (hereinafter referred as MOSt) is not soliciting any action based upon it. This report is not for public distribution and has been
furnished to you solely for your information and should not be reproduced or redistributed to any other person in any form.
Unauthorized disclosure, use, dissemination or copying (either whole or partial) of this information, is prohibited. The person accessing this information specifically agrees to exempt MOSt or any of its affiliates
or employees from, any and all responsibility/liability arising from such misuse and agrees not to hold MOSt or any of its affiliates or employees responsible for any such misuse and further agrees to hold MOSt
or any of its affiliates or employees free and harmless from all losses, costs, damages, expenses that may be suffered by the person accessing this information due to any errors and delays.
The information contained herein is based on publicly available data or other sources believed to be reliable. While we would endeavour to update the information herein on reasonable basis, MOSt and/or its
affiliates are under no obligation to update the information. Also there may be regulatory, compliance, or other reasons that may prevent MOSt and/or its affiliates from doing so. MOSt or any of its affiliates or
employees shall not be in any way responsible and liable for any loss or damage that may arise to any person from any inadvertent error in the information contained in this report . MOSt or any of its affiliates
or employees do not provide, at any time, any express or implied warranty of any kind, regarding any matter pertaining to this report, including without limitation the implied warranties of merchantability, fitness
for a particular purpose, and non-infringement. The recipients of this report should rely on their own investigations.
This report is intended for distribution to institutional investors. Recipients who are not institutional investors should seek advice of their independent financial advisor prior to taking any investment decision
based on this report or for any necessary explanation of its contents.
MOSt and/or its affiliates and/or employees may have interests/positions, financial or otherwise in the securities mentioned in this report. To enhance transparency, MOSt has incorporated a Disclosure of Interest
Statement in this document. This should, however, not be treated as endorsement of the views expressed in the report.
Disclosure of Interest Statement
1. Analyst ownership of the stock
2. Group/Directors ownership of the stock
3. Broking relationship with company covered
4. Investment Banking relationship with company covered
Castrol India
No
No
No
No
Analyst Certification
The views expressed in this research report accurately reflect the personal views of the analyst(s) about the subject securities or issues, and no part of the compensation of the research analyst(s) was, is, or
will be directly or indirectly related to the specific recommendations and views expressed by research analyst(s) in this report. The research analysts, strategists, or research associates principally responsible
for preparation of MOSt research receive compensation based upon various factors, including quality of research, investor client feedback, stock picking, competitive factors and firm revenues.
Regional Disclosures (outside India)
This report is not directed or intended for distribution to or use by any person or entity resident in a state, country or any jurisdiction, where such distribution, publication, availability or use would be contrary to
law, regulation or which would subject MOSt & its group companies to registration or licensing requirements within such jurisdictions.
For U.K.
This report is intended for distribution only to persons having professional experience in matters relating to investments as described in Article 19 of the Financial Services and Markets Act 2000 (Financial
Promotion) Order 2005 (referred to as "investment professionals"). This document must not be acted on or relied on by persons who are not investment professionals. Any investment or investment activity to
which this document relates is only available to investment professionals and will be engaged in only with such persons.
For U.S.
MOSt is not a registered broker-dealer in the United States (U.S.) and, therefore, is not subject to U.S. rules. In reliance on the exemption from registration provided by Rule 15a-6 of the U.S. Securities Exchange
Act of 1934, as amended (the "Exchange Act") and interpretations thereof by the U.S. Securities and Exchange Commission ("SEC") in order to conduct business with Institutional Investors based in the U.S.,
Motilal Oswal has entered into a chaperoning agreement with a U.S. registered broker-dealer, Marco Polo Securities Inc. ("Marco Polo"). Any business interaction pursuant to this report will have to be executed
within the provisions of this Chaperoning agreement.
This report is intended for distribution only to "Major Institutional Investors" as defined by Rule 15a-6(b)(4) of the Exchange Act and interpretations thereof by SEC (henceforth referred to as "major institutional
investors"). This document must not be acted on or relied on by persons who are not major institutional investors. Any investment or investment activity to which this document relates is only available to major
institutional investors and will be engaged in only with major institutional investors.
The Research Analysts contributing to the report may not be registered /qualified as research analyst with FINRA. Such research analyst may not be associated persons of the U.S. registered broker-dealer, Marco
Polo and therefore, may not be subject to NASD rule 2711 and NYSE Rule 472 restrictions on communication with a subject company, public appearances and trading securities held by a research analyst account.
Motilal Oswal Securities Ltd
Motilal Oswal Tower, Level 9, Sayani Road, Prabhadevi, Mumbai 400 025
Phone: +91 22 3982 5500 E-mail: reports@motilaloswal.com