6 November 2012
2QFY13 Results Update | Sector: Technology
Tech Mahindra
BSE SENSEX
S&P CNX
18,763
Bloomberg
Equity Shares (m)
52-Week Range (INR)
1,6,12 Rel. Perf. (%)
M.Cap. (INR b)
M.Cap. (USD b)
5,704
TECHM IN
127.6
1,043/537
2/29/46
121.9
2.2
CMP: INR955
TP: INR1,150
Buy
# Reported PAT incl Satyam; * EPS incl profits from Satyam, adjusted for restructuring charge
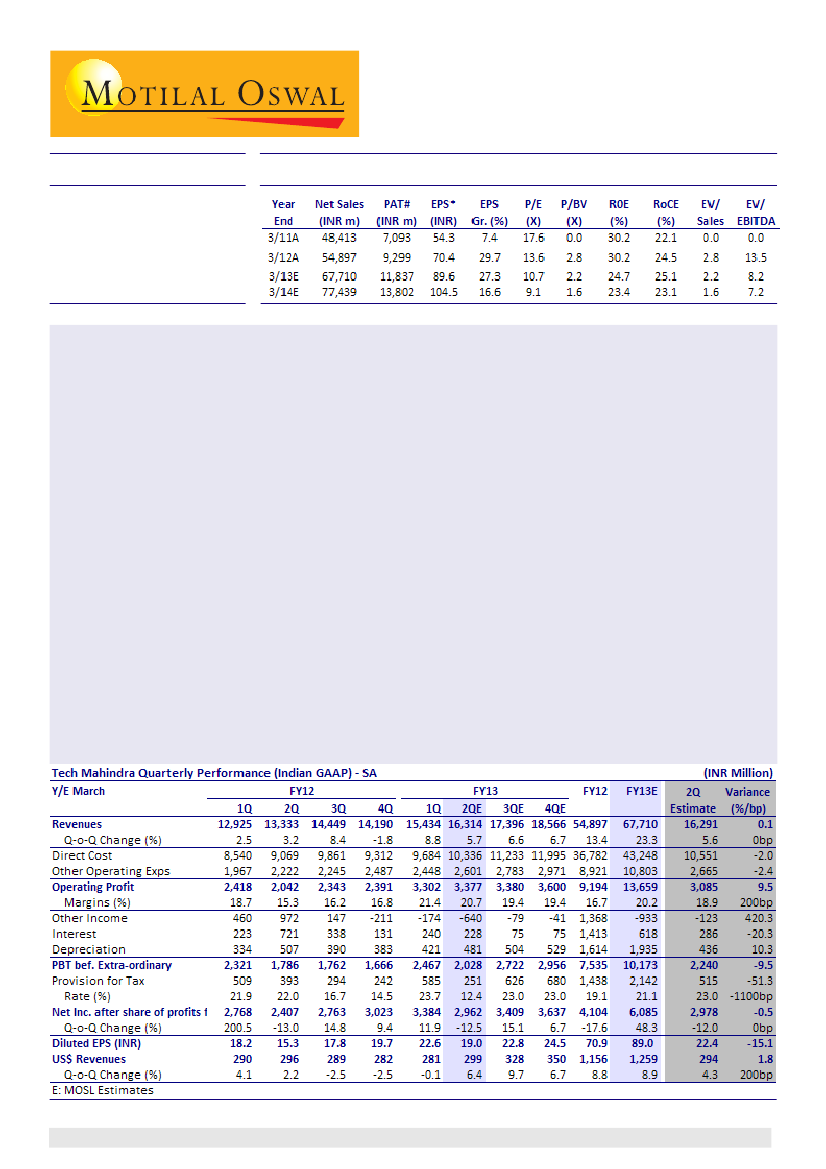
2QFY13 operating performance better than expected:
Tech Mahindra (TECHM) posted better than expected
operating results for 2QFY13 on strong traction in non-BT revenue, though BT revenue declined 3.8% QoQ.
Revenue grew 6.4% QoQ to USD299m (v/s our estimate of USD294m). Organic growth in non-BT business was
4.8% QoQ, while the acquisition of Hutchison Global Services (HGS) contributed USD13.3m.
EBITDA margin at 20.7%, higher than our estimate of 18.9%:
EBITDA margin contracted 70bp QoQ to 20.7%,
higher than our estimate of 18.9% despite headwinds from salary hikes (-150bp impact) and HGS integration
(-30bp impact). PAT was largely in-line at INR17.7b, as higher operating margin and lower tax rate (12% v/s our
estimate of 23%) were offset by higher forex losses.
Further declines possible in BT revenue:
The management cited possibility of further declines in BT on
continued restructuring activity. Outside BT, TECHM closed two large deals in Europe during the quarter, and
is chasing a few more (TCV of USD50m-150m each). However, deal closures are taking longer than it expected.
Cutting USD revenue estimates:
We have moderated our USD revenue assumptions for FY13 / FY14 by 3% /
5.7% after factoring in: [1] some declines in the BT account, going forward, and [2] delay in the integration of
Comviva acquisition (impacting FY13 revenue).
Upgrading consolidated EPS estimates:
Sustaining current margins will be challenging post full quarter revenue
from HGS, and stronger growth from lower-margin emerging geographies. Accordingly, we have modeled
lower margins but our revised estimates are still higher by 127bp / 116bp for FY13 / FY14, after lower-than-
expected wage hike and higher-than-anticipated gains from cost optimization. This, along with 3.3% / 2.2%
upgrade in our EPS estimates for Satyam drives 2.8%/3.5% upgrade in our consolidated EPS estimates.
Buy with a target price of INR1,150:
We expect TECHM to post USD revenue CAGR of 12% and EPS CAGR of 22%
over FY12-14.
Buy
with a target price of INR1,150 (11x FY14E EPS).
Ashish Chopra
(Ashish.Chopra@MotilalOswal.com); +91 22 3982 5424
Investors are advised to refer through disclosures made at the end of the Research Report.

Tech Mahindra
Operating performance for 2QFY13 better than expected on traction in
non-BT business, cost optimization; PAT in-line on higher forex loss
Revenue grew 6.4% QoQ to USD299m (v/s our estimate of USD294m). Of the
incremental revenue of USD18m, USD13.3m came from ~1 month revenue from
HGS acquisition.
USD revenue increased 6.4% QoQ on the back of one month of HGS revenue
Source: Company, MOSL
Revenue from BT declined 3.8% QoQ, while organic growth in the non-BT segment
was 4.8% QoQ.
BT revenue declined 3.8% QoQ; further declines anticipated
Source: Company, MOSL
In INR terms, revenue was INR16.3b, in line with our estimate of INR16.2b. Though
USD revenue was higher than estimated, currency realization was INR54.5/USD
v/s our assumption of INR55.5/USD.
EBITDA margin was 20.7%, down 70bp QoQ, but higher than our estimate of 18.9%.
While wage hikes (6% offshore and 2% onsite) impacted margins by 150bp and
HGS integration by another 30bp, the company cushioned the decline through
continued cost optimization measures.
6 November 2012
2

Tech Mahindra
EBITDA margin decline of only 70bp despite wage
hikes and integration of HGS was a positive surprise
Continued cost optimization helped cushion margin headwinds
Source: Company, MOSL
Other income was (-)INR649m, lower than our estimate of (-)INR123m on account
of higher forex losses. Also, tax rate for the quarter was just 12% due to refunds
from the UK and Netherlands. Adjusting for the refunds, tax rate would have
been in-line at 23-24%.
PAT before share of Satyam’s profits was INR17.7b, nearly in line with our estimate
of INR17.2b, as higher operating margin and lower tax rate were offset by higher
forex losses. Including share of profits from Satyam, PAT was INR2.96b v/s our
estimate of INR2.92b.
Bagged two large deals; sustaining margins at current levels to be challenging
TECHM announced two wins, both in Europe – one with a TCV of USD100m over
five years, and the other from UK, with a TCV of USD70m-80m.
Operating margin surprised yet again, on the back of continued cost optimization,
as the company endeavors to drive higher profitability in low margin yielding
accounts. While we expect margins to remain in a higher band than our earlier
estimates, sustaining current margin levels will be challenging given: [1] full
quarter of lower-margin HGS revenue in 3QFY13 (margins in HGS are in low-mid
teens; HGS will contribute ~13% to revenue), and [2] growth remains healthy in
the lower-margin emerging markets as compared to the developed markets (US
and Europe grew 5% QoQ in 2QFY13, while RoW grew 12% QoQ).
BPO headcount now similar to IT Services headcount
after HGS integration
Share of revenue from RoW has steadily increased
Source: Company, MOSL
6 November 2012
3

Tech Mahindra
Management comments: Expect some declines in BT revenue; pursuing
deals in pipeline but closures taking long
BT revenue:
Revenue from BT declined 3.8% QoQ in 2QFY13, and the management
cited possibility of further declines, going forward. This is on account of BT’s
continued restructuring activity, though the quantum of decline in BT will only be
clearer in the coming quarters. While revenue run rate from BT has declined in
the recent quarters, TECHM’s share of BT’s wallet has increased by 2%.
Deal pipelines:
TECHM closed two large deals in Europe during the quarter, and
continues to chase a few more in the pipeline, each with a TCV of USD50m-150m.
However, deal closures are taking longer than the company had earlier expected.
Comviva acquisition:
The integration of Comviva remains subject to regulatory
approvals. While the timing cannot be ascertained due to the dependency on
regulators, it could happen by the end of November.
Headcount:
Ex-HGS, there was a drop in headcount during the quarter, as a result
of rationalization in domestic employees. The company continues with its just-
in-time hiring policy, and expressed comfort in recruiting laterals on a need basis.
3% / 5.7% downward revision in revenue on BT caution, 2.8% / 3.5% upgrade
in consolidated EPS on operating margin and Mahindra Satyam upgrades
We have moderated our USD revenue assumptions for FY13 / FY14 by 3% / 5.7%
after factoring in: [1] some declines in the BT account, going forward, and [2]
delay in the integration of Comviva acquisition (impacting FY13 revenue).
While we have modeled lower margins going forward than 2Q, our revised
estimates are still higher than our previous estimates by 127bp / 116bp for FY13 /
FY14, after lower-than-expected wage hike and higher-than-anticipated gains
from cost optimization. This, along with 3.3% / 2.2% upward revision in our EPS
estimates for Mahindra Satyam drives 2.8% / 3.5% upgrade in our consolidated
EPS estimates for TECHM.
We expect TECHM to post USD revenue CAGR of 12% and EPS CAGR of 22% over
FY12-14.
Buy
with a target price of INR1,150 (11x FY14E EPS).
Change in Estimates
Revised
FY13E
FY14E
53.8
53.0
1,259
1,461
20.2
18.7
89.6
104.5
Earlier
FY13E
54.5
1,300
18.9
87.2
FY14E
53.1
1,549
17.6
101.0
Change (%)
FY13E
FY14E
-1.4
-0.2
-3.1
-5.7
127bp
116bp
2.8
3.5
Source: MOSL
INR/USD
USD Revenue - m
EBIDTA Margin (%)
EPS (INR)
Other results highlights
6 November 2012
Utilization including trainees was flat QoQ at 74% (in line). Excluding trainees,
utilization declined 1pp QoQ to 77%.
Attrition rate during the quarter was 16%, much improved from 19% in 1QFY13.
Revenue from top 2-10 clients increased 11% QoQ.
Number of USD50m+ clients increased to 3 (v/s 2 in the last quarter).
Capex during the quarter was INR293m (INR273m in 1QFY13).
As at September 2012, the company has USD573m hedges at a strike rate of INR54.1/
USD and GBP261m at a strike rate of INR86/GBP.
Receivable days increased by 2 to 100.
Net debt increased by INR3.2b to INR9.3b due to acquisitions of HGS and Comviva.
4

Tech Mahindra
Takeaways from Mahindra Satyam’s 2QFY13 results
2QFY13 EBITDA margin surprises positively:
Mahindra Satyam (SCS) posted
revenue growth of 3.5% QoQ for 2QFY13 to USD354m. Constant currency revenue
growth of 3.2% QoQ to USD353m was in line with our estimate. Despite wage
hikes, EBITDA margin declined just 20bp QoQ (v/s our estimate of 210bp QoQ
decline) to 21.5%, a key positive during the quarter. This was led by [1] lower
wage hikes of 6% offshore and 1.5% onsite (v/s our estimate of 8%/2%), and [2]
subcontractor cost rationalization.
PAT lower than expected:
PAT at INR2.78b was lower than our estimate of INR2.9b
despite higher EBITDA margin, lower depreciation (INR428m v/s our estimate of
INR508m) and lower tax rate (24.9% v/s our estimate of 27%), primarily on account
of forex losses of INR859m.
Strong momentum in Manufacturing vertical, US geography:
The Manufacturing
vertical continued its strong momentum, up 6.6% QoQ (after 9.5% QoQ growth in
1Q), constituting 63% of incremental revenue in 2QFY13. Among geographies,
US retained its momentum, up 5.5% QoQ (after 9.1% QoQ growth in 1Q),
contributing 83% to incremental revenue.
Management maintains cautious outlook:
While the management retained its
cautious outlook on the environment, we note following citations that bode
well for the company’s revenue growth, going forward: [1] definite improvement
in the number of deals that SCS is getting invited for, [2] uptick in the win ratios
v/s a year ago, and [3] much higher deal flows as compared to last year (though
decision cycles are stretched).
Operating margin continued to surprise positively; constant currency
revenue in-line; PAT below estimate on forex losses
Revenue grew 3.5% QoQ to USD354m (v/s our estimate of USD352m). In constant
currency terms, revenue grew 3.2% QoQ to USD353m.
In INR terms, revenue grew 3.1% QoQ to INR19.4b (v/s our estimate of INR19.55b).
Realized currency rate during the quarter was INR54.7/USD (v/s our estimate of
INR55.5/USD).
Constant currency USD revenue growth in line with estimate
Source: Company, MOSL
6 November 2012
5

Tech Mahindra
EBITDA margin declined just 20bp QoQ to 21.5% (v/s our estimate of 210bp QoQ
decline to 19.6%) – a key positive surprise, driven by lower than estimated wage
hikes and subcontractor cost rationalization.
Operating margin remained higher than estimated – a key positive
Source: Company, MOSL
PAT at INR2.78b was lower than our estimate of INR2.9b, primarily on account of
lower other income (INR3m v/s our estimate of INR731m). The delta in other
income was due to forex losses of INR859m (v/s forex gain of INR665m in 1QFY13).
Manufacturing, Retail and BFSI drive growth among verticals; Americas the
fastest growing geography
Across verticals and geographies, performance was a mixed bag. Among verticals,
Retail grew the fastest (+13% QoQ), followed by BFSI (+9% QoQ). Manufacturing
too, grew at an impressive 6.6% QoQ, constituting 63% of the quarter’s incremental
revenue (after 9.5% QoQ growth in 1QFY13). Healthcare & Life Sciences declined
11.2% QoQ on a lower base, after having grown 20% QoQ in 1QFY13, and Tech /
Media / Entertainment was soft (-1.4% QoQ).
Contribution
to Rev. (%)
35
20
20
12
6
7
Growth
QoQ (%)
6.6
(1.4)
9.0
13.0
(11.2)
(9.4)
Contr to
incr. rev (%)
63.2
(8.2)
48.2
40.2
(22.2)
(21.2)
Manufacturing, BFSI, Retail strong; Healthcare, Life Sciences lagged
Verticals
Manufacturing
Tech, Media and Entertainment
BFSI
Retail, T&L
HC & Life Sciences
Others
Among geographies, US drove growth (+5.5% QoQ), contributing 83% of
incremental revenue (on the back of 9.1% QoQ growth in 1Q), followed by Europe
(+3.5% QoQ). RoW was soft for the second consecutive quarter, with revenue
declining 0.8% QoQ after 1% decline in 1Q.
Contribution
to Rev. (%)
55
22
23
Growth
QoQ (%)
5.5
3.5
(0.8)
Contr to
incr. rev (%)
83.2
22.0
(5.2)
Source: Company, MOSL
6
US drove growth among geographies, RoW declined QoQ
Geographies
Americas
Europe
ROW
6 November 2012

Tech Mahindra
Higher than estimated EBITDA margin driven by lower than estimated wage
hikes and subcontractor costs; deal win ratios have improved
EBITDA margin was 190bp higher than estimated – a function of [1] lower than
anticipated wage hikes: 1.5% onsite and 6% offshore v/s our estimates of 2%
onsite and 8% offshore (wage hikes had a negative impact of 100bp), and [2]
squeezing of subcontractor costs.
We have upgraded our EBIT margin estimates for FY13/14 by 203bp/148bp on lower
than estimated cost base set by lower wage hikes and commentary around
continued exercising of levers to sustain profitability. Key margin levers include
employee pyramid and utilization.
While our revenue estimates have seen little change post the results, tracking
the management’s cautious outlook on the environment, the following citations
bode well for revenue growth: [1] definite improvement in the number of deals
that SCS is getting invited for, [2] uptick in the win ratios v/s a year ago, and [3]
much higher deal flows as compared to last year (though decision cycles are
stretched).
Upgrading EPS estimates by 2.2-3.3% on improved profitability outlook
Our revenue estimates are largely unchanged post 2QFY13 results. Our EBIT margin
estimates for FY13 / FY14 are higher by 173bp / 86bp on the back of: [1] lower cost
base set by lower than estimated wage hikes, and [2] management guidance of
lower depreciation, going forward. Consequently, our EPS estimates are higher
by 3.3% for FY13 and 2.2% for FY14.
Revised
FY13E
FY14E
Earlier
FY13E
54.6
1,427
17.6
10.5
FY14E
53.1
1,587
17.3
11.0
Change (%)
FY13E
FY14E
-1.3
0.4
173bp
3.3
-0.2
0.5
86bp
2.2
Source: MOSL
Change in Estimates
INR/USD
USD Revenue (m)
EBIT Margin (%)
EPS (INR)
53.9
1,433
19.3
10.9
53.0
1,595
18.2
11.2
Other results highlights
6 November 2012
Cash and cash equivalents at the end of the quarter were INR30.6b.
Revenue from fixed price contracts increased by 1pp QoQ to 49%.
The company ended the quarter with 363 active clients, lower than 372 in the
previous quarter.
There was gross addition of 38 new clients during the quarter (v/s 50 in 1QFY13),
including 6 marquee accounts.
Net headcount increased by 791 employees in 2Q (v/s our estimate of 250
additions), taking total headcount to 36,787. Technical headcount increased by
465 employees to 26,543 (v/s our estimate of 181 additions).
Attrition rate declined by 1pp QoQ to 13.1%.
Net utilization including trainees was flattish at 72.3% (in line with our estimate).
DSO (including unbilled revenue) improved by 3 days QoQ to 92.
Outstanding hedge book stands at USD204m, at an average strike rate of INR55.3/
USD. The hedges cover 25% of the company’s net inflows over the next two years.
Capex during the quarter was INR321m.
7

Tech Mahindra
Tech Mahindra: an investment profile
Company description
Tech Mahindra (TECHM) is part of the USD12.5b Mahindra
Group. It is one of India’s largest software exporters and
serves telecom service providers, equipment
manufacturers, software vendors and systems
integrators. It has offices in over 13 countries, employs
over 50,000 people, and its key clients include British
Telecom (BT) and AT&T.
Recent developments
TECHM and Royal KPN NV (KPN) entered into a
partnership to further improve KPN’s efficiency and
effectiveness in its IT environment and operational
processes, and jointly address strategic growth areas.
Won a multi-year multi-million dollar managed
services contract from a leading Telco in UK.
Valuation and view
We expect TECHM to post USD revenue CAGR of 12%
and EPS CAGR of 22% over FY12-14.
TECHM trades at 10.7x FY13E and 9.1x FY14E EPS.
Buy
with a target price of INR1,150 (11x FY14E EPS).
Key investment arguments
Satyam’s acquisition will help TECHM to diversify its
client base and industry focus.
Large deals like those of Bharti and a gradual revival
in the Telecom vertical will help volume growth.
Emerging market telco rollouts and domestic BPO
deals would be key growth contributors.
Sector view
In the last few months, increasingly weak
macroeconomic data has been emanating from both
the US and Europe, which implies deceleration in
growth for Indian IT Services.
CY12 budget spends have faced challenges, with
continued delays in deal closures and in ramp-ups.
We reckon frontline Indian IT companies would be
better placed to sail through the near-term
challenges mentioned above. Niche IT/ITeS
companies with strong business models are also
likely to be better placed to face uncertainties in
the near term.
Key investment risks
TECHM is dependent on a single vertical, Telecom,
and has high client concentration (BT is 33% of
revenue).
Revenue from BT is likely to decline, going forward,
which could hurt growth.
Growth is skewed towards lower margin services like
new telco rollouts and domestic BPOs.
Comparative valuations
FY13E
FY14E
P/BV (x)
FY13E
FY14E
EV/Sales (x)
FY13E
FY14E
EV/EBITDA (x) FY13E
FY14E
* YE Oct; # YE Jun
P/E (x)
Tech Mahindra
10.7
9.1
2.2
1.6
2.2
1.6
8.2
7.2
HCLT#
12.6
12.1
3.1
2.6
1.6
1.3
7.8
7.2
Mphasis*
10.7
10.9
1.8
1.6
1.1
1.0
5.8
5.5
EPS: MOSL forecast v/s consensus (INR)
MOSL
Forecast
89.6
104.5
Consensus
Forecast
83.4
89.1
Variation
(%)
7.5
17.2
FY13
FY14
Target price and recommendation
Current
Price (INR)
955
Target
Price (INR)
1,150
Upside
(%)
20.4
Reco.
Buy
Stock performance (1 year)
Shareholding pattern (%)
Sep-12
Promoter
Domestic Inst
Foreign
Others
6 November 2012
56.7
18.7
15.5
9.2
Jun-12
70.8
14.8
6.3
8.2
Sep-11
71.0
15.3
4.8
8.9
8

Tech Mahindra
Financials and Valuation
6 November 2012
9

Disclosures
This report is for personal information of the authorized recipient and does not construe to be any investment, legal or taxation advice to you. This research report does not constitute an offer, invitation or inducement
to invest in securities or other investments and Motilal Oswal Securities Limited (hereinafter referred as MOSt) is not soliciting any action based upon it. This report is not for public distribution and has been
furnished to you solely for your information and should not be reproduced or redistributed to any other person in any form.
Unauthorized disclosure, use, dissemination or copying (either whole or partial) of this information, is prohibited. The person accessing this information specifically agrees to exempt MOSt or any of its affiliates
or employees from, any and all responsibility/liability arising from such misuse and agrees not to hold MOSt or any of its affiliates or employees responsible for any such misuse and further agrees to hold MOSt
or any of its affiliates or employees free and harmless from all losses, costs, damages, expenses that may be suffered by the person accessing this information due to any errors and delays.
The information contained herein is based on publicly available data or other sources believed to be reliable. While we would endeavour to update the information herein on reasonable basis, MOSt and/or its
affiliates are under no obligation to update the information. Also there may be regulatory, compliance, or other reasons that may prevent MOSt and/or its affiliates from doing so. MOSt or any of its affiliates or
employees shall not be in any way responsible and liable for any loss or damage that may arise to any person from any inadvertent error in the information contained in this report . MOSt or any of its affiliates
or employees do not provide, at any time, any express or implied warranty of any kind, regarding any matter pertaining to this report, including without limitation the implied warranties of merchantability, fitness
for a particular purpose, and non-infringement. The recipients of this report should rely on their own investigations.
This report is intended for distribution to institutional investors. Recipients who are not institutional investors should seek advice of their independent financial advisor prior to taking any investment decision
based on this report or for any necessary explanation of its contents.
MOSt and/or its affiliates and/or employees may have interests/positions, financial or otherwise in the securities mentioned in this report. To enhance transparency, MOSt has incorporated a Disclosure of Interest
Statement in this document. This should, however, not be treated as endorsement of the views expressed in the report.
Disclosure of Interest Statement
1. Analyst ownership of the stock
2. Group/Directors ownership of the stock
3. Broking relationship with company covered
4. Investment Banking relationship with company covered
Tech Mahindra
No
No
No
No
Analyst Certification
The views expressed in this research report accurately reflect the personal views of the analyst(s) about the subject securities or issues, and no part of the compensation of the research analyst(s) was, is, or
will be directly or indirectly related to the specific recommendations and views expressed by research analyst(s) in this report. The research analysts, strategists, or research associates principally responsible
for preparation of MOSt research receive compensation based upon various factors, including quality of research, investor client feedback, stock picking, competitive factors and firm revenues.
Regional Disclosures (outside India)
This report is not directed or intended for distribution to or use by any person or entity resident in a state, country or any jurisdiction, where such distribution, publication, availability or use would be contrary to
law, regulation or which would subject MOSt & its group companies to registration or licensing requirements within such jurisdictions.
For U.K.
This report is intended for distribution only to persons having professional experience in matters relating to investments as described in Article 19 of the Financial Services and Markets Act 2000 (Financial
Promotion) Order 2005 (referred to as "investment professionals"). This document must not be acted on or relied on by persons who are not investment professionals. Any investment or investment activity to
which this document relates is only available to investment professionals and will be engaged in only with such persons.
For U.S.
MOSt is not a registered broker-dealer in the United States (U.S.) and, therefore, is not subject to U.S. rules. In reliance on the exemption from registration provided by Rule 15a-6 of the U.S. Securities Exchange
Act of 1934, as amended (the "Exchange Act") and interpretations thereof by the U.S. Securities and Exchange Commission ("SEC") in order to conduct business with Institutional Investors based in the U.S.,
Motilal Oswal has entered into a chaperoning agreement with a U.S. registered broker-dealer, Marco Polo Securities Inc. ("Marco Polo"). Any business interaction pursuant to this report will have to be executed
within the provisions of this Chaperoning agreement.
This report is intended for distribution only to "Major Institutional Investors" as defined by Rule 15a-6(b)(4) of the Exchange Act and interpretations thereof by SEC (henceforth referred to as "major institutional
investors"). This document must not be acted on or relied on by persons who are not major institutional investors. Any investment or investment activity to which this document relates is only available to major
institutional investors and will be engaged in only with major institutional investors.
The Research Analysts contributing to the report may not be registered /qualified as research analyst with FINRA. Such research analyst may not be associated persons of the U.S. registered broker-dealer, Marco
Polo and therefore, may not be subject to NASD rule 2711 and NYSE Rule 472 restrictions on communication with a subject company, public appearances and trading securities held by a research analyst account.
Motilal Oswal Securities Ltd
Motilal Oswal Tower, Level 9, Sayani Road, Prabhadevi, Mumbai 400 025
Phone: +91 22 3982 5500 E-mail: reports@motilaloswal.com