15 November 2012
2QFY13 Results Update | Sector: Financials
Power Finance Corporation
BSE SENSEX
S&P CNX
18,670
Bloomberg
Equity Shares (m)
52-Week Range (INR)
1,6,12 Rel.Perf.(%)
M.Cap. (INR b)
M.Cap. (USD b)
5,684
POWF IN
1319.9
224/131
-8/19/6
250.8
4.7
CMP: INR190
TP: INR220
Buy
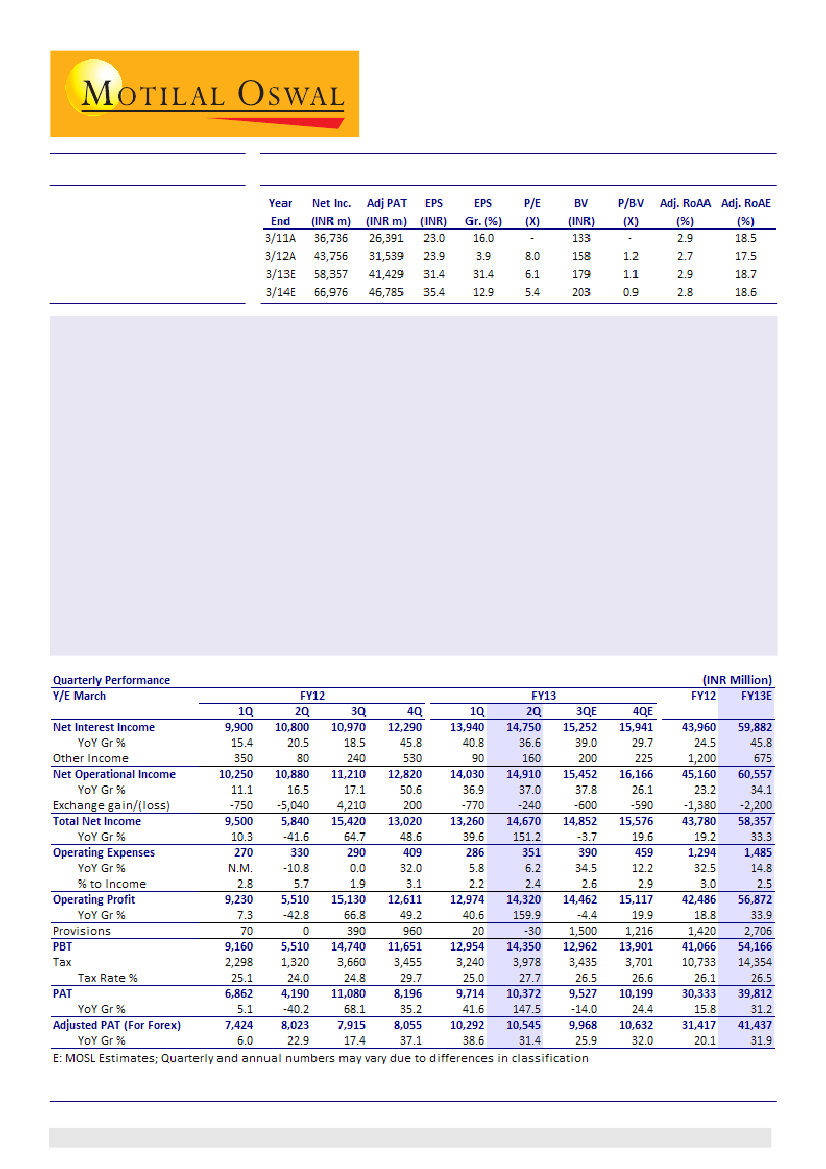
Power Finance Corp's (POWF) 2QFY13 reported PAT grew 147% YoY (lower base due to high forex loss in 2QFY12)
and 7% QoQ to INR10.4b (12% above est of INR9.3b), led by healthy asset growth and better than expected
margin performance. Asset quality remained stable.
Key highlights:
NII grew by 37% YoY and 6% QoQ to INR14.8b (5% above est) as reported NIMs improved 9bp QoQ to 4.28%.
Loans offered to discoms (as Transitional Finance) are at higher lending rates, thereby boosting yields (+27bp
QoQ), which outpaced a 16bp QoQ increase in the cost of funds during the quarter.
Loans grew 27% YoY and 4% QoQ to INR1.4t driven by generation segment loans, which too grew at a similar
pace, contributing 84% of incremental loans YoY . Loans to private sector grew much faster (+77% YoY and +9%
QoQ) resulting in an increase in the share of private sector loans to 12.2% from 11.7% QoQ, 8.7% YoY.
Asset quality remained stable QoQ, with %GNPAs at ~1% levels and provision coverage steady QoQ at ~11%.
With the intent to adhere to prudential NBFC norms, company has planned to make standard asset provisions
from 3QFY13 onwards. POWF plans to make 8bp provision in 2HFY13 and FY14 each, followed by remaining
9bp provision in FY15 to achieve cumulative 25bp standard asset provisioning.
Valuation and view:
POWF continues to grow at a rapid pace despite challenging macro environment in general
and multiple headwinds for the power sector in specific. Though the asset quality remained healthy so far, we
believe it will remain a key monitorable in the current environment. Stock trades at 0.9x FY14E BV.
Buy.
Umang Shah
(Umang.Shah@MotilalOswal.com) + 9122 3982 5521
Alpesh Mehta
(Alpesh.Mehta@MotilalOswal.com) + 91 22 3982 5415
Investors are advised to refer through disclosures made at the end of the Research Report.

Power Finance Corporation
Quarterly performance v/s estimates and reasons for deviation (INR m)
Y/E March
2QFY13E
14,031
29.9
150
14,181
30
-600
13,581
132.5
375
13.6
2.8
13,206
139.7
500
12,706
3,431
27.0
9,275
121.4
2QFY13A
14,750
36.6
160
14,910
37
-240
14,670
151.2
351
6.2
2.4
14,320
159.9
-30
14,350
3,978
27.7
10,372
147.5
Vs Est.
5
7
5
-60
8
-7
Curr. appreciation led to lower forex loss
Comments
Healthy loan growth and QoQ margin improvement led to higher
than est. NII
Net Interest Income
YoY Gr %
Other Op. Inc.
Net Op. Inc.
YoY Gr %
Exch. Gain/(Loss)
Total Net Income
YoY Gr %
Operating Expenses
YoY Gr %
% to Income
Operating Profit
YoY Gr %
Provisions
PBT
Tax
Tax Rate %
PAT
YoY Gr %
Operating expenses remain under control
8
-106
13
16
12
Stable asset qlty led to provision writeback
Strong topline growth and lower provisions
led to higher than est. bottomline growth
Source: Company, MOSL
Strong growth and sequential margin improvement led to higher NII growth
NII for the quarter grew strongly by 37% YoY and 6% QoQ to INR14.8b (5% above est.)
on the back of healthy asset growth coupled with a 9bp QoQ increase in the reported
NIM to 4.28%. This was driven by 27bp QoQ improvement in yields to 11.98%, led by
incremental loans offered to discoms (under Transitional Financing mechanism) at
higher lending rates. Meanwhile, the increase in cost of borrowings was contained at
16bp QoQ to 9.24%. Borrowings grew by 30% YoY and 4% QoQ to INR1.18t. Incremental
loans and borrowings for quarter stood at INR60.8b and INR40.1b respectively, which
too aided margin expansion.
Sanctions and disbursements grow strongly led by Transitional Finance
provided to Discoms
Sanctions continued to remain volatile and after a sharp decline in 1QFY13, it grew
multifold (+107% YoY and 181% QoQ) in 2QFY13 to INR315b. For 1HFY13, sanctions
grew 33% YoY. Incrementally, ~60% of sanctions were made to discoms under the
Transitional Finance Mechanism to fill their funding gap, which led to a stupendous
sanctions growth during the quarter. POWF provided Transitional Finance to six major
discoms. Outstanding sanctions pipeline increased 6% QoQ to INR1.95t.
While the discoms have not yet accepted the Financial Restructuring Plan (FRP), the
sanctions have been made based on some of the stringent conditions mentioned in
the FRP. Disbursement grew 18% YoY, 25% QoQ to INR102b again led by higher
disbursements to discoms as a part of Transitional Finance. Incrementally, ~20%+
disbursements made to discoms were under this scheme. As a result, disbursements
to state entities grew 35% YoY and 30% QoQ and formed 75% of the incremental
disbursements.
15 November 2012
2

Power Finance Corporation
Asset quality remains stable; POWF to make standard asset provisions from
3QFY13 onwards
Asset quality remained stable as GNPAs remained largely stable QoQ at INR13.6b.
Provision coverage ratio remained stable QoQ at ~11%. During the quarter, there was
provision write back to the tune of INR30m v/s a provision of INR20m in 1QFY13. With
the intent to adhere to prudential NBFC norms, company has planned to make
standard asset provisions from 3QFY13 onwards. POWF plans to make 8bp provision
in 2HFY13 and FY14 each, followed by remaining 9bp provision in FY15 to achieve
cumulative 25bp standard asset provisioning.
Concall highlights
Growth
Growth momentum is expected to remain healthy.
Post strong sanctions / disbursements growth due to Transitional Finance provided
to discoms, the management maintained a 20-25% growth guidance for FY13.
Transitional Finance
On a YTD basis, POWF has so sanctioned INR190b and disbursed INR55b under
the Transitional Finance Mechanism mainly to six major discoms - UP, Rajasthan,
Punjab, Haryana, AP and Tamil Nadu. No disbursements have been made to the
states of AP and Punjab as yet.
The funding is provided based on the state government guarantees to all the
discoms and the average lending rate stood at 12.5-13%.
Margins
In terms of asset re-pricing, loans worth INR190b and INR260b are expected to
get re-priced during 2HFY13 and FY14 respectively. Meanwhile, borrowings worth
INR230b and INR40b are expected to re-price during 2HFY13 and FY14
respectively.
The management expects cost of borrowings to decline in 2HFY13 due to
expected decline in systemic interest rates coupled with shift in borrowing mix
towards foreign currency borrowings and tax free bonds, which will help control
cost of funds.
Asset quality
15 November 2012
Asset quality is expected to remain healthy and the management does not
foresee any major risks to asset quality currently.
Given the strong improvement in profitability in the current fiscal, the
management has planned to start making standard asset provisions to the tune
of 0.08% every year starting 2HFY13, to achieve a cumulative 0.25% standard
asset provision cover by FY15.
Of the total 0.08% standard asset provisions to be made during 2HFY13,
POWF plans to make 0.06% standard asset provisions in 3QFY13 and 0.02% in
4QFY13.
On the other hand, the company will continue to maintain reserves for bad and
doubtful debts, which stood at ~11.6b as on FY12.
POWF's outstanding exposure to Suzlon stood at ~INR9.3b and to Lanco Group
stood at ~INR30b - disbursed amount out of total exposure of ~INR50b.
Outstanding restructured loans on the balance sheet stood at ~INR31b.
3

Power Finance Corporation
Valuation and view
POWF continues to grow at a rapid pace despite challenging macro environment
in general and multiple headwinds for sector in specific. Though the outstanding
sanctions pipeline remains strong at INR1.95t (1.4x of o/s loans), disbursement /
loan growth momentum could moderate given the issues in the sector.
While the MoP has announced Financial Restructuring Plan for SEBs, we believe
execution will be key to the success of this plan and cash flows of SEBs will depend
on its effective implementation. Asset quality will remain a key monitorable.
We expect POWF to report Adjusted EPS of INR31 for FY13 and INR35 for FY14.
Book value is expected to be INR179 and INR203 respectively. During FY12/13, we
expect the company to report average adjusted RoA of ~2.8% and average ROE of
18%+. While headwinds over growth and asset quality persists, current valuations
of 1.1x FY13E BV and 0.9x FY14E BV largely discounts the same. Maintain
Buy
with
a target price of INR220 (1.1x of FY14E BV).
We revise our estimates upwards for FY13/14 (INR b)
Old
NII
Other Income
Total Income
Forex gain/(loss)
Total inc (post forex)
Operating Exps
Operating Profits
Provisions
PBT
Tax
Adj. PAT
Adj. RoA
Adj. RoE
FY13
56.3
0.7
57.0
-2.5
54.5
1.5
53.0
2.5
50.5
13.4
38.9
2.8
17.6
FY14
63.3
0.8
64.1
-2.5
61.6
1.9
59.7
3.5
56.2
14.9
43.2
2.7
17.4
Revised
FY13
FY14
59.9
68.4
0.7
0.8
60.6
69.2
-2.2
-2.2
58.4
67.0
1.5
1.8
56.9
65.2
2.7
3.8
54.2
61.5
14.4
16.3
41.4
46.8
2.9
2.8
18.7
18.6
Change (%)
FY13
FY14
6.4
8.1
-3.6
-6.2
6.2
7.9
-12.0
-12.0
7.1
8.7
-4.0
-4.9
7.4
9.2
8.3
7.5
7.3
9.3
7.3
9.3
6.4
8.3
Source: MOSL
POWF: One year forward P/E
POWF: One year forward P/BV
15 November 2012
4

Power Finance Corporation
Quarterly trends
Loan growth remains strong
Sanctions and disbursals pick up led by Transitional Finance
Strong traction in the generation segment (+27% YoY and
4% QoQ) led to higher loan growth
Sanctions grew multi-fold both YoY and QoQ , while
disbursements grew 18% YoY and 25% QoQ led by
Transitional Finance provided to discoms
YoL improved QoQ leading to margin expansion (%)
Loan Mix: Share of generation seg. Increases QoQ (%)
Reported NIMs improved 9bp QoQ to 4.28% led by a 27bp
QoQ increase in yield on loans
Segment-wise loan mix remained largely stable during the
quarter
Loan Mix: Share of private sector loans continues to rise (%)
Borrowing Profile (%)
Share of private sector loans continued to increase as it
grew faster than overall loans (up 77% YoY and 9% QoQ)
Proportion of bonds declines QoQ; while that of short term
loans increased, but remains volatile
15 November 2012
5

Power Finance Corporation
Quarterly Snapshot
FY12
1Q
Profit and Loss (INR m)
Net Interest Income
9,900
Other Income (Incl fees)
350
Exchange gain / loss
-750
Net total income
9,500
Operating Expenses
270
Employee
194
Others
76
Operating Profits
9,230
Provisions
70
PBT
9,160
Taxes
2,298
PAT
6,862
Extra-orinary/ Other adj.
420
Adj. PAT
7,282
Asset Quality
GNPA
2,380
NNPA
2,060
Gross NPAs (%)
0.23
Net NPAs (%)
0.20
PCR (%)
13.4
Ratios (%)
Cost to Income
2.8
Provision to operating profit 0.8
Tax Rate
25.1
Total CAR
18.9
Margins Reported - Quarterly (%)
Yield on Loans
11.1
Cost of Funds
8.8
Spreads
2.3
NIMs
3.9
Margins Reported - Cumulative (%)
Yield on Loans
11.1
Cost of Funds
8.8
Spreads
2.3
NIMs
3.9
Balance Sheet Data (INR b)
Shareholders Funds
193
Borrowings
865
DTL
1
Interest subsidy funds
4
R APDRP Fund from GOI
0
Current Liability & Provisions 36
Total Liabilities
1,099
Loans (Incl Int accrued)
1,041
Investments
1
Fixed Assets
1
Current Assets
57
Total Assets
1,099
2Q
10,800
80
-5,040
5,840
330
175
155
5,510
0
5,510
1,320
4,190
3,910
8,100
2,380
2,060
0.22
0.19
13.4
5.7
0.0
24.0
18.2
11.3
9.1
2.2
4.0
11.2
8.9
2.3
3.9
197
911
1
4
0
34
1,147
1,104
1
1
41
1,147
3Q
10,970
240
4,210
15,420
290
176
114
15,130
390
14,740
3,660
11,080
-3,339
7,741
6,330
5,620
0.54
0.48
11.2
1.9
2.6
24.8
17.9
11.3
9.1
2.2
3.9
11.2
9.0
2.2
3.9
208
999
1
4
0
36
1,248
1,180
1
1
58
1,248
4Q
12,290
530
200
13,020
409
175
234
12,611
960
11,651
3,455
8,196
-185
8,011
13,580
12,150
1.04
0.93
10.5
3.1
7.6
29.7
16.3
11.3
9.0
2.3
3.9
11.3
9.0
2.3
3.9
207
1,101
1
4
0
43
1,356
1,301
1
1
49
1,356
FY13
1Q
13,940
90
-770
13,260
286
189
97
12,974
20
12,954
3,240
9,714
571
10,285
13,750
12,300
1.02
0.91
10.5
2.2
0.2
25.0
18.6
11.7
9.1
2.6
4.2
11.7
9.1
2.6
4.2
217
1,140
1
4
0
45
1,406
1,347
1
1
51
1,406
2Q
Variation (%)
Cumulative Numbers
QoQ
YoY 1HFY12 1HFY13 YoY Gr (%)
6
78
-69
11
23
2
62
10
NM
11
23
7
-18
5
-1
-1
37
100
-95
151
6
10
2
160
NM
160
201
148
-88
34
472
491
20,700
430
-5,790
15,340
600
369
231
14,740
70
14,670
3,618
11,052
4,330
15,382
28,690
250
-1,010
27,930
636
382
254
27,294
-10
27,304
7,218
20,086
1,041
21,127
39
-42
-83
82
6
3
10
85
-114
86
99
82
-76
37
14,750
160
-240
14,670
351
193
157
14,320
-30
14,350
3,978
10,372
470
10,842
13,620
12,170
0.97
0.86
10.6
2.4
-0.2
27.7
17.7
12.0
9.2
2.7
4.3
11.8
9.2
2.7
4.2
227
1,180
1
4
0
47
1,458
1,408
1
1
41
1,458
3.9
0.5
24.7
18.2
27
16
11
9
13
8
5
4
5
4
0
-3
NM
5
4
5
0
0
-20
4
69
16
53
31
65
23
42
32
15
30
6
-13
NM
37
27
28
9
0
0
27
2.3
0.0
26.4
17.7
15 November 2012
6

Power Finance Corporation
Quarterly Snapshot (INR b)
FY11
1Q
Business Details (INR b)
Sanctions
Disbursements
Loans
Borrowings
Sanctions discipline wise
Generation
Transmission
Distribution
R APDRP
Others
Disburs. discipline wise
Generation
Transmission
Distribution
R APDRP
Others
Disburs. borrower wise
State
Central PSUs
Joint Sector
Private
Loans discipline wise
Generation
Transmission
Distribution
Others
Loans borrower wise
State
Central PSUs
Joint Sector
Private
Borrowing mix
Domestic Bonds
Foreign Bonds
Term Loans
(Incl Rupee and foreign)
Short term loans
144
81
856
716
144
58
31
1
22
32
81
47
4
3
2
25
81
43
17
4
17
856
706
65
36
50
856
565
166
69
57
716
522
8
182
3
2Q
297
63
879
736
297
230
3
1
58
5
63
41
6
4
6
6
63
49
5
3
7
879
733
64
38
44
879
580
168
71
60
736
534
8
191
2
3Q
178
78
920
764
178
125
3
0
43
7
78
56
9
4
2
8
78
54
13
4
7
920
778
71
41
30
920
601
179
74
66
764
555
8
192
10
4Q
158
119
996
856
158
127
7
1
13
9
119
80
6
8
13
12
119
80
25
7
6
996
843
76
47
30
996
645
203
80
68
856
561
8
224
63
1Q
169
62
1,041
865
169
110
12
0
37
11
62
48
5
4
1
4
62
42
5
4
12
1,041
880
79
49
32
1,041
672
206
84
79
865
609
8
211
36
2Q
152
87
1,104
911
152
100
1
44
0
6
87
60
7
3
5
12
87
57
8
4
18
1,104
929
83
50
42
1,104
709
212
86
97
911
695
0
200
15
FY12
3Q
155
106
1,180
999
155
69
4
0
47
34
106
74
8
4
7
13
106
67
15
4
20
1,180
992
89
53
46
1,180
749
225
90
116
999
753
0
203
43
4Q
195
159
1,302
1,101
195
140
9
6
12
27
159
96
12
6
3
43
159
97
26
4
32
1,302
1,074
99
57
72
1,302
815
247
93
147
1,101
848
0
212
41
1Q
112
81
1,344
1,140
112
83
11
9
0
8
81
72
3
3
3
1
81
59
2
9
11
1,344
1,136
100
58
50
1,344
841
245
101
157
1,140
920
0
FY13
2Q
315
102
1,404
1,180
315
66
30
1
9
208
102
60
4
3
5
29
102
77
4
4
17
1,404
1,182
102
59
60
1,404
884
244
104
171
1,180
913
0
Var. (%)
QoQ YoY
181
25
4
4
181
-21
173
-87
NM
NM
25
-17
57
-3
107
NM
25
30
114
-53
46
4
4
2
2
19
4
5
0
3
9
4
-1
NM
107
18
27
30
107
-34
NM
-97
NM
NM
18
0
-37
29
2
146
18
35
-47
15
-6
27
27
23
18
44
27
25
15
21
77
30
31
NM
209
219
5
10
10
47
359 208
Source: Company/MOSL
15 November 2012
7

Power Finance Corporation
Stock Info
EPS: MOSL forecast v/s consensus (INR)
MOSL
Forecast
31.4
35.4
Consensus
Forecast
28.4
32.7
Variation
(%)
10.8
8.3
1-year Sensex rebased
FY13
FY14
Shareholding pattern (%)
Promoter
Domestic Inst
Foreign
Others
Sep-12
73.7
9.4
10.3
6.6
Jun-12
73.7
9.5
9.8
6.9
Sep-11
73.7
10.1
6.6
9.6
15 November 2012
8

Power Finance Corporation
Financials and Valuations
15 November 2012
9

Power Finance Corporation
Financials and Valuations
15 November 2012
10

Power Finance Corporation
N O T E S
15 November 2012
11

Disclosures
This report is for personal information of the authorized recipient and does not construe to be any investment, legal or taxation advice to you. This research report does not constitute an offer, invitation or inducement
to invest in securities or other investments and Motilal Oswal Securities Limited (hereinafter referred as MOSt) is not soliciting any action based upon it. This report is not for public distribution and has been
furnished to you solely for your information and should not be reproduced or redistributed to any other person in any form.
Unauthorized disclosure, use, dissemination or copying (either whole or partial) of this information, is prohibited. The person accessing this information specifically agrees to exempt MOSt or any of its affiliates
or employees from, any and all responsibility/liability arising from such misuse and agrees not to hold MOSt or any of its affiliates or employees responsible for any such misuse and further agrees to hold MOSt
or any of its affiliates or employees free and harmless from all losses, costs, damages, expenses that may be suffered by the person accessing this information due to any errors and delays.
The information contained herein is based on publicly available data or other sources believed to be reliable. While we would endeavour to update the information herein on reasonable basis, MOSt and/or its
affiliates are under no obligation to update the information. Also there may be regulatory, compliance, or other reasons that may prevent MOSt and/or its affiliates from doing so. MOSt or any of its affiliates or
employees shall not be in any way responsible and liable for any loss or damage that may arise to any person from any inadvertent error in the information contained in this report . MOSt or any of its affiliates
or employees do not provide, at any time, any express or implied warranty of any kind, regarding any matter pertaining to this report, including without limitation the implied warranties of merchantability, fitness
for a particular purpose, and non-infringement. The recipients of this report should rely on their own investigations.
This report is intended for distribution to institutional investors. Recipients who are not institutional investors should seek advice of their independent financial advisor prior to taking any investment decision
based on this report or for any necessary explanation of its contents.
MOSt and/or its affiliates and/or employees may have interests/positions, financial or otherwise in the securities mentioned in this report. To enhance transparency, MOSt has incorporated a Disclosure of Interest
Statement in this document. This should, however, not be treated as endorsement of the views expressed in the report.
Disclosure of Interest Statement
1. Analyst ownership of the stock
2. Group/Directors ownership of the stock
3. Broking relationship with company covered
4. Investment Banking relationship with company covered
Power Finance Corporation's
No
No
No
No
Analyst Certification
The views expressed in this research report accurately reflect the personal views of the analyst(s) about the subject securities or issues, and no part of the compensation of the research analyst(s) was, is, or
will be directly or indirectly related to the specific recommendations and views expressed by research analyst(s) in this report. The research analysts, strategists, or research associates principally responsible
for preparation of MOSt research receive compensation based upon various factors, including quality of research, investor client feedback, stock picking, competitive factors and firm revenues.
Regional Disclosures (outside India)
This report is not directed or intended for distribution to or use by any person or entity resident in a state, country or any jurisdiction, where such distribution, publication, availability or use would be contrary to
law, regulation or which would subject MOSt & its group companies to registration or licensing requirements within such jurisdictions.
For U.K.
This report is intended for distribution only to persons having professional experience in matters relating to investments as described in Article 19 of the Financial Services and Markets Act 2000 (Financial
Promotion) Order 2005 (referred to as "investment professionals"). This document must not be acted on or relied on by persons who are not investment professionals. Any investment or investment activity to
which this document relates is only available to investment professionals and will be engaged in only with such persons.
For U.S.
MOSt is not a registered broker-dealer in the United States (U.S.) and, therefore, is not subject to U.S. rules. In reliance on the exemption from registration provided by Rule 15a-6 of the U.S. Securities Exchange
Act of 1934, as amended (the "Exchange Act") and interpretations thereof by the U.S. Securities and Exchange Commission ("SEC") in order to conduct business with Institutional Investors based in the U.S.,
Motilal Oswal has entered into a chaperoning agreement with a U.S. registered broker-dealer, Marco Polo Securities Inc. ("Marco Polo"). Any business interaction pursuant to this report will have to be executed
within the provisions of this Chaperoning agreement.
This report is intended for distribution only to "Major Institutional Investors" as defined by Rule 15a-6(b)(4) of the Exchange Act and interpretations thereof by SEC (henceforth referred to as "major institutional
investors"). This document must not be acted on or relied on by persons who are not major institutional investors. Any investment or investment activity to which this document relates is only available to major
institutional investors and will be engaged in only with major institutional investors.
The Research Analysts contributing to the report may not be registered /qualified as research analyst with FINRA. Such research analyst may not be associated persons of the U.S. registered broker-dealer, Marco
Polo and therefore, may not be subject to NASD rule 2711 and NYSE Rule 472 restrictions on communication with a subject company, public appearances and trading securities held by a research analyst account.
Motilal Oswal Securities Ltd
Motilal Oswal Tower, Level 9, Sayani Road, Prabhadevi, Mumbai 400 025
Phone: +91 22 3982 5500 E-mail: reports@motilaloswal.com