30 November 2012
Update | Sector: Capital Goods
Larsen & Toubro
BSE SENSEX
S&P CNX
19,171
5,825
CMP: INR1,662
TP: INR1,795
Buy
Gearing up the overseas juggernaut
Overseas business at inflexion point; could contribute 1/3rd of FY14 PAT
Bloomberg
Equity Shares (m)
52-Week Range (INR)
1,6,12 Rel. Perf. (%)
M.Cap. (INR b)
M.Cap. (USD b)
LT IN
608.9
1,720/971
-3/24/11
1,011.9
18.9
Stock performance (1 year)
We expect FY13/FY14 to be an inflexion point in Larsen and Toubro's (L&T) attempt
to diversify geographically and thus reduce the concentration risk of depending on
the domestic economy. We estimate the overseas business would contribute ~28%/
32% of profits in FY13/FY14 respectively, up significantly from ~21% in FY12.
This shall be driven by: i) increased contribution of overseas service business from
10% of consolidated profits in FY12 to 14% in FY14 and ii) incremental growth from
new geographies (Middle East, Australia, SE Asia)/new segments (hydrocarbons, large-
sized projects).
L&T has continuously adapted and evolved across economic cycles, which led to a
strong 'delivery', even in a turbulent environment. In this note, we analyze the
possible inflexion point in overseas business.
L&T is exposed to several levers across business/geographic segments and has
emerged as the E&C partner of choice in India, which provides a solid foundation to
capitalize on the next leg of investment cycle. Thus, despite a very strong near term
performance, we remain positive on L&T and believe triggers still exist to accumulate
the stock on declines.
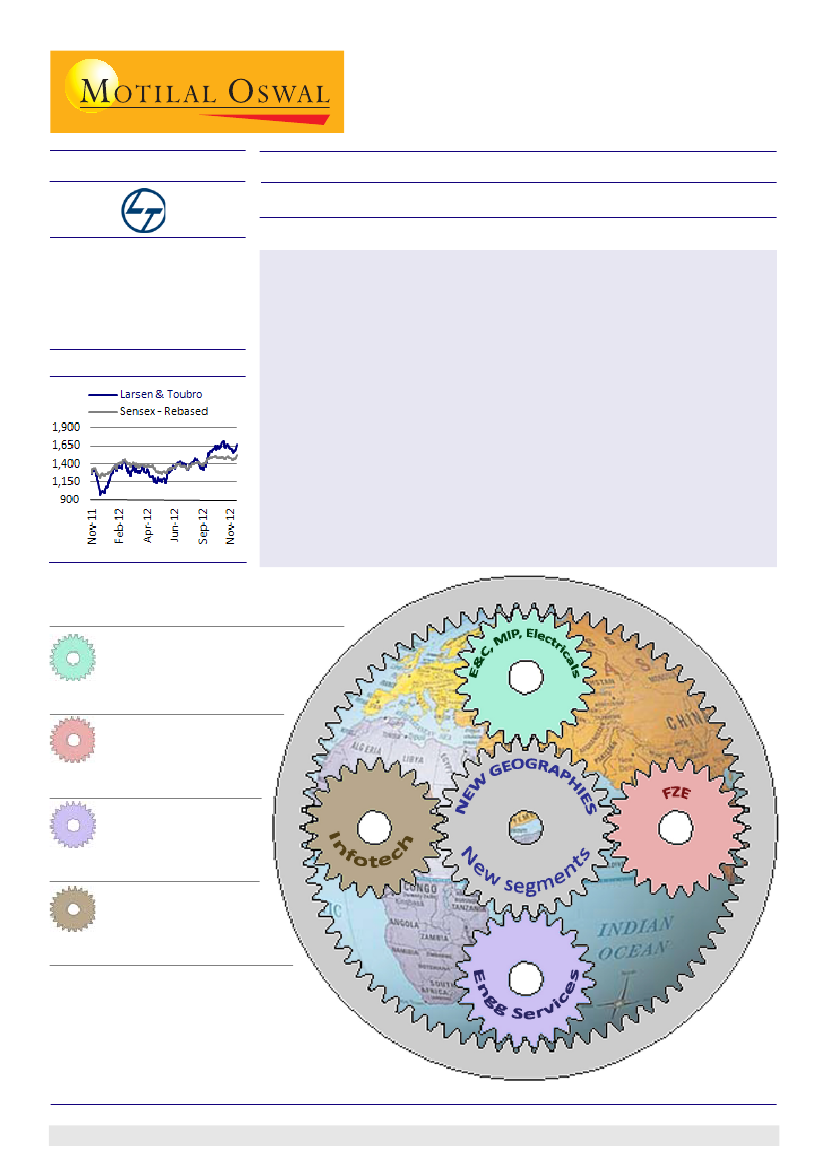
L&T's overseas business:
At an inflexion point
#1
#2
#3
#4
E&C, MIP, Electricals
Share in Cons PAT
FY12
8%
| FY14
12%
PAT CAGR 37%
(FY12-14)
FZE
Share in Cons PAT
FY12
3%
| FY14
6%
PAT CAGR 56%
Engineering Services
Share in Cons PAT
FY12
2%
| FY14
5%
PAT CAGR 66%
Infotech
Share in Cons PAT
FY12
9%
| FY14
9%
PAT CAGR 16%
#1
#4
#2
NOTE:
To accelerate growth in the technology
space, L&T has restructured the businesses:
L&T Infotech
has been reorganized around two
clusters, "Industrial" and "Services".
L&T Integrated
Engineering Services
has been rebranded as
L&T Technology
Services.
#3
Satyam Agarwal
(AgarwalS@MotilalOswal.com); +91 22 3982 5410
Deepak Narnolia
(Deepak.Narnolia@MotilalOswal.com); +91 22 3029 5126
Investors are advised to refer through disclosures made at the end of the Research Report.
1

Larsen & Toubro
L&T: Gearing up the overseas juggernaut
We expect FY13/FY14 to be an inflexion point in L&T's attempt to diversify
geographically and thus reduce the concentration risk of depending on the domestic
economy. We estimate the overseas business shall contribute ~28%/32% of profits
in FY13/FY14 respectively, up from ~21% in FY12. This would be driven by: i) increased
contribution of overseas service business from 10% of consolidated profits in FY12
to 14% in FY14 and ii) incremental growth from new geographies (Middle East,
Australia, SE Asia)/new segments (hydrocarbons, large-sized projects).
Overseas business would contribute ~1/3rd of profits by FY14
#1
#4
#2
#3
Revenues (INR B)
FY12 FY13E FY14E
1. E&C, MIP, Electricals
54
79
107
2. FZE
30
40
52
3. IES
8
13
17
4. Infotech
32
40
44
Total
124
172
221
L&T Consolidated
643
% Share
19
Net Profit (INR B)
FY12 FY13E FY14E
4
5
7
1
3
4
1
2
3
4
5
5
10
15
19
48
54
59
21
28
32
EPS (INR/sh)
FY12 FY13E FY14E
6.2
8.8 11.6
2.4
4.6
6.0
1.7
3.2
4.8
6.2
7.9
8.4
16.5
24.5 30.7
78.4
89.1 97.1
21
28
32
Standing tall amidst turbulence
Potential doubling of market share a key RoE trigger
L&T has maintained its market share in the previous capex cycle, with domestic
revenues at a 1.2-1.5% of the Gross Fixed Capital Formation (GFCF) improving to
2.3% in FY12. We believe that manufacturing businesses now provide opportunity
for doubling of market share in the next cycle from Long Period Average (LPA) of
1.5% to 3% of GFCF. Several of these manufacturing businesses are difficult to
replicate, and L&T is positioned as a dominant player.
Manufacturing business presents possibilities for doubling of market share in next cycle
(See our report dt 21-Jun-12)
The RoE Trokia
GFCF)
Maintained market share
Source: Company, MOSL
(See our report dt 27-Sep-12)
30 November 2012
2

Larsen & Toubro
#1
#2
E&C business, including manufacturing and industrial products; Electricals
and FZE
Overseas geographies could be important growth drivers for the company.
Management expects 35-40% growth in order intake from overseas markets in FY13
(on top of a 59% growth in FY12). L&T is well-established in Oman and UAE, is
consolidating its presence in Kuwait and Saudi Arabia and its new focus markets are
Qatar, Iraq, Indonesia, CIS, Perth, Brazil, Australia etc. As a business strategy, company
is focusing on countries where higher localization is possible. It has taken important
steps in the GCC area by establishing Engineering & Project Management Centers in
Abu Dhabi and Sharjah, followed by the construction of its own deep-water offshore
platforms and modular fabrication yard at Sohar, Oman, which provide definitive cost
arbitrage. The organization structure has also been altered and local expats have
been appointed (in important locations like Saudi Arabia, UAE, London, Houston,
Perth, Singapore etc).
L&T's E&C presence overseas - a background
The classic "Bridge on the River Kwai" was the first international project executed
by L&T's construction division (L&T ECC) in 1956. Following this, it secured orders
from Qatar, Abu Dhabi, Iraq, Sri Lanka, Malaysia, Russia, Mauritius and SAARC
countries. Its first milestone achievement in terms of volume and value of contract
secured was the Abu Dhabi International Airport in 1976. Company was the
nominated sub-contractor to the Japanese JV in this project. Besides providing a
gateway to UAE, the Abu Dhabi Airport opened avenues to international markets
(particularly the Middle East) for L&T ECC. With the formation of L&T (Oman) LLC
(LTO) at Muscat, L&T established a firm footing in Oman in 1994. Once again, L&T
made inroads into UAE as a registered corporation in 1996 when the construction
boom was underway and the Middle East was becoming a hot bed of infrastructure
development. L&T ECC secured several contracts for the execution of power
transmission and distribution projects directly in Abu Dhabi. In 1999, L&T Saudi
Arabia LLC was incorporated in Riyadh as a JV between L&T and a local Saudi national.
Over the years, L&T has established its presence in several other geographies,
including Qatar, Kuwait, Malaysia, Nigeria etc.
L&T: Key areas of operations in overseas markets
Hydrocarbon projects:
Company has two decades of track record in executing
international turnkey large-sized and complex projects, including the GCC region
where it has established a good presence. As part of internationalization initiatives,
key business development and regional heads have been appointed in select and
important geographies such as Australia, Houston, London, Malaysia, Perth, Saudi
Arabia and Singapore. Further, L&T has entered into certain alliances and
collaborations with reputed international players in the area of subsea systems,
FPSO/MOPU, refineries and fertilisers etc.
Heavy engineering:
This includes opportunities in the supply of power plant
equipments, coal gassifiers, fertilizer projects, ammonia converters and also
projects in defense, nuclear and aerospace equipments.
Construction:
Power transmission and distribution is the largest component of
construction activity for L&T in most GCC countries, including Qatar, UAE and
Kuwait. It is now targeting to expand in Africa and other geographies.
30 November 2012
3

Larsen & Toubro
Electricals and automation:
This largely comprises of switchboards and automation
business, including TAMCO. Operations are spread over several continents,
including SE Asia, Middle East, the US, Australia, CIS countries etc.
Power:
Company has identified exports as a key growth driver for the power
business, with the initial potential markets being GCC and SE Asia. Negotiations
are also in progress with Mitsubishi for ordering equipments to the Indian JV and
any success will be vital.
Manufacturing and industrial products:
This includes industrial machinery like
truck tyres manufacturing, rubber machinery, valves, crushing and surface mining
equipments etc.
Overseas markets: Intake volatile over FY10-11 due to increased competition
Management expects 35-40% growth in order intake in FY13 (on top of a 59% growth
in FY12). Growth shall be driven by a combination of new geographies, new business
segments and differentiated business strategy. While the intake from overseas
markets in 1HFY13 has been only INR56b (~15% of the intake), 2HFY13 is expected to
witness important order wins.
Overseas markets: Intake volatile over FY10-11 due to increased competition
Next
level of
growth
Growth
Consolidation
Source: Company, MOSL
Overseas market: Revenue growth in FY13-14 to be driven by robust order intake
Revenues impacted
due to loss of
orders in FY10-11 to
competition
Overseas revenues have
grown with a CAGR of 23%
over FY03-10
Source: Company, MOSL
30 November 2012
4

Larsen & Toubro
Country-wise overseas order intake in FY12
Sector-wise overseas order intake in FY12
LT is well established in Oman and UAE, is consolidating presence in Kuwait and Saudi Arabia, and its new focus markets are
Qatar, Iraq, Indonesia, CIS, Perth, Brazil, Australia, etc.
Source: Based on summation of order intake filings with the stock exchanges
L&T FZE: Oman/Tamco contributes to bulk of overseas profits; expect ramp-
up in Qatar, Saudi and Kuwait
L&T is focusing on IK E&C orders in select countries where competition is more local
(has formed local companies in several GCC countries) and has entered into JVs with
larger E&C players for larger jobs in the region.
Return on investment from overseas subsidiaries (INR m)
FY10
FY11
FY12
Investment in Overseas E&C*
11,474
11,474
11,474
Net Profit from Overseas E&C
1,563
1,977
1,546
ROI (%) - Overseas E&C
14
17
13
*Investment by L&T standalone in the equities
FY13E
FY14E
11,474
11,474
2,859
3,861
25
34
of subsidiaries/JV
Oman / Tamco: Contributes to bulk of the overseas profits; other geographies yet to contribute
meaningfully (INR m) - FY12 profit composition
-33
Source: Company, MOSL
30 November 2012
5

Larsen & Toubro
#3
Integrated Engineering Services: fastest growing engineering services
provider based in India
L&T's Integrated Engineering Services (IES) is a global engineering services operation,
with 94% of its business from the overseas market. Studies on global service provider
ranking for 2011 have positioned IES as the highest among pure play engineering
services companies. For industrial products domain, IES has been ranked in the
leadership zone. The business offers product design, analysis, prototyping, testing,
embedded system design, manufacturing engineering, plant engineering and
construction management and asset information management using CAD/CAM/CAE
technology in various domains. The segment caters to industries, including automotive,
aerospace, industrial products, medical devices, consumer electronics, consumer
packed goods, oil & gas etc.
Geographically sales are concentrated in North America which contributes ~70% of
revenues. IES is headquartered at Vadodara, India and has design centres in Vadodara,
Bangalore, Chennai, Mysore and Mumbai. Company has a global foot print with offices
in the US, UK, Germany, Japan, France, Denmark, Sweden, Canada and India. Significant
potential in newer geographies is being witnessed in Russia, Eastern Europe, Australia,
Africa, Mexico and Brazil.
IES clocked a 3-year CAGR of 51% in sales, with 64% YoY growth in FY12. L&T has
significantly ramped up capacity in IES in the last three years and the business currently
has over 5,500 employees (up from 3,000 during FY09).
IES: an important driver of profitability
IES: to contribute 21% of standalone exports in FY14E
Source: Company, MOSL
#4
L&T Infotech: Among top 10 IT services players in India
L&T Infotech is a global IT services and solutions provider, offering end-to-end software
solutions and services in manufacturing, energy & petrochemicals, banking, financial
services and insurance sectors. Company has its presence globally in the US, Canada,
Europe, Asia, South Africa, Middle East, Australia and New Zealand. L&T Infotech is
among the top 10 IT services players in India.
30 November 2012
6

Larsen & Toubro
Top 10 IT service providers from India
Sr No
1
2
3
4
5
6
7
8
9
10
Company
Tata Consultancy Services
Infosys
Wipro
HCL Technologies
Mahindra Satyam
Tech Mahindra
MphasiS
Patni Computer Systems
Larsen & Toubro Infotech
CSC, India
Revenue - USD m
10,171
6,994
5,921
4,152
1,307
1,156
1,117
750
688
n.a.
Revenue - INR m
PAT - INR m
488,938
106,384
337,340
83,160
284,313
55,731
210,312
24,556
63,956
13,061
54,987
6,062
50,980
8,308
34,500
n.a.
31,660
4,190
n.a.
n.a.
Source: Company, MOSL
Company operates through its subsidiaries in Canada, Germany and the US.
Geographically, North America contributes to ~67% of revenues, while Europe
contributes 16% of sales. APAC and Africa/MEA contribute 6% and 5% of sales,
respectively.
L&T Infotech: Consistent growth
L&T Infotech: Geographically diversified
Source: Company, MOSL
30 November 2012
7

Larsen & Toubro
Financials and Valuation
Income Statement
Y/E March
2009
Total Revenues
343,370
Growth Rate (%)
35.9
Excise Duty
3,985
Net Revenues
339,385
Growth Rate (%)
36.1
Manufacturing Expenses
262,716
Staff Cost
19,745
S G &A Expenses
17,948
EBITDA
38,977
Change (%)
35.0
EBITDA Margin (%)
11.5
Depreciation
2,828
EBIT
36,149
Net Interest
4,156
Other Income
6,142
Non-recurring Other Income
1,256
Add: Trf to Rev. Res.
13
Profit before Tax
39,404
Tax
12,312
Effective Tax Rate (%)
31.2
Reported Profit
34,817
EO Adjustments
7,725
Adjusted Profit
27,092
Cons. Profit (Adj)
30,046
Growth (%)
31.1
2010
373,556
8.8
3,208
370,348
9.1
285,374
23,791
13,789
47,394
21.6
12.8
3,797
43,597
5,053
7,422
2,280
13
48,259
16,409
34.0
43,760
11,910
31,850
37,110
23.5
2011
442,961
18.6
3,902
439,059
18.6
334,681
28,301
19,778
56,299
18.8
12.8
5,905
50,394
6,193
9,106
2,369
11
55,686
19,436
34.9
39,580
3,329
36,250
42,416
14.3
2012
537,378
21.3
5,673
531,705
21.1
410,202
36,635
22,230
62,639
11.3
12.2
6,817
55,822
6,661
13,078
305
10
62,554
18,538
29.6
44,566
550
44,826
47,730
12.5
2013E
640,303
19.2
6,759
633,544
19.2
493,700
41,031
25,612
73,201
16.9
11.6
8,196
65,005
9,200
15,150
0
10
70,964
20,934
29.5
50,030
2,289
51,506
54,233
13.6
(INR Million)
2014E
734,839
14.8
7,757
727,082
14.8
565,730
45,134
29,394
86,824
18.6
11.9
9,219
77,605
9,800
12,864
0
10
80,679
23,800
29.5
56,878
0
56,878
59,154
9.1
Balance Sheet
Y/E March
Equity Capital
Reserves and Surplus
Net Worth
Debt
Deferred Tax Liability
Capital Employed
Gross Fixed Assets
Less : Depreciation
Add : Capital WIP
Net Fixed Assets
Investments
Inventory
Sundry Debtors
Cash & Bank
Loans & Advances
Other Current Assets
Current Assets
Current Liabilities
Net Current Assets
Capital Deployed
E: MOSL Estimates
30 November 2012
2009
1,171
123,426
124,597
65,560
485
190,642
55,905
14,762
10,803
51,946
82,637
14,705
99,031
7,753
58,194
43,561
223,244
167,188
56,056
190,642
2010
1,204
181,912
183,116
68,008
774
251,899
72,901
17,916
8,742
63,727
137,054
14,154
111,584
14,319
60,365
63,532
263,883
212,765
51,118
251,899
2011
1,218
217,245
218,463
71,611
2,635
292,708
89,465
23,025
7,713
74,153
146,848
15,772
124,276
17,296
82,253
110,501
350,099
278,392
71,707
292,708
2012
1,224
251,005
252,229
98,958
1,330
352,517
105,544
29,495
7,587
83,636
158,719
17,766
187,298
17,781
91,280
120,448
434,574
324,411
110,163
352,518
2013E
1,224
288,458
289,682
115,000
1,330
406,012
128,631
37,692
4,500
95,440
140,870
19,006
240,747
41,769
104,996
140,651
547,169
377,467
169,702
406,012
(INR Million)
2014E
1,224
328,920
330,144
120,000
1,330
451,474
148,631
46,911
4,500
106,221
159,631
21,812
276,291
38,030
114,960
161,229
612,323
426,702
185,622
451,474
8

Larsen & Toubro
Financials and Valuation
Ratios
Y/E March
Basic (INR)
Adjusted EPS
Growth (%)
Consolidated EPS
Growth (%)
Con. EPS (Fully Diluted)
Book Value
Dividend Per Share
Div. Payout (Incl. Div Tax ) %
Valuation (x)
P/E (Standalone)
P/E (Consolidated)
Price / CEPS
EV/EBITDA
EV/ Sales
Price / Book Value
Dividend Yield
Return Ratio (%)
RoE
RoCE
Turnover Ratios
Debtors (Days)
Inventory (Days)
Asset Turnover (x)
Leverage Ratio
Current Ratio (x)
D/E (x)
21.7
15.8
105.3
15.6
1.8
1.3
0.0
17.4
14.0
109.0
13.8
1.5
1.2
-0.2
16.6
13.9
102.4
13.0
1.5
1.3
-0.1
2009
46.3
29.0
51.3
31.1
51.3
212.7
10.2
26.5
2010
52.9
14.3
61.6
20.1
61.6
304.1
12.5
27.6
2011
59.5
12.6
69.7
13.0
69.7
358.8
14.5
28.4
2012
73.2
23.0
78.0
11.9
78.0
412.1
16.5
25.3
19.7
18.5
19.6
14.3
1.7
3.5
1.1
17.8
14.1
127.2
12.1
1.5
1.3
0.0
2013E
84.2
14.9
88.6
13.6
88.6
473.3
21.0
29.7
19.7
18.8
17.0
14.4
1.7
3.5
1.3
17.8
14.3
137.2
10.8
1.6
1.4
0.1
2014E
92.9
10.4
96.7
9.1
96.7
539.5
23.2
28.9
17.9
17.2
15.4
12.4
1.5
3.1
1.4
17.2
14.2
137.2
10.8
1.6
1.4
0.2
Cash Flow Statement
Y/E March
PBT before EO Items
Add : Depreciation
Interest
Less : Direct Taxes Paid
(Inc)/Dec in WC
CF from Operations
(Inc)/Dec in FA
(Pur)/Sale of Investments
Investment in subs
Advances to subs
CF from Investments
(Inc)/Dec in Net Worth
(Inc)/Dec in Debt
Less : Interest Paid
Dividend Paid
CF from Fin. Activity
Inc/Dec of Cash
Add: Beginning Balance
Closing Balance
E: MOSL Estimates
30 November 2012
2009
39,404
3,073
4,156
12,312
-13,765
20,556
-18,495
-6,272
-7,143
-20,003
-51,913
1,296
29,720
4,156
5,051
21,810
-1,822
9,645
7,753
2010
48,259
4,159
5,053
16,409
11,407
52,469
-15,940
-32,811
-21,606
-1,366
-71,722
23,851
2,448
5,053
7,338
13,908
6,566
7,753
14,319
2011
55,686
6,003
6,193
19,436
-9,338
39,107
-16,429
9,972
-19,766
-9,598
-35,822
7,927
3,603
6,193
8,973
-3,636
2,979
14,319
17,296
2012
62,554
7,005
6,661
18,538
-34,431
23,250
-16,487
4,108
-15,979
-4,703
-33,061
-979
27,347
6,661
9,962
9,745
483
17,296
17,781
2013E
70,964
8,196
9,200
20,934
-34,002
33,424
-20,000
39,028
-21,179
-3,527
-5,678
(INR Million)
2014E
80,679
9,219
9,800
23,800
-20,017
55,881
-20,000
10,000
-28,761
-2,569
-41,331
0
5,000
9,800
14,866
-19,666
-5,116
41,769
38,030
9
0
16,042
9,200
11,119
-4,277
25,758
17,781
41,769

Capital Goods
Report Gallery

Larsen & Toubro
N O T E S
30 November 2012
11

Disclosures
This report is for personal information of the authorized recipient and does not construe to be any investment, legal or taxation advice to you. This research report does not constitute an offer, invitation or inducement
to invest in securities or other investments and Motilal Oswal Securities Limited (hereinafter referred as MOSt) is not soliciting any action based upon it. This report is not for public distribution and has been
furnished to you solely for your information and should not be reproduced or redistributed to any other person in any form.
Unauthorized disclosure, use, dissemination or copying (either whole or partial) of this information, is prohibited. The person accessing this information specifically agrees to exempt MOSt or any of its affiliates
or employees from, any and all responsibility/liability arising from such misuse and agrees not to hold MOSt or any of its affiliates or employees responsible for any such misuse and further agrees to hold MOSt
or any of its affiliates or employees free and harmless from all losses, costs, damages, expenses that may be suffered by the person accessing this information due to any errors and delays.
The information contained herein is based on publicly available data or other sources believed to be reliable. While we would endeavour to update the information herein on reasonable basis, MOSt and/or its
affiliates are under no obligation to update the information. Also there may be regulatory, compliance, or other reasons that may prevent MOSt and/or its affiliates from doing so. MOSt or any of its affiliates or
employees shall not be in any way responsible and liable for any loss or damage that may arise to any person from any inadvertent error in the information contained in this report . MOSt or any of its affiliates
or employees do not provide, at any time, any express or implied warranty of any kind, regarding any matter pertaining to this report, including without limitation the implied warranties of merchantability, fitness
for a particular purpose, and non-infringement. The recipients of this report should rely on their own investigations.
This report is intended for distribution to institutional investors. Recipients who are not institutional investors should seek advice of their independent financial advisor prior to taking any investment decision
based on this report or for any necessary explanation of its contents.
MOSt and/or its affiliates and/or employees may have interests/positions, financial or otherwise in the securities mentioned in this report. To enhance transparency, MOSt has incorporated a Disclosure of Interest
Statement in this document. This should, however, not be treated as endorsement of the views expressed in the report.
Disclosure of Interest Statement
1. Analyst ownership of the stock
2. Group/Directors ownership of the stock
3. Broking relationship with company covered
4. Investment Banking relationship with company covered
Larsen & Toubro
No
No
No
No
Analyst Certification
The views expressed in this research report accurately reflect the personal views of the analyst(s) about the subject securities or issues, and no part of the compensation of the research analyst(s) was, is, or
will be directly or indirectly related to the specific recommendations and views expressed by research analyst(s) in this report. The research analysts, strategists, or research associates principally responsible
for preparation of MOSt research receive compensation based upon various factors, including quality of research, investor client feedback, stock picking, competitive factors and firm revenues.
Regional Disclosures (outside India)
This report is not directed or intended for distribution to or use by any person or entity resident in a state, country or any jurisdiction, where such distribution, publication, availability or use would be contrary to
law, regulation or which would subject MOSt & its group companies to registration or licensing requirements within such jurisdictions.
For U.K.
This report is intended for distribution only to persons having professional experience in matters relating to investments as described in Article 19 of the Financial Services and Markets Act 2000 (Financial
Promotion) Order 2005 (referred to as "investment professionals"). This document must not be acted on or relied on by persons who are not investment professionals. Any investment or investment activity to
which this document relates is only available to investment professionals and will be engaged in only with such persons.
For U.S.
MOSt is not a registered broker-dealer in the United States (U.S.) and, therefore, is not subject to U.S. rules. In reliance on the exemption from registration provided by Rule 15a-6 of the U.S. Securities Exchange
Act of 1934, as amended (the "Exchange Act") and interpretations thereof by the U.S. Securities and Exchange Commission ("SEC") in order to conduct business with Institutional Investors based in the U.S.,
Motilal Oswal has entered into a chaperoning agreement with a U.S. registered broker-dealer, Marco Polo Securities Inc. ("Marco Polo"). Any business interaction pursuant to this report will have to be executed
within the provisions of this Chaperoning agreement.
This report is intended for distribution only to "Major Institutional Investors" as defined by Rule 15a-6(b)(4) of the Exchange Act and interpretations thereof by SEC (henceforth referred to as "major institutional
investors"). This document must not be acted on or relied on by persons who are not major institutional investors. Any investment or investment activity to which this document relates is only available to major
institutional investors and will be engaged in only with major institutional investors.
The Research Analysts contributing to the report may not be registered /qualified as research analyst with FINRA. Such research analyst may not be associated persons of the U.S. registered broker-dealer, Marco
Polo and therefore, may not be subject to NASD rule 2711 and NYSE Rule 472 restrictions on communication with a subject company, public appearances and trading securities held by a research analyst account.
Motilal Oswal Securities Ltd
Motilal Oswal Tower, Level 9, Sayani Road, Prabhadevi, Mumbai 400 025
Phone: +91 22 3982 5500 E-mail: reports@motilaloswal.com