10 January 2013
3QFY13 Results Update | Sector: Financials
IndusInd Bank
BSE Sensex
19,664
S&P CNX
5,969
CMP: INR434
TP: INR500
Buy
Bloomberg
Equity Shares (m)
M. Cap. (INR b)/(USD b)
52-Week Range (INR)
1,6,12 Rel.Perf.(%)
IIB IN
521.8
227/4.1
441/242
3/15/52
Financials & Valuation (INR b)
Y/E March
2013E 2014E 2015E
29.0
24.3
13.6
4.0
26.0
29.9
164.4
17.0
1.7
14.6
16.7
2.6
2.7
0.7
36.1
30.7
17.1
4.1
32.7
25.8
192.3
18.4
1.8
14.6
13.3
2.3
2.3
0.9
NII (INR b)
22.4
OP (INR b)
18.1
NP (INR b)
10.5
NIM (%)
3.8
EPS (INR)
20.0
EPS Gr. (%)
16.8
BV/Sh. (INR) 142.2
ROE (%)
17.5
ROA (%)
1.6
Payout (%)
14.6
Valuations
P/E(X)
21.7
P/BV (X)
3.1
P/ABV (X)
3.1
Div. Yield (%)
0.6
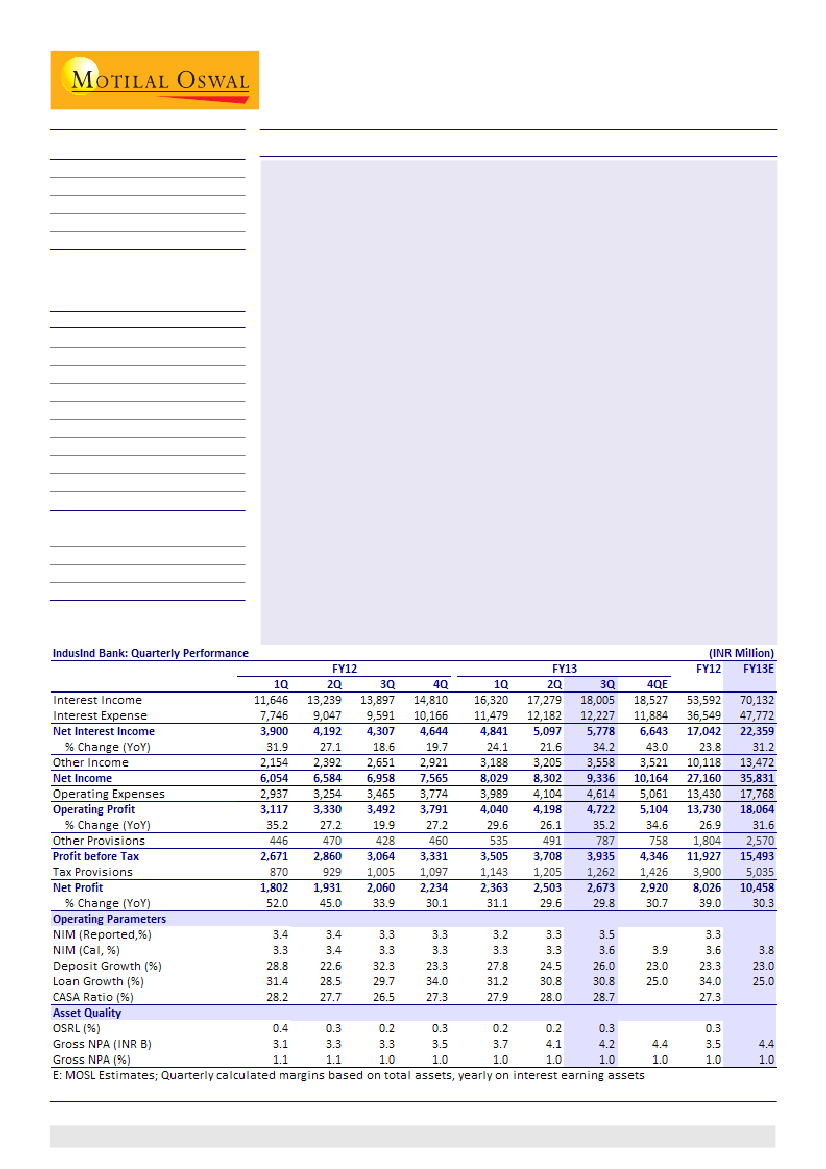
IndusInd Bank's 3QFY13 PAT grew 30% YoY and 7% QoQ to ~INR2.7b (in-line with
estimates). Strong loan growth (+31% YoY), 20bp+ QoQ improvement in margin
to 3.5% and strong fee income, led to highest-ever core income and core PPP (as
a percentage of average assets) of 5.6% and 2.7% and quarterly RoA of 1.65%.
Key highlights:
Asset quality was stable (GNPA up 3% QoQ) despite recognizing one large
media account of INR1b as NPA. After valuing the securities that bank held
towards the exposure, it sold the exposure to ARC and provided ~INR400m
as provisions. Slippage ratio in consumer finance segment was stable at 2%.
Post moderation in 2QFY13, SA deposit growth bounce backed to 16% QoQ
(+55% YoY) - a positive, driving overall CASA growth (+10% QoQ and 36% YoY).
CASA ratio stood at 28.7% vs 28% QoQ.
Fall in cost of funds (down 26bp QoQ), higher funding of loans via CASA
(43%), largely stable yield on funds (down 5bp QoQ) and benefit of capital
infusion led to margin improvement of 20bp+ QoQ.
Traction in fee income remains impressive (up 32% YoY and 11% QoQ to
~INR3.3b)
Valuation and view:
With ~50% of deposits wholesale in nature, and high
proportion of fixed rate loans on the balancesheet, IIB is most leveraged to
systemic interest rates and liquidity. This coupled with recent capital infusion
would boost NIM. Improving liability franchise, structural improvement in RoA
and 20%+ asset growth should help IIB to post one of the highest PAT CAGR
(~29%) among the banks under our coverage. Maintain
Buy.
Alpesh Mehta
(Alpesh.Mehta@MotilalOswal.com) + 91 22 3982 5415
Sohail Halai
(Sohail.Halai@MotilalOswal.com) + 91 22 3982 5430
Investors are advised to refer through disclosures made at the end of the Research Report.
1

IndusInd Bank
Quarterly performance: In line with expectations (INR m)
Y/E March
Net Interest Income
% Change (Y-o-Y)
Other Income
Net Income
Operating Expenses
Operating Profit
% Change (Y-o-Y)
Other Provisions
Profit before Tax
Tax Provisions
Net Profit
% Change (Y-o-Y)
3QFY13E
5,543
29
3,516
9,060
4,345
4,714
35
700
4,014
1,305
2,710
32
3QFY13A
5,778
34
3,558
9,336
4,614
4,722
35
787
3,935
1,262
2,673
30
v/s our Est
4
1
3
6
0
12
-2
-3
-1
Comments
Growth and margins surprised positively
Fee income growth remains strong
Better than expected NII performance compensated
by higher opex
Higher provisions on account of one large account
that slipped into NPA
PAT in-line with estimate
Source: Company/MOSL
Margin performance - in line with expectation
Reported margins improved 21bp QoQ to 3.46%. As a consequence NII grew 13% QoQ
and 34% YoY (4% above estimate). Cost of funds declined by 26bp QoQ to 7.3%,
reflecting (1) the benefit of falling bulk deposit rates in the system, (2) absence of
one-off that it accrued on interest expense in 2QFY13 on account of foreign borrowings
and (3) partial benefit on account of capital infusion of INR20b. Yield on consumer
finance book declined 17bp QoQ to 15.9%, whereas yield on corporate finance book
declined 21bp QoQ to 11.6%. As a result overall yield on loans declined 20bp+QoQ.
However, yield on funds (as a percentage of total assets) decline was contained to
just 5bp QoQ (led by higher share of interest earning assets during the quarter) which
led to margin expansion.
Above industry average loan growth; CV growth slows down
Loan growth was above industry average with increase of 8% QoQ and 31% YoY to
INR424b. Incrementally, loan growth was driven by strong growth of 9% QoQ (+24%
YoY) in corporate segment. Consumer finance segment grew 6% QoQ (+38% YoY) and
its share in overall loans stood at 51.1% as compared to 51.8% a quarter ago and 48.4%
a year ago.
Within consumer finance segment growth moderated in CV loans (+2% QoQ and 31%
YoY), whereas growth in utility vehicles and cars being strong at 10%+ QoQ. Credit
cards and personal loan/LAP increased ~24% QoQ to INR15b (share has increased
from 2.1% in 3QFY12 to 3.5%), led by strong growth in LAP segment (+37% QoQ and
145% YoY). Management is targeting loan growth of 25-30% over FY13-14.
Strong growth in SA deposits; CASA ratio improves 70bp QoQ to 28.7%
Deposits grew 7% QoQ and 26% YoY to ~INR511b, and CASA grew 10% QoQ and 36%
YoY to INR147b. Growth in CASA was driven by strong growth in SA deposits (+16%
QoQ and 55% YoY) and healthy growth in CA deposits (+5% QoQ and 25% YoY). Post de-
regulation proportion of SA deposits to overall deposits has increased to 12.1% (11.1%
in 2QFY13) as compared to 8.6% in 1HFY12. Management re-iterated its CASA ratio
guidance of 35% by FY14.
10 January 2013
2

IndusInd Bank
Asset quality stable QoQ, even as bank recognized one large media account
of INR1b as NPA
In absolute terms, GNPAs increased 3% QoQ to INR4.2b, whereas in % terms GNPA
and NNPA remained flat QoQ at 1% and 0.3%. Overall slippages for the quarter stood
at INR1.9b. During the quarter slippages in corporate segment was ~INR1b, which
largely pertained to only one large media account. Management mentioned that it
made provision of INR400m on the exposure and post assessing the value of securities
it held against the exposure, rest ~INR600m was sold to ARC.
Slippages in consumer finance segment increased QoQ to INR800m v/s INR710m in
2QFY13. Slippage ratio in this segment was stable QoQ at 2%. GNPA in CV segment
increased to 0.9% as compared to 0.75% a quarter ago. Except GNPA in two wheelers
segment (proportion of which is low in overall loans), GNPA's in other segments of
consumer finance segment was below 1%.
Adjusted credit cost of 25bp; restructured loan at 26bp
Credit cost for 3QFY13 stood at 70bp (annualized), however adjusted for provisions
on one large account credit cost declined QoQ to just 25bp as compared to ~50bp in
2QFY13. During the quarter restructured loan portfolio as a percentage of overall
loans increased to 0.26% as compared to 0.19% a quarter ago, implying net addition to
restructured book of INR350m.
Key conference call takeaways
Capital raising and promoter stake
Promoters' holding has fallen to ~15% (which needs to be reduced to 10% as per
RBI's existing guidelines). Management mentioned that combination of ESOP
dilution (~7% of pre-dilution equity) and possibility of RBI to keep promoter
ownership in line with the banking amendment bill should however provide
relief.
Retail assets and liabilities
Of the overall loans used CV segment stands at INR27b (i.e. 6.5% of overall loans;
12% of vehicle finance portfolio and 27% of CV loans).
In 3QFY13 bank disbursed loans of INR40.4b of which (1) INR14.3b in CV (old CV -
INR6b) segment, (2) INR8b in Car/Utility segment, (3) INR3.5b in two wheelers
segment, (4) INR5.4b in construction segment and (5) INR3b in LAP and others.
During the quarter bank added 0.14m new to bank SA customers as compared to
~0.13m in 2QFY13 and addition of value to SA deposits during the quarter was
INR7.8b as compared to INR6b in 2QFY13. During the quarter bank also was able
to penetrate into some of the government account (25-30 accounts of Municipal
Corporation) which contributed INR2.5b
Management expects traction in SA acquisition, to increase further to INR10b
from 4QFY13 on back of its new acquisition strategy and new product launches.
Fee income growth would continue to be faster than balance sheet growth
During the quarter fee income grew 32% YoY, led by strong growth in processing
fees. Management mentioned that some of the up-tick in this stream would also
be on account of higher income due to renewable charges and not necessarily
due to fresh sanctions.
3
10 January 2013

IndusInd Bank
Traction in investment banking fees remains strong and pertains to debt related
fees. For FY13 management expects to book income of INR1.4b (as against
INR790m in FY12 and INR1b in 9MFY13).
Yield on loans, Asset quality and provisioning
Lower yield on loans was on account of (1) ~INR50m (5bp margin impact) on
account of reversal of interest income on media account and (2) re-pricing of
loans on corporate exposure (reduction of spread) and (3) discounts on retail
loans due to festive season.
Asset quality to remain healthy and expects to contain credit cost in line with
historical average (50-80bp), near lower end as economic environment is
expected to improve in FY14.
Bank would utilize windfall gains if it accrues to increase the provision coverage
ratio as a consequence it would largely be neutral on PAT.
Restructuring done during the quarter was on account of CDR and there was no
bilateral restructuring.
Valuations and view: Best placed in the current environment
Levers in place for superior margin improvement:
IIB is well poised to report
gradual improvement in margin over next few quarters led by
(1) Liabilities side:
(a) ~50% of deposits are wholesale in nature which makes IIB is most leveraged to
systemic interest rates and liquidity. And with interest rates expected to ease,
benefit to reflect in decline in cost of funds, (b) increasing traction in CASA
deposits,
(2) Asset side:
50% of loan book fixed in nature (built in high interest
rate environment) and even though yields on corporate portfolio would decline
overall decline in yields would be contained and (3)
Recently raised equity
of
INR20b (positive impact of 20bp in FY14). We factor margin improvement of 30bp
QoQ in 4QFY13 (of which 25bp would be on account of capital infusion) and further
20bp+ YoY for FY14.
Well-capitalized; growth rates remain superior:
Post capital raising CAR has
increased to 16%+ and Tier I ratio to ~15% thus, bank is well is capitalized for next
phase of growth. Further, on back of niche presence IIB has been able to grow its
balance sheet much faster than peers, in fact it has been selling down loans to
manage margins and improve profitability. New product additions like LAP, Gold
loans (on a pilot stage), credit cards etc will drive growth higher. On back of strong
loan growth of 25% CAGR over FY12/15 and improving margins, NII CAGR over
FY12/15 is expected to be 28%.
Asset light revenues driving ROA up:
Share of fee income to average assets has
increased to 1.9% v/s 1.7% a year ago - a key ROA driver. Over FY10-12, contribution
of fee income to average assets has increased by ~40bp driving ROA upgrade.
Management maintained its guidance to grow its fee income faster than balance
sheet growth. Some of its new initiatives have worked well for generating fees.
Well managed asset quality; uptick in credit cost to be compensated by margins:
IIB has managed its asset quality very well in the current cycle with lower exposure
to riskier segment and close to customer business model of CV financing. While
stress on CV loans is increasing, channel check suggest that SRTO (segment that
10 January 2013
4

IndusInd Bank
IIB caters to) performance remains healthy, albeit some delays in payment. While
asset quality remains strong, we model higher credit cost of 75bp for FY14/15 v/s
~45bp in FY12 and 55bp in FY13E, to factor in possible rise in delinquencies.
However, superior margins, focused fee income strategy and control over C/I ratio
will keep core operating profitability strong.
Buy with a target price of INR500 (15% upside):
Improving liability franchise,
structural improvement in RoAs and 22%+ asset growth should help IIB to post
one of the highest PAT CAGR of ~29% over FY12-15E among the banks under our
coverage. RoE is expected to remain moderate to ~17% in FY13/14 (post equity
dilution) and improve to 18%+ by FY15 as bank increases the leverage. We expect
IIB to report EPS of INR20 /INR26/INR33 in FY13/14/15 respectively and BV of INR142/
INR164/INR192 in FY13 / FY14/15. The stock trades at 16.7x and 2.6x FY14 EPS and
BV and 13.3x and 2.3x FY15 EPS and BV . Maintain
Buy
with target price of INR500
(2.6x FY15 BV, implied P/E of 15x).
We maintain our earnings estimate (INR b)
Old Estimates
FY13
FY14
FY15
Net Interest Income
Other Income
Total Income
Operating Expenses
Operating Profits
Provisions
PBT
Tax
PAT
Margins (%)
Credit Cost (%)
RoA (%)
RoE (%)
21.9
13.7
35.6
17.0
18.5
3.0
15.6
5.1
10.5
3.8
0.6
1.7
17.6
28.5
17.7
46.2
21.7
24.5
4.2
20.3
6.6
13.7
4.0
0.8
1.8
17.1
35.4
21.9
57.3
26.4
30.9
5.3
25.6
8.5
17.2
4.0
0.8
1.8
18.4
New Estimates
FY13
FY14
FY15
22.4
13.5
35.8
17.8
18.1
2.6
15.5
5.0
10.5
3.8
0.6
1.6
17.5
29.0
17.5
46.5
22.2
24.3
4.2
20.1
6.5
13.6
4.0
0.8
1.7
17.0
36.1
21.7
57.8
27.1
30.7
5.2
25.5
8.4
17.1
4.1
0.8
1.8
18.4
Change (%)
FY13
FY14
FY15
2.2
-1.6
0.7
4.3
-2.5
-13.3
-0.5
-0.5
-0.5
2.0
-1.1
0.8
2.7
-0.8
-0.4
-0.9
-0.9
-0.9
2.0
-0.8
0.9
2.6
-0.5
-0.6
-0.5
-0.5
-0.5
Source: MOSL
IndusInd Bank: One year forward P/BV (x)
IndusInd Bank: One year forward P/E (x)
10 January 2013
5

IndusInd Bank
Quarterly trends
Above industry average loan growth continues (%)
Deposit growth remains healthy (%)
Sequentially loan growth was driven by strong growth in
corporate finance segment (+9% QoQ) and healthy growth
in consumer finance segment (+6% QoQ)
Incremental deposits was driven by strong CASA growth of
10% QoQ; Incremental CASA for the quarter stood at 39%
CD ratio remains at an elevated level (%)
CASA ratio improves QoQ (%)
Opportunistic utilization of borrowing, refinancing facility
and recent capital infusion has led to higher CD ratio.
Post moderation SA deposit growth picked up, growing 16%
QoQ and 55% YoY. Management targets to reach a CASA
ratio of 35% by FY14
Cost of funds decline 26bp QoQ (%)
Margin performance in-line with expectation (%)
Cost of funds declined 26bp QoQ to 7.3% reflecting (1)
benefit of falling bulk deposit rates and (2) absence of
one-off interest expense
Fall in cost of funds (down 26bp QoQ), higher funding of
loans via CASA and benefit of capital infusion led to margin
improvement of 20bp+ QoQ
10 January 2013
6

IndusInd Bank
Quarterly trends
Traction in fee income continues (%)
Cost to core income stable QoQ (%)
Fee income streams continue to impress only drag was
income was commission from third party products (TTP).
Better than expected NII growth was off-set by higher than
expected opex
Asset quality managed well - GNPA up 3% QoQ (%)
Ex-provision for one large account credit cost at 25bp
During the quarter bank recognized one large media account
of INR1b as NPA.
Healthy asset quality performance has led to containment
of credit cost. While we expect delinquency and credit cost
to rise it would be compensated by higher margins
Dupont Analysis: Core Income and Core PPP highest since new mgmt took over the operations (%)
1Q
NII
Fee income
Core Income
Operating costs
- Emp Costs
- Other Expenses
Core Cost to Income Ratio
Core Operating Profit
Treasury Income
Operating Profit
Provisions
Tax
RoAA
Leverage (x)
RoAE
10 January 2013
2.4
1.2
3.7
2.4
0.9
1.5
65.3
1.3
1.2
2.5
0.5
0.8
1.2
16.2
20.3
FY10
2Q
3Q
2.9
1.7
4.6
2.6
1.1
1.5
56.1
2.0
0.1
2.1
0.5
0.5
1.1
14.3
15.3
3.0
1.4
4.4
2.3
0.9
1.4
51.6
2.1
0.1
2.2
0.6
0.5
1.1
13.5
15.0
4Q
3.2
1.3
4.5
2.4
0.9
1.5
53.2
2.1
0.2
2.3
0.6
0.6
1.1
14.3
16.4
1Q
3.3
1.5
4.8
2.6
1.0
1.5
53.2
2.2
0.4
2.6
0.6
0.7
1.3
14.4
19.3
FY11
2Q
3Q
3.5
1.7
5.2
2.5
1.0
1.5
49.3
2.6
0.1
2.7
0.6
0.8
1.4
12.0
16.8
3.5
1.7
5.2
2.6
1.0
1.7
50.1
2.6
0.2
2.8
0.5
0.8
1.5
10.6
15.8
4Q
3.6
1.5
5.1
2.5
0.9
1.6
49.1
2.6
0.2
2.7
0.4
0.8
1.6
10.8
17.1
1Q
3.3
1.6
4.9
2.5
0.9
1.6
50.9
2.4
0.2
2.7
0.4
0.7
1.5
11.3
17.4
FY12
2Q
3Q
3.4
1.7
5.1
2.6
0.9
1.7
51.6
2.5
0.2
2.7
0.4
0.8
1.6
11.4
17.8
3.3
1.9
5.2
2.6
1.0
1.7
50.9
2.5
0.1
2.6
0.3
0.8
1.6
11.7
18.2
4Q
3.3
1.9
5.2
2.7
0.9
1.7
51.8
2.5
0.2
2.7
0.3
0.8
1.6
12.0
19.1
1Q
3.3
1.8
5.1
2.7
1.0
1.7
53.0
2.4
0.3
2.7
0.4
0.8
1.6
12.2
19.4
FY13
2Q
3.3
1.9
5.3
2.7
1.1
1.6
50.9
2.6
0.2
2.7
0.3
0.8
1.6
12.0
19.6
3Q
3.6
2.0
5.6
2.8
1.0
1.8
50.9
2.7
0.2
2.9
0.5
0.8
1.6
10.2
16.8
7

IndusInd Bank
Quarterly Snapshot
FY12
1Q
Profit and Loss
Net Interest Income
3,900
Other Income
2,154
Trading profits
278
Profits on sale of assets
5
Others (Ex non core)
1,871
Total Income
6,054
Operating Expenses
2,937
Employee
1,107
Others
1,830
Operating Profits
3,117
Provisions
446
PBT
2,671
Taxes
870
PAT
1,802
Asset Quality
GNPA
3,093
NNPA
838
GNPA (%)
1.1
NNPA (%)
0.3
PCR (Calculated, %)
72.9
Ratios (%)
Fees to Total Income
30.9
Cost to Core Income
50.9
Tax Rate
32.5
CASA (Reported)
28.2
Loan/Deposit
80.5
CAR
15.0
RoA
1.6
RoE
18.4
Margins (%) - Reported
Yield on loans
13.5
Cost of deposits
7.7
Margins
3.4
Balance Sheet (INR b)
Loans
284
Investments
142
Deposits
353
CASA Deposits
99
of which Savings
32
Current
67
Borrowings
66
Total Assets
478
Risk Weighted Assets
323
For %age change QoQ and YoY is bp
2Q
4,192
2,392
239
5
2,148
6,584
3,254
1,152
2,102
3,330
470
2,860
929
1,931
3,326
931
1.1
0.3
72.0
32.6
51.3
32.5
27.7
78.5
14.3
1.6
18.8
13.8
8.2
3.4
301
143
384
106
33
73
60
505
329
3Q
4,307
2,651
131
17
2,504
6,958
3,465
1,261
2,204
3,492
428
3,064
1,005
2,060
3,342
936
1.0
0.3
72.0
36.0
50.9
32.8
26.5
79.9
13.4
1.6
19.1
13.8
8.2
3.3
324
154
406
108
40
68
81
551
352
4Q
4,644
2,921
274
7
2,640
7,565
3,774
1,334
2,439
3,791
460
3,331
1,097
2,234
3,471
947
1.0
0.3
72.7
34.9
51.8
32.9
27.3
82.8
13.9
1.6
20.0
13.9
8.3
3.3
351
146
424
116
47
69
87
576
392
FY12
1Q
2Q
4,841
3,188
497
1
2,690
8,029
3,989
1,526
2,463
4,040
535
3,505
1,143
2,363
3,651
999
1.0
0.3
72.6
33.5
53.0
32.6
27.9
82.6
12.9
1.6
20.4
14.0
8.9
3.2
372
163
451
126
51
74
87
607
420
5,097
3,205
218
0
2,987
8,302
4,104
1,621
2,484
4,198
491
3,708
1,205
2,503
4,095
1,143
1.0
0.3
72.1
36.0
50.8
32.5
28.0
82.5
11.8
1.6
20.5
13.9
8.7
3.3
394
156
478
134
53
81
67
621
449
3Q
5,778
3,558
177
0
3,381
9,336
4,614
1,685
2,930
4,722
787
3,935
1,262
2,673
4,216
1,252
1.0
0.3
70.3
36.2
50.4
32.1
28.7
83.0
15.0
1.6
17.4
13.7
8.4
3.5
424
176
511
147
62
85
66
679
484
-22
-25
21
8
13
7
10
16
5
-3
9
8
-7
27
21
31
15
26
36
55
25
-19
23
38
Source: Company/MOSL
Variation (%)
Cumulative Numbers
QoQ
YoY 9MFY12 9MFY13 YoY Gr (%)
13
11
-19
N.A.
13
12
12
4
18
12
60
6
5
7
3
10
-4
1
-179
34
34
35
N.A.
35
34
33
34
33
35
84
28
26
30
26
34
-3
1
-171
33.3
51.0
33
35.3
51.3
32
12,399
7,197
648
27
6,523
19,596
9,656
3,521
6,136
9,939
1,344
8,596
2,803
5,792
15,716
9,951
891
1
9,059
25,667
12,707
4,831
7,876
12,960
1,813
11,148
3,610
7,538
27
38
38
-96
39
31
32
37
28
30
35
30
29
30
13.7
8.0
3.3
13.9
8.7
3.3
10 January 2013
8

IndusInd Bank
EPS: MOSL forecast v/s consensus (INR)
MOSL
Forecast
FY13
FY14
20.0
26.0
Consensus
Forecast
21.1
26.7
Variation
(%)
-5.2
-2.6
1-year Sensex rebased
Shareholding pattern (%)
Dec-12
Promoter
Domestic Inst
Foreign
Others
15.3
8.8
39.0
36.8
Sep-12
22.5
9.0
39.7
28.8
Dec-11
22.6
7.7
40.3
29.4
DuPont Analysis: Core operations have improved significantly
Y/E March
Net Interest Income
Fee income
Fee to core Income (%)
Core Income
Operating Expenses
Cost to Core Income
Employee cost
Employee to total exp (%)
Other operating expenses
Core Operating Profits
Trading and others
Operating Profits
Provisions
NPA provisions
Other Provisions
PBT
Tax
Tax Rate (%)
RoA
Leverage
RoE
2005
2.7
1.2
30.1
3.9
1.7
44.6
0.4
22.7
1.3
2.1
0.5
2.6
0.9
0.4
0.5
1.7
0.3
19.3
1.4
18.8
25.8
2006
1.9
1.0
33.7
2.9
1.9
66.7
0.5
26.8
1.4
1.0
0.2
1.1
0.8
0.5
0.2
0.4
0.1
37.8
0.2
19.6
4.3
2007
1.4
1.2
46.2
2.6
1.8
68.2
0.5
28.0
1.3
0.8
0.1
0.9
0.3
0.3
0.0
0.6
0.2
36.5
0.4
20.0
7.1
2008
1.4
1.2
46.2
2.5
1.8
71.9
0.6
30.3
1.3
0.7
0.2
0.9
0.4
0.3
0.1
0.5
0.2
34.3
0.3
20.4
6.9
2009
1.8
1.3
42.4
3.1
2.2
68.7
0.7
34.2
1.4
1.0
0.5
1.4
0.6
0.5
0.1
0.9
0.3
34.8
0.6
20.0
11.7
2010
2.8
1.4
32.8
4.2
2.3
55.8
0.9
39.5
1.4
1.9
0.4
2.2
0.5
0.4
0.1
1.7
0.6
34.3
1.1
17.5
19.5
2011
3.4
1.6
31.4
5.0
2.5
50.3
0.9
37.9
1.5
2.5
0.2
2.7
0.5
0.4
0.1
2.2
0.7
34.4
1.4
13.5
19.3
2012
3.3
1.8
34.9
5.1
2.6
51.3
0.9
36.1
1.7
2.5
0.2
2.7
0.3
0.3
0.1
2.3
0.8
32.7
1.6
12.4
19.2
2013E
3.5
1.9
35.2
5.4
2.8
51.5
1.0
37.2
1.8
2.6
0.2
2.8
0.4
0.3
0.1
2.4
0.8
32.5
1.6
10.7
17.5
Source:
2014E
2015E
3.7
3.8
2.0
2.0
34.3
34.2
5.7
5.7
2.9
2.8
50.3
49.3
1.1
1.1
37.1
38.1
1.8
1.8
2.8
2.9
0.3
0.3
3.1
3.2
0.5
0.5
0.5
0.5
0.1
0.1
2.6
2.7
0.8
0.9
32.5
33.0
1.7
1.8
9.7
10.3
17.0
18.4
Company, MOSL
10 January 2013
9

IndusInd Bank
Financials and Valuation
10 January 2013
10

IndusInd Bank
Financials and Valuation
10 January 2013
11

Disclosures
This report is for personal information of the authorized recipient and does not construe to be any investment, legal or taxation advice to you. This research report does not constitute an offer, invitation or inducement
to invest in securities or other investments and Motilal Oswal Securities Limited (hereinafter referred as MOSt) is not soliciting any action based upon it. This report is not for public distribution and has been
furnished to you solely for your information and should not be reproduced or redistributed to any other person in any form.
Unauthorized disclosure, use, dissemination or copying (either whole or partial) of this information, is prohibited. The person accessing this information specifically agrees to exempt MOSt or any of its affiliates
or employees from, any and all responsibility/liability arising from such misuse and agrees not to hold MOSt or any of its affiliates or employees responsible for any such misuse and further agrees to hold MOSt
or any of its affiliates or employees free and harmless from all losses, costs, damages, expenses that may be suffered by the person accessing this information due to any errors and delays.
The information contained herein is based on publicly available data or other sources believed to be reliable. While we would endeavour to update the information herein on reasonable basis, MOSt and/or its
affiliates are under no obligation to update the information. Also there may be regulatory, compliance, or other reasons that may prevent MOSt and/or its affiliates from doing so. MOSt or any of its affiliates or
employees shall not be in any way responsible and liable for any loss or damage that may arise to any person from any inadvertent error in the information contained in this report . MOSt or any of its affiliates
or employees do not provide, at any time, any express or implied warranty of any kind, regarding any matter pertaining to this report, including without limitation the implied warranties of merchantability, fitness
for a particular purpose, and non-infringement. The recipients of this report should rely on their own investigations.
This report is intended for distribution to institutional investors. Recipients who are not institutional investors should seek advice of their independent financial advisor prior to taking any investment decision
based on this report or for any necessary explanation of its contents.
MOSt and/or its affiliates and/or employees may have interests/positions, financial or otherwise in the securities mentioned in this report. To enhance transparency, MOSt has incorporated a Disclosure of Interest
Statement in this document. This should, however, not be treated as endorsement of the views expressed in the report.
Disclosure of Interest Statement
1. Analyst ownership of the stock
2. Group/Directors ownership of the stock
3. Broking relationship with company covered
4. Investment Banking relationship with company covered
IndusInd Bank
No
No
No
No
Analyst Certification
The views expressed in this research report accurately reflect the personal views of the analyst(s) about the subject securities or issues, and no part of the compensation of the research analyst(s) was, is, or
will be directly or indirectly related to the specific recommendations and views expressed by research analyst(s) in this report. The research analysts, strategists, or research associates principally responsible
for preparation of MOSt research receive compensation based upon various factors, including quality of research, investor client feedback, stock picking, competitive factors and firm revenues.
Regional Disclosures (outside India)
This report is not directed or intended for distribution to or use by any person or entity resident in a state, country or any jurisdiction, where such distribution, publication, availability or use would be contrary to
law, regulation or which would subject MOSt & its group companies to registration or licensing requirements within such jurisdictions.
For U.K.
This report is intended for distribution only to persons having professional experience in matters relating to investments as described in Article 19 of the Financial Services and Markets Act 2000 (Financial
Promotion) Order 2005 (referred to as "investment professionals"). This document must not be acted on or relied on by persons who are not investment professionals. Any investment or investment activity to
which this document relates is only available to investment professionals and will be engaged in only with such persons.
For U.S.
Motilal Oswal Securities Limited (MOSL) is not a registered broker - dealer under the U.S. Securities Exchange Act of 1934, as amended (the"1934 act") and under applicable state laws in the United States.
In addition MOSL is not a registered investment adviser under the U.S. Investment Advisers Act of 1940, as amended (the "Advisers Act" and together with the 1934 Act, the "Acts), and under applicable state
laws in the United States. Accordingly, in the absence of specific exemption under the Acts, any brokerage and investment services provided by MOSL, including the products and services described herein
are not available to or intended for U.S. persons.
This report is intended for distribution only to "Major Institutional Investors" as defined by Rule 15a-6(b)(4) of the Exchange Act and interpretations thereof by SEC (henceforth referred to as "major institutional
investors"). This document must not be acted on or relied on by persons who are not major institutional investors. Any investment or investment activity to which this document relates is only available to major
institutional investors and will be engaged in only with major institutional investors. In reliance on the exemption from registration provided by Rule 15a-6 of the U.S. Securities Exchange Act of 1934, as amended
(the "Exchange Act") and interpretations thereof by the U.S. Securities and Exchange Commission ("SEC") in order to conduct business with Institutional Investors based in the U.S., MOSL has entered into
a chaperoning agreement with a U.S. registered broker-dealer, Marco Polo Securities Inc. ("Marco Polo"). Any business interaction pursuant to this report will have to be executed within the provisions of this
chaperoning agreement.
This website and its respective contents does not constitute an offer or invitation to purchase or subscribe for any securities or solicitation of any investments or investment services and/or shall not be considered
as an advertisement tool. "U.S. Persons" are generally defined as a natural person, residing in the United States or any entity organized or incorporated under the laws of the United States. US Citizens living
abroad may also be deemed "U.S. Persons " under certain rules.
The Research Analysts contributing to the report may not be registered /qualified as research analyst with FINRA. Such research analyst may not be associated persons of the U.S. registered broker-dealer, Marco
Polo, and therefore, may not be subject to NASD rule 2711 and NYSE Rule 472 restrictions on communication with a subject company, public appearances and trading securities held by a research analyst account.
For Singapore
Motilal Oswal Capital Markets Singapore Pte Limited is acting as an exempt financial advisor under section 23(1)(f) of the Financial Advisers Act(FAA) read with regulation 17(1)(d) of the Financial Advisors
Regulations and is a subsidiary of Motilal Oswal Securities Limited in India. This research is distributed in Singapore by Motilal Oswal Capital Markets Singapore Pte Limited and it is only directed in Singapore
to accredited investors, as defined in the Financial Advisers Regulations and the Securities and Futures Act (Chapter 289), as amended from time to time.
In respect of any matter arising from or in connection with the research you could contact the following representatives of Motilal Oswal Capital Markets Singapore Pte Limited:
Nihar Oza
Kadambari Balachandran
Email: niharoza.sg@motilaloswal.com
Email : kadambari.balachandran@motilaloswal.com
Contact: (+65) 68189232
Contact: (+65) 68189233 / 65249115
Office address: 21 (Suite 31), 16 Collyer Quay, Singapore 049318
Motilal Oswal Securities Ltd
Motilal Oswal Tower, Level 9, Sayani Road, Prabhadevi, Mumbai 400 025
Phone: +91 22 3982 5500 E-mail: reports@motilaloswal.com