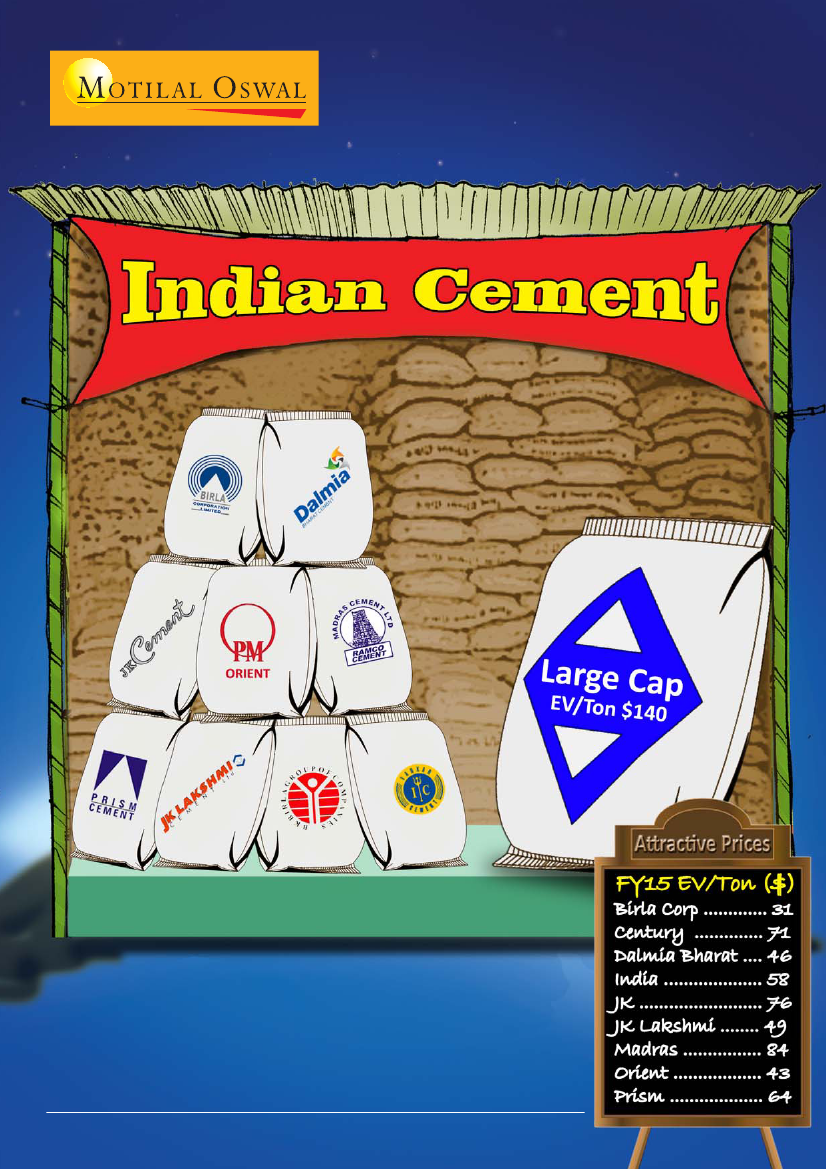
January 2013
Cement
Mid Caps: Ripe for re-rating
Jinesh Gandhi
(Jinesh@MotilalOswal.com) + 91 22 3982 5416
Sandipan Pal
(Sandipan.Pal@MotilalOswal.com); +9122 3982 5436

Cement
Mid Caps: Ripe for re-rating
Page No.
Summary
........................................................................................................................
3-10
View on sector remains positive
................................................................................
11-13
Mid Caps' operating performance to improve
.........................................................
14-15
Applying 5-S scale to pick potential winners
...........................................................
16-19
Recommend basket of BCORP, DBEL, JKCE and OPI
..................................................
20-23
Companies
..................................................................................................................
24-126
Birla Corporation (BCORP)
...................................................................
25-29
Century Textiles (CENT)
........................................................................
30-42
Dalmia Bharat (DBEL)
...........................................................................
43-56
India Cements (ICEM)
............................................................................
57-61
JK Cement (JKCE)
...................................................................................
62-75
JK Lakshmi Cement (JKLC)
.....................................................................
76-87
Madras Cements (MC)
..........................................................................
88-99
Orient Paper Industries (OPI)
..........................................................
100-112
Prism Cement (PRSC)
........................................................................
113-126
Prices as on 15 January 2013
January 2013
2

Update
Cement
Mid Caps: Ripe for re-rating
Catalysts: Improving utilization, narrowing operating performance gap
Our view on the Cement sector remains positive, driven by expected pick-up in demand
and slowing capacity addition, thereby driving utilization, pricing and profitability.
Mid Cap Cement stocks are trading at very attractive earnings valuations and significant
discount to replacement cost and large peers. As the operating performance improves, the
Mid Caps should see a re-rating. Pick-up in M&A activity is another potential re-rating trigger.
Mid Caps offer base case upside of over 50%. We initiate coverage on seven Mid Cap
Cement stocks. Buy BCORP, DBEL, JKCE, JKLC, OPI, MC and ICEM; Neutral on CENT and PRSC.
View on sector positive; reflected in re-rating of large caps
Our view on the Cement sector remains positive. Short-term volatility
notwithstanding, we expect sustained volume recovery (~9% CAGR over FY13-15),
slowing capacity addition and higher opex/capex cost to result in strong pricing (INR15/
INR12/bag increase in FY14/FY15). This coupled with cost stabilization, albeit at higher
levels, will drive profitability improvement and capital efficiencies. We expect the
outperformance to continue (after 38% outperformance in CY12), driven by volume
growth recovery, stabilizing cost and improving profitability.
Companies covered
Initiating Coverage
Century Textiles
Dalmia Bharat
JK Cement
JK Lakshmi Cement
Madras Cements
Orient Paper Inds
Prism Cement
Pg
30
43
62
76
88
100
113
Mid Caps' operating performance to improve, driving re-rating
We expect the profitability of our Mid Cap Cement Universe to improve by INR154/80
per ton in FY14/FY15 to INR1,033/INR1,113 per ton. We estimate EPS growth of ~42%
CAGR (FY13-15E) for MOSL Mid Cap Universe, translating into ~550bp RoE improvement
as against ~180bp RoE improvement for the Large Caps. Narrowing of the operating
performance gap will drive re-rating.
Existing Coverage
Birla Corporation
India Cements
25
57
Applying 5-S scale to pick potential winners
We have applied a 5-S scale to objectively evaluate 9 Mid Cap Cement companies on
(1) size & scalability, (2) sales mix, (3) supply chain efficiencies, (4) strategic & other
issues, and (5) strength of financials. While the 5-S score ranks these companies on
relative attractiveness on operating parameters, we weigh the 5-S score against the
valuation score to pick potential winners. Based on the 5-S / valuation score analysis,
BCORP and DBEL are the most attractive. JKCE, OPI and MC offer favorable trade-off of
quality and attractive valuations.
Attractive valuations - base case returns of 50%+, bull case returns of 2-4x
Our Mid Cap Cement Universe is currently trading at very attractive valuations of
~4.7x/3.9x FY14/FY15 EV/EBITDA and ~USD69/USD64 EV/Ton (FY14/FY15), considering
improvement in operating performance and superior earnings growth. We believe
the Mid Caps offer better risk-reward and initiate coverage on seven Mid Cap Cement
stocks. We recommend
Buy
on BCORP, DBEL, JKCE, JKLC, OPI, MC, and ICEM and
Neutral
on CENT and PRSC. While base case return is over 50% (based on FY15 estimates), bull
case returns could be 2-4x
(see our Blue Sky Scenario).
Cement upcycle, improvement
in operating performance for Mid Caps, balance sheet deleveraging and increase in
industry consolidation driven by M&A activity would be catalysts for re-rating.
January 2013
3

Cement
Operating matrix
Capacity (MT)
FY13E
FY14E
FY15E
ACC*
Ambuja*
UltraTech
Shree Cement
Large Caps
Birla Corp
India Cements
Dalmia Bharat
JK Cement
JK Lakshmi
Madras Cements
Orient Paper
Century Textiles
Prism Cement
Mid Caps
Aggregate
30.7
27.5
50.4
15.5
124.0
9.3
15.1
11.8
8.0
5.3
13.6
5.0
10.0
5.6
83.7
207.7
30.7
27.5
60.6
17.5
136.2
9.3
15.1
12.3
8.6
8.0
13.6
5.0
12.8
5.6
90.4
226.6
30.7
27.5
60.6
19.0
137.7
9.3
15.1
15.0
11.6
8.5
13.6
8.0
12.8
5.6
99.6
237.3
Volumes (MT)
FY13E
FY14E
FY15E
24.2
22.5
43.2
13.6
103.4
6.5
10.5
5.7
6.4
5.4
8.5
4.2
8.0
5.1
60.3
163.7
26.6
24.7
47.1
14.6
113.0
7.0
11.6
6.3
7.2
5.9
9.4
4.6
8.8
5.8
66.6
179.6
29.3
26.7
50.4
15.8
122.2
7.7
12.8
7.1
8.1
6.8
10.3
5.2
9.9
6.4
74.3
196.5
EBITDA (INR/Ton)
FY13E
FY14E
FY15E
841
1,121
1,088
1,173
1,048
607
888
1,141
914
804
1,251
759
516
447
833
969
900
1,146
1,310
1,339
1,181
742
1,001
1,241
1,134
957
1,360
908
654
747
983
1,108
972
1,218
1,368
1,449
1,251
875
1,070
1,325
1,395
1,046
1,461
1,007
734
853
1,094
1,191
EBITDA (%)
FY13E
FY14E
FY15E
19.0
25.5
22.1
28.7
23.0
15.3
20.6
24.7
19.2
20.4
28.7
8.6
8.7
6.3
17.8
21.1
19.3
24.8
24.8
29.8
24.1
17.4
22.1
25.5
21.5
22.6
29.3
12.4
9.9
10.6
19.6
22.5
19.8
25.0
24.3
30.0
24.1
19.6
22.6
26.0
22.7
23.4
29.8
13.7
11.2
11.4
20.6
22.8
Financial matrix
EPS (INR)
FY13E
FY14E
ACC*
Ambuja*
UltraTech
Shree Cement
Large Caps
Birla Corp
India Cements
Dalmia Bharat
JK Cement
JK Lakshmi
Madras Cements
Orient Paper
Century Textiles
Prism Cement
Mid Caps
Aggregate
66.0
10.6
100.6
306.6
34.7
7.7
27.9
30.6
15.9
19.7
6.0
-10.6
-0.1
80.4
12.2
129.2
375.6
43.3
12.6
36.1
42.8
20.3
25.6
10.6
-5.9
4.2
FY15E
98.2
14.4
147.7
461.1
58.8
18.1
38.1
60.3
25.1
33.1
12.7
4.6
6.5
RoE (%)
FY13E
FY14E
16.8
19.3
19.6
34.1
20.8
10.9
5.1
8.5
13.3
15.0
20.8
10.7
-1.7
-0.3
11.2
17.7
19.0
20.1
21.1
33.1
22.5
12.3
7.8
10.1
16.5
16.7
22.4
17.1
-0.8
17.6
15.3
20.3
FY15E
20.8
21.1
20.2
30.9
22.9
14.7
10.8
10.0
19.4
17.9
23.5
17.9
0.5
23.5
17.9
21.3
RoCE (%)
FY13E
FY14E
18.0
28.7
23.2
27.8
23.7
11.9
8.5
11.1
16.1
15.6
18.2
12.6
-5.4
7.3
10.3
18.8
20.6
29.1
26.0
25.3
25.3
13.7
10.3
11.5
17.2
17.1
21.0
18.3
-3.2
19.3
13.2
20.8
FY15E
23.0
30.4
25.9
27.8
26.4
16.2
12.7
11.9
19.1
18.5
24.8
17.4
2.6
23.6
15.8
22.4
Net Debt:Equity (x)
FY13E
FY14E
FY15E
-0.4
-0.4
0.1
-0.5
-0.2
-0.1
0.7
0.7
0.9
0.5
1.0
0.5
2.9
1.2
1.0
0.2
-0.4
-0.4
0.1
-0.5
-0.2
-0.2
0.6
0.8
1.3
0.7
0.6
0.7
3.6
1.0
1.1
0.2
-0.5
-0.4
-0.1
-0.7
-0.3
-0.3
0.4
0.6
1.1
0.5
0.2
1.0
3.8
0.8
0.9
0.2
January 2013
4

Cement
Valuations summary
Reco
CMP
TP
(INR) FY15
(INR)
1,387 1,712
198 233
1,920 2,351
4,517 6,157
319
88
193
337
141
233
79
427
49
Up-
PE
EV/EBITDA
EV/Ton (USD)
EV/ Blue-
side
(x)
(x)*
at CMP*
Ton Sky
(%) FY13E FY14E FY15E FY13E FY14E FY15E FY13E FY14E FY15E at TP
TP
23.4
17.9
22.4
36.3
21.0 17.3
18.7 16.3
19.1 14.9
14.7 12.0
18.6 15.1
9.2
7.4
11.5
7.0
6.9
5.3
11.0
7.9
8.9
7.0
11.8
9.1
13.1
7.5
-40.4 -72.1
-724.4 11.7
11.9
7.9
17.3 13.4
14.1
13.7
13.0
9.8
12.9
5.4
4.9
5.1
5.6
5.6
7.0
6.2
93.0
7.5
6.0
11.1
11.1
10.5
10.6
7.8
10.1
5.2
5.8
5.4
5.1
4.0
6.8
8.4
15.6
12.1
6.2
8.9
8.9
9.0
8.3
6.3
8.2
3.6
4.5
4.3
4.5
4.3
5.3
4.3
14.5
5.9
4.7
7.1
6.9
7.3
7.3
4.7
6.8
2.3
3.5
4.0
4.4
3.2
3.9
5.7
11.0
4.6
3.9
5.9
135.2
176.3
180.3
143.5
164.3
40.4
66.1
54.8
69.4
59.6
105.6
52.1
74.3
99.9
73.1
130.3
128.0
169.4
154.9
122.9
148.3
36.3
63.5
49.5
76.7
55.7
98.1
28.7
78.6
77.0
68.9
119.5
116.5 153
158.6 195
152.1 188
97.9 153
140.1
30.8
53 667
57.7
69 217
45.9
69 669
76.4
90 710
49.3
77 339
84.4 130 476
43.2
60 254
71.0 147 1,028
64.3
79 101
63.8
110.6
Source: Company,
Up-
side
(%)
ACC*
Neutral
Ambuja*
Buy
UltraTech
Buy
Shree Cement
Buy
Large Caps
Birla Corp
Buy
India Cements
Buy
Dalmia Bharat
Buy
JK Cement
Buy
JK Lakshmi
Buy
Madras Cements
Buy
Orient Paper
Buy
Century Textiles
Neutral
Prism Cement
Neutral
Mid Caps
Aggregate
*EV adjusted for CWIP
464 45.7
119 35.5
427 122.4
554 64.4
249 76.5
374 60.9
114 44.7
460
7.9
57 18.1
109
146
246
111
140
105
221
140
109
MOSL
January 2013
5

Cement
Blue Sky Scenario
Birla Corp
Birla Corp has the potential to double in two years, driven by:
Resolution of the mining ban at its Rajasthan plant, resulting in cost savings of
~INR1b or ~INR150/ton.
Further, the resolution of the mining ban would drive brownfield capacity
addition of ~1.5mtpa.
Captive coal block, with recoverable reserves of 9.4mt has the potential to drive
savings of ~INR720m per year.
Improvement in capital efficiency by ~200bp, led by savings in raw material cost.
Any resolution of the dispute of ownership of the MP Birla group between the
Lodha and Birla families would led to further re-rating, though this is not factored
in our blue sky scenario.
BCORP: Blue Sky Scenario (INR m)
FY15E Catalyst
8,439 Savings of ~INR1b p.a on resolution of mining ban & savings
of ~INR720m from captive coal block
EV/EBITDA Multiple (x)
5 Re-rating with valuations in-line with similar sized
companies
EV
42,196
Net Debt
-9,147
Equity value
51,343
TP (INR)
667
Upside (%)
109
EBITDA
Century Textiles
Century Textiles has potential the potential to multiply 2.5x, driven by Mr Kumar
Mangalam Birla, the Chairman of the Aditya Birla Group, inheriting his grandfather,
Mr BK Birla's interests in Century Textiles. Though a timeline cannot be assigned,
such an event could lead to the following:
Consolidation of Century Textiles' cement business with UltraTech.
Hive-off of the paper business, as it would be non-core for the Aditya Birla Group.
Sale of land bank, rather than own development, resulting in faster monetization.
CENT: Blue Sky Scenario (INR m)
Textile
Cement
Paper
Parameter
Multiple
EV/Sales
0.4
EV/ton(US$)
120
EV/Sales
2
FY15E
8,937
84,480
28,653
Remarks
No change in business fundamentals
Merger of cement assets with A.V,Birla Group
Paper business sale as part of restructuring
on inheritance by A.V.Birla Group
Others
EV/Sales
0.5
696
Total EV
122,766
Less: Net Debt
60,150
Add: Value of Land @ INR1.5/acre
33,000
Market Cap
Fair Value (INR)
Upside (%)
95,616
1,028
140
Freehold land sale rather than own devel-
opment on inheritance by A.V.Birla Group
January 2013
6

Cement
Blue Sky Scenario
Dalmia Bharat
Dalmia Bharat has the potential to be a 4-bagger in 2-3 years, driven by:
Its being one of the top-4 cement producers in India, with capacity under control
of ~22mtpa (~15mtpa based on economic interest).
Ramp-up in North-East subsidiaries, resulting in higher profitability.
Balance sheet deleveraging, driven by completion of ongoing capex and
significant improvement in cash flow from operations during the upturn in the
cement cycle.
Improvement in capital efficiency, as capex incurred over last 2-3 years starts
contributing.
DBEL: Blue Sky Scenario (FY15)
DBCL
Parameter
EV/Ton (USD)
Multiple
100
INR m Catalyst
53,367 Scale-up of capacity to 11.5mt in an upcycle,
improving utilization and beginning of
balance sheet deleveraging
8,527 Commissioning of new capacity at West
Bengal, driving volumes and profitability
6,961 Improving utilizations driven by strong
growth in North East market, enjoying very
high profitability
7,477 Commissioning of clinker capacity driving
cost savings and high profitability
76,331
21,992
54,340
669
247
OCL
Adhunik
EV/Ton (USD)
EV/Ton (USD)
100
100
Calcom
EV/Ton (USD)
100
Total EV
Less: Pro-rata Net Debt (adj for CWIP)
Total Equity Value
Fair value (INR/share)
Upside (%)
India Cements
India Cements has the potential to multiply 2.5x in 2-3 years, driven by:
Savings of ~INR850m (@ USD30/ton for 0.5m tons) from captive coal block in
Indonesia.
Valuing IPL @ USD200m, if monetized.
Re-rating, led by improvement in core profitability and monetization of IPL.
ICEM: Blue Sky Scenario (FY15)
Parameter
S/A EBITDA
Trinetra EBITDA (pro-rata)
EV @ 4x EBITDA
Value for IPL
Less: Net debt
Equity value
Target Price (INR)
Upside (%)
Implied EV/Ton (USD)
INR m
13,750
839
72,944
11,023
21,644
62,323
217
146
87
Remark
Assuming savings of ~INR850m from captive coal mine
from Indonesia
Valuing IPL at USD200m
January 2013
7

Cement
Blue Sky Scenario
JK Cement
JK Cement can multiply 2.2x in two years, driven by:
Commissioning of its white cement plant at UAE and be-bottlenecking of white
cement capacities.
Improving efficiency, driven by new gray cement plant in Karnataka and
commissioning of new capacities in Rajasthan (including split grinding units).
Balance sheet deleveraging, driven by completion of ongoing capex and
significant increase in cash flow from operations due to higher utilization during
the upturn in the cement cycle.
Improvement in capital efficiency, as capex incurred starts contributing fully to
P&L from FY15.
JKCE: Blue Sky Scenario
EV/EBITDA
Target EV/EBITDA (x)
Grey Cement
White Cement
UAE White Cement
EV (INR m)
Consol Net debt (INR m)
Equity value (INR m)
Equity value (INR/Shr)
Implied EV/Ton (blended)
Implied EV/Ton (Grey)
Implied PE (White)
6
8
8
FY14E
32253
20642
1,523
54,419
12,486
41,932
600
FY15E
39084
25613
9,846
74,543
24,879
49,664
710
117
68
12.5
JK Lakshmi
JK Lakshmi can potentially double in 2-3 years, driven by:
Ramp-up at its new plant at Durg, which will commission by March 2014, marking
JKLC's entry into East India.
The Durg plant will be more efficient and profitable, thereby boosting overall
profitability.
Balance sheet deleveraging, driven by completion of ongoing capex and
significant improvement in cash flow from operations during the upturn in the
cement cycle.
Improvement in capital efficiency, as capex incurred over the last 2-3 years
starts contributing to P&L.
JKLC: Blue Sky Scenario
EBITDA (INR m)
Target EV/EBITDA (x)
Target EV(INR m)
Net debt (INR m)
Target Equity value (INR m)
No of share (m)
Target Price (INR)
Upside (%)
EV/Ton (USD) at TP
January 2013
FY15E
8,595
5
42,977
3,014
39,964
118
340
140
92
Remarks
Factoring for scale-up of Durg plant, will boost its
overall profitability
Doesn’t include any value from UCW subsidiary
8

Cement
Blue Sky Scenario
Madras Cements
Madras Cements has the potential to double in 2-3 years, driven by:
Benefit of operating leverage, as it improves utilization from ~63% in FY13 to
~82% in FY16E.
As a result, its balance sheet will turn net cash (~INR3b) by FY16 from current
net debt (~INR25.3b).
Likely improvement in RoE from 18% to 27%.
MC: Blue Sky Scenario
FY15E
EBITDA (INR m)
Target EV/EBITDA (x)
Target EV(INR m)
Net debt (INR m)
Target Equity value (INR m)
No of share (m)
Target Price (INR)
Upside (%)
EV/Ton at TP (USD)
16,062
6
96,372
7,284
89,088
238
374
60.9
130
FY16E
18,119
6
108,714
-4,560
113,274
238
476
104.6
147
Orient Paper
Orient Paper has the potential to be a 3-bagger in 2-3 years, driven by:
Demerger of cement business (by March 2013).
Scale-up of cement business to 8mtpa amidst the cement upcycle (by 2HFY15).
Ramp-up in Electrical business, driven by continued strong growth in Fans and
CFL business, and scale-up in nascent (started in 2HFY12) Home Appliances
business (by FY15-16).
Potential hive-off of Paper business to focus on Cement and Electrical Appliance
business.
OPI: Blue Sky Scenario (FY15)
Cement
Electrical
Parameter
EV/Ton (USD)
PE
Multiple
100
20
INR m Catalyst
43,676 Scale-up of capacity to 8mt during cement
upcycle
14,990 Scale-up in home appliance business,
with continous strong growth in fans and
CFL business
8,182 Hive-off of Paper business at 40% discount
to AP Paper-International Paper deal
valuations of 2.65x EV/Sales
66,848
14,856
51,992
254
221
Paper
EV/Sales
1.6
Total EV
Less: Net Debt
Equity Value
Equity Value (INR/sh)
Upside (%)
January 2013
9

Cement
Blue Sky Scenario
Prism Cement
Prism Cement has the potential to deliver ~86% returns over the next two years,
driven by:
Savings of INR1b from captive coal block, expected from 2HFY14, which is not
factored in our base assumptions.
Coal gasification at Andhra Pradesh plant and availability of LNG at Karnataka
(in 6-9 month) driving cost savings, which are yet to be factored in.
PRSC: Blue Sky Scenario (FY15)
Cement
EV/EBITDA 5x
(INR m)
32263
Remarks
To be driven by savings of INR1b from
captive coal block, which is not factored in
our base assumptions
Factoring in for EBITDA margin
improvement to 15% driven by change in
fuel mix
RMC
TBK
EV/EBITDA 6x
EV/EBITDA 6.5x
4,232
22679
Raheja QBE
At BV
Norcros
At BV
Total EV
Less: Net debt
Equity Value
Value/share (INR)
Upside (%)
Implied Cement EV/Ton (USD)
1,224
1,064
61,463
10,386
51,076
101
109
101
January 2013
10

Cement
View on sector remains positive
Sustained volume recovery + slowing capacity addition = strong pricing,
profitability
We expect build-up in volume momentum of the last 12 months (6.8% growth), driven
by (a) interest rate cuts, (b) multiple state/general elections over FY14-15, and (c) focus
on reviving the investment cycle.
Improving demand coupled with slowing capacity addition (~64m tons over FY13-16 v/s
~105m tons over FY09-12) should drive consistent improvement in utilization to 76%/
78% in FY14/FY15.
We expect cement prices to increase by ~INR15/bag in FY14 and ~INR12/bag in FY15. This
coupled with cost stabilization, albeit at higher levels, will drive profitability improvement
and capital efficiencies.
Volume momentum to sustain
The Cement industry has witnessed continued volume recovery in 9MFY13, with 6%
YoY growth (v/s 5.6% YoY in 9MFY12) and ~6.8% TTM growth. We expect momentum to
gather further steam, driven by (a) expected interest rate cuts in 4QFY13, positively
impacting demand from the housing, infrastructure and industry segments, (b)
multiple state/general elections in the next 18 months, (c) the government's focus
on reviving investment demand, and (d) positive outlook on the Rabi crop rubbing off
on rural housing demand. We estimate volume growth of 8% for FY13 and 10% for
FY14, after 6% CAGR over FY10-12.
Increasing demand, slowing capacity addition to drive up utilization
Most of the capacity addition in the industry is behind - only ~64m tons are likely to be
added over FY13-16 as against ~105m tons over FY09-12. Further, announcements of
new capacity additions are far and few. We expect increasing demand and slowing
capacity addition to drive gradual improvement in capacity utilization. With pick-up
in demand from 2HFY12 and decline in the pace of capacity addition, we estimate
capacity utilization to have bottomed out at 74% in FY12 and expect gradual, but
consistent improvement to 76%/78% in FY14/FY15.
Improving utilization, industry discipline and higher cost to support pricing,
profitability
Improvement in capacity utilization (by at least 350bp over three years), driven by
pick-up in demand (9% CAGR over FY13-15) and slowdown in capacity addition would
be the key drivers of cement prices. Further, higher capex and opex cost would
necessitate further price increases. Based on the current variable cost and replacement
cost of USD140/ton, cement prices need to improve by INR55/bag to earn new capacities
15% RoE.
January 2013
11

Cement
Volume growth to remain robust, short-term divergence notwithstanding
Demand-supply equilibrium to turn favorable from FY13
Million tonnes
FY07
FY08
FY09
Cement Capacity (Year end)
165.7
189.0
215.2
Growth
5.2
14.0
13.9
Clinker Exports
3.1
2.4
2.9
Cement Despatches
154.9
167.7
181.4
Growth (%)
9.4
8.2
8.2
Domestic Consumption
149.4
164.0
178.2
Growth (%)
10.2
9.8
8.7
Cement Exports
5.9
3.65
3.2
Growth (%)
-2.3
-37.8
-12.3
Capacity Util (%)
95.5
90.1
85.7
Effective Cap. (Qly add-up)*
156.7
171.3
200.7
Effective Cap. Util. (%)
101.0
99.4
91.9
Source: CMA, MOST;^ based on Year ending capacity; *Effective cap
FY10
272.5
26.6
2.8
200.2
10.4
197.7
10.9
2.5
-21.9
74.6
242.3
83.9
is adj for
Source: Company, MOSL
FY11
FY12
FY13E
FY14E
FY15E
FY16E
304.2
319.6
342.4
376.4
399.9
408.7
11.6
5.1
7.2
9.9
6.2
2.2
2.6
2.6
2.6
2.6
2.6
2.6
210.3
224.8
242.6
261.9
287.9
316.4
5.0
6.9
7.9
7.9
9.9
9.9
208.2
222.8
240.6
259.9
285.9
314.5
5.3
7.0
8.0
8.0
10.0
10.0
2.1
2.0
2.0
2.0
2.0
2.0
-16.4
-5.3
0.0
0.0
0.0
0.0
70.1
71.2
71.7
70.3
72.7
78.1
282.4
306.9
327.8
353.6
380.0
398.4
75.5
74.2
74.9
74.9
76.5
80.1
non-operative cap & is quarterly add-up of cap additions
This coupled with slower capacity addition should drive gradual improvement in utilization…
…translating into strong pricing and profitability
January 2013
12

Cement
Recovery in cement prices, stable costs to drive profitability from FY13
Cement prices have been volatile in the last 3-4 months due to the monsoon and then
the festive season. We expect prices to improve from 4QFY13, translating into an
increase of INR20/bag in the average price for FY13. Further, we estimate an increase
of INR15/bag in FY14 and INR12/bag in FY15. Higher prices coupled with stabilizing
costs post the recent impact on freight cost due to increase in diesel prices will drive
profitability improvement. We expect EBITDA/ton to improve to ~INR1,156/1,242 in
FY14/15E from INR1,010 in FY13E for our Cement Universe. We estimate ~28% EPS
growth in FY14 and ~24% CAGR over FY13-15. This coupled with higher asset turnover
and lower capex should drive ~350bp RoE improvement in FY15 to ~20.7%.
Expect strong earnings growth and RoE improvement over the next two years
Source: Company, MOSL
January 2013
13

Cement
Mid Caps' operating performance to improve
Narrowing operating performance gap, possible M&A pick-up to trigger re-rating
We expect the profitability of our Mid Cap Cement Universe to improve by INR154/80
per ton in FY14/FY15 to INR1,033/INR1,113 per ton. We estimate EPS CAGR of ~42%
(FY13-15E) for MOSL Mid Cap Universe, translating into ~550bp RoE expansion.
Cement upcycle, improvement in operating performance for Mid Caps, balance sheet
deleveraging and increase in industry consolidation driven by M&A activity would be
catalysts for re-rating.
Further, stock liquidity would gradually improve, as we enter the upcycle, driven by
improvement in scale and operating performance, and increasing confidence in the
management.
Narrowing operating performance gap, possible M&A pick-up to drive stock
performance
Trend in M&A deals (USD/ton)
Acquirer
Target
Valn
210
98
135
212
215
80
68
115
130
1.Holcim
Ambuja
2.HeidelbergMysoreCem
3.Cimpor
ShriDigvijay
4.CRH
MyHome
5.Vicat
Bharathi
6.KKR
DBEL
7.JP Group AndhraCem
8.DBEL
Calcom
9.DBEL
Adhunik
We believe that the current cheap valuations of Mid Caps are unsustainable. Re-
rating would be driven by (a) improvement in the cement cycle, (b) narrowing of the
operating performance gap, and (c) higher M&A activity. We expect the profitability
of our Mid Cap Cement Universe to improve by INR154/80 per ton in FY14/FY15 to
INR1,033/INR1,113 per ton. We estimate EPS growth of ~42% CAGR (FY13-15E) for
MOSL Mid Cap Universe, translating into ~550bp RoE improvement for our Mid Cap
Cement Universe (as against ~200bp RoE improvement for the Large Caps). Further,
any increase in industry consolidation, driven by pick-up in M&A activity will also act
as a re-rating trigger. Anecdotal evidence suggests that M&A activity results in an
improvement in the valuations of Mid Caps.
Trend in EBITDA/ton
Market share of MOSL Mid Cap Cement Universe
Trend in RoE (%)
Re-rating to be driven by cement cycle upturn and revival in M&A
(1)
(3) (4)
(5) (6)
(7)
(8)
(9)
(2)
January 2013
14

Cement
Liquidity for Mid Caps poor
currently (INR m)
6m avg Free-
vol. float (%)
Ambuja Cem.
476 49.3
ACC
414 49.7
UltraTech Cem. 339 37.2
Century Textiles 330 59.6
Grasim Inds
258 74.5
India Cements 151 71.8
Shree Cement
99 35.2
Madras Cement 54 57.7
J K Cements
44 33.4
JK Lakshmi Cem. 40 54.1
Orient Paper
21 62.5
Birla Corpn.
14 37.1
Prism Cement
13 25.1
Dalmia Bharat
3 34.8
Stock liquidity to follow improvement in operating fundamentals
Current liquidity for Cement Mid Cap stocks is poor and results in high impact cost.
However, we believe liquidity for these Mid Caps will improve as operating
fundamentals continues to improve. Stock liquidity would gradually improve, driven
by a) sector upcycle, b) improvement in their scale, c) improvement in operating
performance, and d) increasing confidence in the management driven by deliverance/
execution capabilities. Poor liquidity notwithstanding, current valuations offers
significant margin of safety and scope for very high returns even after incurring impact
cost.
Mid Caps trading at above average discount to large caps and replacement
cost
Mid Cap Cement stocks are trading at ~60% discount to Large Caps on the basis of EV/
ton and at ~44% discount on the basis of EV/EBITDA. They are available at ~52% discount
to replacement cost against the long period average of ~25%. The long period average
discount to Large Caps is 37% on EV/ton basis and 25% on EV/EBITDA basis. While
some discount vis-à-vis large caps is justified on the basis of (a) size, (b) market
concentration, (c) capital allocation, (d) management bandwidth, (e) balance sheet
quality, and (f) liquidity, the current discounts are too steep and are unlikely to sustain.
Trend in EV/ton (USD)
Trend in discounts (%)
Trend in EV/EBITDA
January 2013
15

Cement
Applying 5-S scale to pick potential winners
BCORP and DBEL are the most attractive
We have applied a 5-S scale to objectively evaluate 8 Mid Cap Cement companies on (1)
size & scalability, (2) sales mix, (3) supply chain efficiencies, (4) strategic & other issues,
and (5) strength of financials.
While the 5-S score ranks these companies on their relative attractiveness on operating
parameters, we weigh the 5-S score against the valuation score to pick potential winners.
Based on the 5-S / valuation score analysis, Birla Corp (BCORP) and Dalmia Bharat (DBEL)
are the most attractive. JK Cement (JKCE), JK Lakshmi (JKLC), Orient Paper (OPI) and
Madras Cements (MC) offer favorable trade-off of quality and attractive valuations.
5-S scale - focus on key operating and financial parameters
We have formulated a 5-S scale to objectively evaluate Mid Cap Cement companies
on key operational and financial parameters. We have applied it to the 9 companies
covered in this report - Birla Corp (BCORP), India Cements (ICEM), Century Textiles
(CENT), Dalmia Bharat (DBEL), JK Cement (JKCE), JK Lakshmi (JKLC), Madras Cements
(MC), Orient Paper (OPI) and Prism Cement (PRSC). We have evaluated these
companies on (1) size & scalability, (2) sales mix, (3) supply chain efficiencies, (4)
strategic & other issues, and (5) strength of financials. These parameters have been
weighted in terms of their relative importance.
While 5-S score ranks these companies on their relative attractiveness on operating
parameters, we weigh the 5-S score against the valuation score to pick potential
winners from the group. Based on the 5-S / valuation score analysis, BCORP and DBEL
are the most attractive. JKCE, JKLC, OPI and MC offer favorable trade-off of quality
and attractive valuations. On the other hand, PRSC and CENT do not offer favorable
risk-reward, considering that their 5-S / valuation scores are the lowest.
5-S Matrix for Mid Cap Cement companies
Ratings Scale [100]
BCORP ICEM CENT DBEL JKCE JKLC MC OPI PRSC
1. Size & scalability [30]
18
23
22
29
23
17
24
22
12
a. Existing capacity [15]
10
15
12
14
10
7
13
7
7
b. Room for growth [15]
8
8
10
15
13
10
11
15
5
2. Sales Mix [20]
16
12
18
14
16
15
13
15
17
a. Quantitative [14]
12
9
14
10
11
11
9
12
14
b. Qualitative [6]
4
3
4
4
5
4
4
3
3
3. Supply chain efficiencies [20]
14
10
11
10
10
12
8
12
10
a. Cost Structure [12]
10
4
8
5
7
10
6
12
5
b. Cost saving potential [8]
4
6
3
5
3
2
2
0
5
4. Strategic & Other issues [10]
7
3
5
9
10
9
9
8
3
a. Other businesses/Diversification
5
2
2
5
5
5
4
3
1
b. Management/Strategic issues
2
1
3
4
5
4
5
5
2
5. Strength of financials [20]
12
10
7
12
10
13
14
9
12
a. Profit & earnings growth [12]
6
7
7
9
6
9
7
6
8
- EBITDA/Ton [4]
2
3
0
4
1
3
4
2
0
- PAT Growth (FY12-15E CAGR) [4]
2
1
4
3
4
4
2
0
4
- Dividend Payout (%) [4]
2
3
3
2
1
2
1
4
4
b. Capital structure & efficiencies [8]
6
3
0
3
4
4
7
3
4
- Net Debt:Equity (x) [4]
4
2
0
2
1
2
3
1
1
- RoCE (%) [4]
2
1
0
1
3
2
4
2
3
5-S Score
67
58
63
74
69
66
68
66
54
Source: Company, MOSL
January 2013
16

Cement
Valuation score for Mid Cap Cement companies
Valuations [100]
- EV/ton [30]
- EV/EBITDA [30]
- PE [20]
- PB [20]
Valuation Score
BCORP
30
30
18
16
94
ICEM
24
28
19
18
89
CENT
20
10
6
6
42
DBEL
28
28
20
20
96
JKCE
20
25
20
16
81
JKLC
24
28
18
15
85
MC
OPI
PRSC
15
28
20
25
20
15
15
16
10
10
15
8
65
79
53
Source: Company, MOSL
5-S-Valuation score matrix
Source: Company, MOSL
We discuss each of the 5-S parameters and enlist the rationale behind the scores
assigned.
1. Size & scalability [30]
Existing Room for
capacity
growth
[15]
[15]
10
8
Total
Remark
BCORP
Current cap. at 9.3mt, with no visibility of new
capacity addition
ICEM
15
8
23
Largest cap. with 15.1mt, with no further capacity
addition till FY15
CENT
12
10
22
Current cap. of 10mt, with additional 2.8mt by 2HFY14
DBEL
14
15
29
Existing cap. of 11.8mt (~17mt under control) going up
to 15mt by FY15 (~22mt under control)
JKCE
10
13
23
Existing capacity of 7.5mt, being expanded to 10.5%
by 2HFY14
JKLC
7
10
17
Current cap. of 5.2mt, with additional 2.7mt at Durg
by Dec-13
MC
13
11
24
No further cap. addition expected beyond 13.6mt
OPI
7
15
22
Current cap. of 5mt, with additional 3mt by 2HFY15
PRSC
7
5
12
Among smallest player within the group with no new
cap. expected till FY15, leaving limited headroom
to grow
Rated based on capacities as of FY13, with highest score for biggest company (based on economic
interest). Also, qualitative assesment of adequacy of clinker capacity to meet grinding capacity.
18
January 2013
17

Cement
2. Sales Mix [20]
Quantitative
[14]
BCORP
12
ICEM
9
Qualitative
[6]
4
3
Total
16
12
Remark
Focus on North, Central & East
Dominant in South, with smaller diversification to
West and North. Even within South, higher
contribution from AP.
CENT
14
4
18
Focus on East, Central and West, with new
capacities coming in East and West
DBEL
10
4
14
South and East focused mix, but AP only ~8%
of total volumes
JKCE
11
5
16
Focus on North with 50% contribution, with balance
equally coming from West, Central and South
JKLC
11
4
15
Focus on North and Gujarat market, however, new
plant at Durg to diversify in East
MC
9
4
13
South concentration, with small contribution from
East. Enjoys best realizations within the group.
OPI
12
3
15
Maharashtra and AP focused player, with new plant
at Karnataka to increase contribution from South
PRSC
14
3
17
Central and East focus play, resulting in above
average realizations. Plans to set-up plant in AP.
Focus on current market mix, based on demand-supply equilibrium. Further, qualitative assessment of
state mix within regional mix, any potential mix change due to new capacities and pricing power.
3. Supply chain efficiencies [20]
Cost Cost saving
Structure potential
[12]
[8]
10
4
Total
Remark
BCORP
Cost efficient producer, being currently impacted
by limestone mining ban at its Rajasthan plant.
Any resolution of mining ban and operating
leverage will help reducing cost.
ICEM
4
6
10
Highest cost structure within the group. However,
increase in contribution from CPP, captive
Indonesian coal and operating leverage to drive
cost savings.
CENT
8
3
11
Higher dependence on linkage coal. New CPP and
new plant to improve cost structure, but shrinking
linkage coal & to hurt energy cost.
DBEL
5
5
10
Higher energy cost & -ve op. leverage resulting in
high cost structure; Calcom clinker plant and OCL
captive mine potential cost saving triggers.
JKCE
7
3
10
Newer plants to improve operating
efficiencies;Focus on increasing rail usage
JKLC
10
2
12
Cost efficient player, with no dependence on
linkage coal. However, new plant to result in
operating deleverage
MC
6
2
8
Average cost producer, with potential cost saving
from new CPP & improving utilizations
OPI
12
0
12
Least cost producer currently due to higher
dependence on linkage coal, which is expected to
shrink
PRSC
5
5
10
Reconstruction of Silo at new plant to drive
improvement in utilizations and save cost; Captive
coal mine to start operations in 2HFY14 and drive
savings of INR1b
Evaluated based on current cost structure (FY13) and potential changes in cost structure
18
14
January 2013

Cement
4. Strategic & Other issues [10]
Other Management/
businesses/
Strategic
Diversification
issues
BCORP
5
3
Total
Remark
No significant other businesses; Professional management till ownership
issue is resolved; Captive coal block offer option value; Future capacity
growth constraint by litigation
ICEM
2
1
3
Capital allocation to shipping for ferrying own coal and investment in IPL;
Further significant inter group company loans given; Treasury stock remains
unutilized
CENT
2
3
5
Significant capital allocation to Textile and Papers; Real estate would drive
value, although realization would be back ended; K.M.Birla to inherit this
company
DBEL
5
4
9
Pure Cement play post demerger; However, recent open offer for DBSL for
26% stake is not consistent with demerger of cement to bring focus
JKCE
5
5
10
Allied White Cement business is cash cow with very high profitability
JKLC
5
4
9
Pure Cement company; Bought back shares; Acquiring defunct Udaipur Cement
Works from the promoter group companies
MC
4
5
9
Has 15% of capital employed in Windpower, which has poor RoCE
OPI
3
5
8
Both paper and electrical businesses would witness cost savings/
improvement in margins in FY14-15; Cement being demerged into separate
company
PRSC
1
2
3
Significant capital allocation to TBK and RMC; Investments in General
Insurance business and merger of RMC & TBK at very high valuations for
promoter companies
Assigning higher score for companies with pure play on cement, attractiveness of other businesses for diversified players. Also, evaluating
any management/ strategic issues influencing companies
8
5. Strength of financials [20]
Profit & earnings growth [12]
Capital structure & efficiencies [8]
EBITDA
PAT Gr.
Dividend
Net Debt:
RoCE (%)
/Ton
(FY12-15E
Payout (%)
Equity (x)
[4]
[4]
CAGR) [4]
[4]
[4]
BCORP
ICEM
CENT
DBEL
JKCE
JKLC
MC
OPI
PRSC
2
3
0
4
1
3
4
2
0
2
1
4
3
4
4
2
0
4
2
3
3
2
1
2
1
4
4
4
2
0
2
1
2
3
1
1
Total
2
12
1
10
0
7
1
12
3
10
2
13
4
14
2
9
3
12
Source: Company, MOSL
January 2013
19

Cement
Recommend basket of BCORP, DBEL, JKCE and OPI
Emulates large cap quality, but available at significant discount
Our view on the Cement sector remains positive. We expect sustained volume recovery,
slowing capacity addition and higher opex/capex cost to result in strong pricing.
Large Cap Cement stocks have seen significant re-rating over the last 12 months and
stock performance hereon should be a function of earnings growth.
However, our Mid Cap Cement Universe is currently trading at very attractive valuations
and returns would be driven by both strong earnings growth and re-rating.
We believe Mid Caps offer base case upside of over 50% and initiate coverage on seven
Mid Cap Cement stocks. Buy BCORP, DBEL, JKCE, JKLC, OPI, MC, and ICEM; Neutral on CENT
and PRSC.
View on sector positive
We believe the worst is behind for the Cement sector and expect gradual improvement
in operating performance. Though the sector will continue to be plagued by over-
capacity, we expect gradual and consistent improvement in capacity utilization, driven
by sustained volume recovery and slowing capacity addition. As a result, we expect
cement prices to increase by ~INR15/bag in FY14 and ~INR12/bag in FY15. This coupled
with cost stabilization, albeit at higher levels, will drive profitability improvement
and capital efficiencies.
Earnings growth to drive the large caps
After the recent outperformance (34% to Sensex in the last 12 months), Large Cap
Cement stocks have got re-rated (33% on EV/ton basis and 20% on EV/EBITDA basis).
They are trading at premium to historical average valuations (~18% premium on EV/
EBITDA) and replacement cost (~20% premium), leaving limited room for further re-
rating. Hereon, we expect strong earnings growth to be the key driver of stock
performance. Among Large Caps, we prefer
UltraTech/Grasim
and
Shree Cements.
Mid caps offers both growth and value
While our Mid Cap Cement Universe has delivered performance similar to Large Cap
Cement stocks, the re-rating in Mid Caps has been much smaller (6% on EV/EBITDA
and 20% on EV/ton). Mid Cap Cement stocks are trading at ~60% discount to Large
Caps on the basis of EV/ton and at ~44% discount on the basis of EV/EBITDA. They are
available at ~52% discount to replacement cost against the long period average of
~25%. We believe cement Mid Caps superior returns would be function of strong
earnings growth and re-ratings.
In FY14, we expect earnings to grow ~52% for our Mid Cap Cement Universe as against
29% for our Large Cap Universe. RoE is likely to improve by ~550bp for our Mid Cap
Cement Universe over FY13-15 v/s ~200bp improvement for the Large Caps. As the
operating performance gap vis-à-vis Large Caps narrows, so will the discount. Further,
any increase in industry consolidation, driven by pick-up in M&A activity will also act
as a re-rating trigger for the Mid Caps.
We initiate coverage on seven Mid Cap Cement stocks -
Century Textiles
(CENT,
Neutral),
Dalmia Bharat
(DBEL, Buy),
JK Cement
(JKCE, Buy),
JK Lakshmi
(JKLC, Buy),
Madras Cements
(MC, Buy),
Orient Paper
(OPI, Buy) and
Prism Cement
(PRSC, Neutral).
We maintain
Buy
on
Birla Corp
(BCORP) and
India Cements
(ICEM).
January 2013
20

Cement
Recommend 'basket' approach to emulate large cap quality at mid cap valuations
Considering the diversity in our Mid Cap Cement Universe, we recommend a 'basket'
approach. Based on our 5-S ratings and valuation scores, we have created a basket of
four stocks - BCORP, DBEL, JKCE and OPI, which mimics Large Caps with respect to size,
diversification and profitability, but at a deep discount to the Large Caps. Our basket
represents total capacity of ~41m tons (based on economic interest), offers market
mix similar to the industry mix, headroom to grow volumes (~70% utilization in FY15)
and ~33% earnings growth. Despite this, it is trading at ~68% discount on EV/ton, ~60%
discount on EV/EBITDA and ~75% on P/B vis-à-vis our Large Cap Universe (based on
FY15 estimates).
Basket offers diversified market mix, ~41m ton capacity and room to grow at ~75% utilization
Capacity (MT)
Capacity utilization (%)
Lower realization and EBITDA (INR/ton) reflected in pricing discount
Source: Company, MOSL
January 2013
21

Cement
EV/Ton (USD)
EV/EBITDA (x)
Source: Company, MOSL
Operating matrix
Capacity (MT)
FY13E
FY14E
FY15E
ACC*
Ambuja*
UltraTech
Shree Cement
Large Caps
Birla Corp
India Cements
Dalmia Bharat
JK Cement
JK Lakshmi
Madras Cements
Orient Paper
Century Textiles
Prism Cement
Mid Caps
Aggregate
30.7
27.5
50.4
15.5
124.0
9.3
15.1
11.8
8.0
5.3
13.6
5.0
10.0
5.6
83.7
207.7
30.7
27.5
60.6
17.5
136.2
9.3
15.1
12.3
8.6
8.0
13.6
5.0
12.8
5.6
90.4
226.6
30.7
27.5
60.6
19.0
137.7
9.3
15.1
15.0
11.6
8.5
13.6
8.0
12.8
5.6
99.6
237.3
Volumes (MT)
FY13E
FY14E
FY15E
24.2
22.5
43.2
13.6
103.4
6.5
10.5
5.7
6.4
5.4
8.5
4.2
8.0
5.1
60.3
163.7
26.6
24.7
47.1
14.6
113.0
7.0
11.6
6.3
7.2
5.9
9.4
4.6
8.8
5.8
66.6
179.6
29.3
26.7
50.4
15.8
122.2
7.7
12.8
7.1
8.1
6.8
10.3
5.2
9.9
6.4
74.3
196.5
EBITDA (INR/Ton)
FY13E
FY14E
FY15E
841
1,121
1,088
1,173
1,048
607
888
1,141
914
804
1,251
759
516
447
833
969
900
1,146
1,310
1,339
1,181
742
1,001
1,241
1,134
957
1,360
908
654
747
983
1,108
972
1,218
1,368
1,449
1,251
875
1,070
1,325
1,395
1,046
1,461
1,007
734
853
1,094
1,191
EBITDA (%)
FY13E
FY14E
FY15E
19.0
25.5
22.1
28.7
23.0
15.3
20.6
24.7
19.2
20.4
28.7
8.6
8.7
6.3
17.8
21.1
19.3
24.8
24.8
29.8
24.1
17.4
22.1
25.5
21.5
22.6
29.3
12.4
9.9
10.6
19.6
22.5
19.8
25.0
24.3
30.0
24.1
19.6
22.6
26.0
22.7
23.4
29.8
13.7
11.2
11.4
20.6
22.8
Financial matrix
EPS (INR)
FY13E
FY14E
ACC*
Ambuja*
UltraTech
Shree Cement
Large Caps
Birla Corp
India Cements
Dalmia Bharat
JK Cement
JK Lakshmi
Madras Cements
Orient Paper
Century Textiles
Prism Cement
Mid Caps
Aggregate
January 2013
66.0
10.6
100.6
306.6
34.7
7.7
27.9
30.6
15.9
19.7
6.0
-10.6
-0.1
80.4
12.2
129.2
375.6
43.3
12.6
36.1
42.8
20.3
25.6
10.6
-5.9
4.2
FY15E
98.2
14.4
147.7
461.1
58.8
18.1
38.1
60.3
25.1
33.1
12.7
4.6
6.5
RoE (%)
FY13E
FY14E
16.8
19.3
19.6
34.1
20.8
10.9
5.1
8.5
13.3
15.0
20.8
10.7
-1.7
-0.3
11.2
17.7
19.0
20.1
21.1
33.1
22.5
12.3
7.8
10.1
16.5
16.7
22.4
17.1
-0.8
17.6
15.3
20.3
FY15E
20.8
21.1
20.2
30.9
22.9
14.7
10.8
10.0
19.4
17.9
23.5
17.9
0.5
23.5
17.9
21.3
RoCE (%)
FY13E
FY14E
18.0
28.7
23.2
27.8
23.7
11.9
8.5
11.1
16.1
15.6
18.2
12.6
-5.4
7.3
10.3
18.8
20.6
29.1
26.0
25.3
25.3
13.7
10.3
11.5
17.2
17.1
21.0
18.3
-3.2
19.3
13.2
20.8
FY15E
23.0
30.4
25.9
27.8
26.4
16.2
12.7
11.9
19.1
18.5
24.8
17.4
2.6
23.6
15.8
22.4
Net Debt:Equity (x)
FY13E
FY14E
FY15E
-0.4
-0.4
0.1
-0.5
-0.2
-0.1
0.7
0.7
0.9
0.5
1.0
0.5
2.9
1.2
1.0
0.2
-0.4
-0.4
0.1
-0.5
-0.2
-0.2
0.6
0.8
1.3
0.7
0.6
0.7
3.6
1.0
1.1
0.2
-0.5
-0.4
-0.1
-0.7
-0.3
-0.3
0.4
0.6
1.1
0.5
0.2
1.0
3.8
0.8
0.9
0.2
22

Cement
Valuations summary
Reco
CMP
TP
(INR) FY15
(INR)
1,387 1,712
198 233
1,920 2,351
4,517 6,157
319
88
193
337
141
233
79
427
49
Up-
PE
EV/EBITDA
EV/Ton (USD)
EV/ Blue-
side
(x)
(x)*
at CMP*
Ton Sky
(%) FY13E FY14E FY15E FY13E FY14E FY15E FY13E FY14E FY15E at TP
TP
23.4
17.9
22.4
36.3
21.0 17.3
18.7 16.3
19.1 14.9
14.7 12.0
18.6 15.1
9.2
7.4
11.5
7.0
6.9
5.3
11.0
7.9
8.9
7.0
11.8
9.1
13.1
7.5
-40.4 -72.1
-724.4 11.7
11.9
7.9
17.3 13.4
14.1
13.7
13.0
9.8
12.9
5.4
4.9
5.1
5.6
5.6
7.0
6.2
93.0
7.5
6.0
11.1
11.1
10.5
10.6
7.8
10.1
5.2
5.8
5.4
5.1
4.0
6.8
8.4
15.6
12.1
6.2
8.9
8.9
9.0
8.3
6.3
8.2
3.6
4.5
4.3
4.5
4.3
5.3
4.3
14.5
5.9
4.7
7.1
6.9
7.3
7.3
4.7
6.8
2.3
3.5
4.0
4.4
3.2
3.9
5.7
11.0
4.6
3.9
5.9
135.2
176.3
180.3
143.5
164.3
40.4
66.1
54.8
69.4
59.6
105.6
52.1
74.3
99.9
73.1
130.3
128.0
169.4
154.9
122.9
148.3
36.3
63.5
49.5
76.7
55.7
98.1
28.7
78.6
77.0
68.9
119.5
116.5 153
158.6 195
152.1 188
97.9 153
140.1
30.8
53 667
57.7
69 217
45.9
69 669
76.4
90 710
49.3
77 339
84.4 130 476
43.2
60 254
71.0 147 1,028
64.3
79 101
63.8
110.6
Source: Company,
Up-
side
(%)
ACC*
Neutral
Ambuja*
Buy
UltraTech
Buy
Shree Cement
Buy
Large Caps
Birla Corp
Buy
India Cements
Buy
Dalmia Bharat
Buy
JK Cement
Buy
JK Lakshmi
Buy
Madras Cements
Buy
Orient Paper
Buy
Century Textiles
Neutral
Prism Cement
Neutral
Mid Caps
Aggregate
*EV adjusted for CWIP
464 45.7
119 35.5
427 122.4
554 64.4
249 76.5
374 60.9
114 44.7
460
7.9
57 18.1
109
146
246
111
140
105
221
140
109
MOSL
January 2013
23

Cement
Companies
Companies covered
Initiating Coverage
Century Textiles
Dalmia Bharat
JK Cement
JK Lakshmi Cement
Madras Cements
Orient Paper Inds
Prism Cement
Pg
30
43
62
76
88
100
113
Existing Coverage
Birla Corporation
India Cements
25
57
January 2013
24

Update | Sector: Cement
Birla Corporation
BSE SENSEX
S&P CNX
19,987
6,057
CMP: INR319
Cost efficient player
TP: INR464
Buy
5-S framework
5-S score, Rank
67
Valuation score, Rank 94
4
2
Possible resolution of mining ban, a key trigger; Buy
Target price & upside
Base case
Blue Sky
INR464
INR667
46%
109%
Stock Info
Bloomberg
Equity Shares (m)
52-Week Range (INR)
1,6,12 Rel. Perf. (%)
M.Cap. (INR b) / (USD b)
BCORP IN
77.0
342/202
13/28/-7
25/0.4
Birla Corp (BCORP) is one of the most cost efficient cement producers, with average
cost of production being consistently 8-10% lower than the MOSL Cement Universe.
We expect strong scale-up in BCORP's volumes over FY12-15 on the back of stabilization
of recently added capacities and favorable market mix.
The ban on limestone mining at its Rajasthan plant has impacted its volumes and cost
adversely. Resolution of the mining ban would be a key trigger.
Strong balance sheet renders flexibility to expansion as both expansion plans marred
by litigation. We value BCORP at INR464/share (4x FY15E EV/EBITDA with implied EV/
ton of USD52). Maintain Buy; our target price implies 46% upside.
Capacity addition, favorable market mix to aid volume growth
Valuation summary (INR b)
Y/E March
2013E 2014E 2015E
Sales
25.7 29.7 34.3
EBITDA
3.9
5.2
6.7
NP
2.7
3.3
4.5
Adj. EPS (INR) 34.7 43.3 58.8
EPS Gr. (%)
11.7 24.8 35.8
BV/Sh. (INR) 317.2 351.1 399.4
RoE (%)
10.9 12.3 14.7
RoCE (%)
11.9 13.7 16.2
Payout (%)
25.3 21.6 17.9
Valuations
P/E (x)
9.2
7.4
5.4
P/BV (x)
1.0
0.9
0.8
EV/EBITDA (x) 5.2
3.6
2.3
EV/Ton (x)
40.4 36.3 30.8
BCORP has posted subdued dispatch growth (CAGR of 2.7%) over FY10-12 due to
capacity constraints. However, we expect strong scale-up in volumes over FY13-
15 (8.7% CAGR), despite mining ban on the back of stabilization of recently added
capacities (1.7mtpa in Satna, 1.2mtpa in Chanderia and 0.6mtpa in Durgapur in
3QFY12) and favorable market mix. BCORP's sales mix is concentrated in North,
Central and East India, where demand-supply outlook remains healthy. We
expect favorable market mix to drive ~9.5% CAGR in average realization over
FY13-15 (INR29/15/10 per bag increase in FY13/14/15).
Cost efficient player; resolution of mining ban key trigger
BCORP is highly cost efficient cement producers, with average cost of production
being consistently 8-10% lower than the MOSL average. The cost advantage is
attributable to high dependence on linkage coal (~65%), superior fuel efficiency
and low cost power generation (captive power accounts for 66% of requirement).
The recently imposed ban on limestone mining at its Rajasthan plant has impacted
its volumes and cost adversely. Resolution of the mining ban would be critical
for future volume growth and normalization of profitability. While BCORP is also
in the process of setting up two CPPs at Chanderia (50MW) and Satna (35MW),
we are yet to account for any benefit due to lack of visibility on the timeline. We
expect EBITDA/ton to improve to INR1,019 in FY15 from INR660 in FY12 (16%
CAGR).
Shareholding pattern (%)
As on
Sep-12
Promoter
62.9
Dom. Inst 15.5
Foreign
4.9
Others
16.7
Jun-12 Sep-11
62.9
62.9
15.1
14.2
6.1
7.0
16.0
15.9
Stock performance (1 year)
Strong balance sheet, FCF generation to support growth
BCORP's both the expansion plans are marred by litigation. However its healthy
cash surplus of ~INR5.1b as of FY14E, coupled with strong FCF visibility of ~INR9.2b
over FY13-15 offers healthy growth potential here on. We model in for likely
expansion in capital efficiencies(RoCE/RoE by 4.3/3.8pp) on the back of
deployment of surplus cash.
Trading at steep discount; reiterate Buy
BCORP trades at FY15E EV of USD32/ton (v/s USD64/ton for MOSL Mid Cap Cement
Universe and USD111/ton for MOSL Cement Universe) and 2.4x FY15E EBITDA (v/
January 2013
25

Birla Corporation
3.9x FY15E EBITDA for MOSL Mid Cap Cement Universe and 5.9x FY15E EBITDA for
MOSL Cement Universe). We expect revenue/EBITDA/PAT CAGR of 16%/30%/31%
over FY13-15. We value BCORP at INR464/share (4x FY15E EV/EBITDA with implied
EV/ton of USD52). Maintain
Buy;
our target price implies 46% upside.
About Birla Corp
Birla Corp (BCORP) is a part of the MP Birla group. It has cement capacity of 9.3mtpa
across plants located in Rajasthan, Madhya Pradesh, Uttar Pradesh and West Bengal.
BCORP's ownership is sub-judice, as the will of Late Mrs Priyamvada Birla bequeathing
all M.P.Biral group property to Late Mr Rajendra Lodha is being contested by Birla
family.
Strong balance sheet, steady volume growth, cost leadership and attractive valuations
position BCORP as one of our preferred bets in the mid cap universe.
Blue Sky Scenario
Birla Corp
Birla Corp has the potential to double in two years, driven by:
Resolution of the mining ban at its Rajasthan plant, resulting in cost savings of
~INR1b or ~INR150/ton.
Further, the resolution of the mining ban would drive brownfield capacity
addition of ~1.5mtpa.
Captive coal block, with recoverable reserves of 9.4mt has the potential to drive
savings of ~INR720m per year.
Improvement in capital efficiency by ~200bp, led by savings in raw material cost.
Any resolution of the dispute of ownership of the MP Birla group between the
Lodha and Birla families would led to further re-rating, though this is not factored
in our blue sky scenario.
BCORP: Blue Sky Scenario (INR m)
FY15E Catalyst
8,439 Savings of ~INR1b p.a on resolution of mining ban & savings
of ~INR720m from captive coal block
EV/EBITDA Multiple (x)
5 Re-rating with valuations in-line with similar sized
companies
EV
42,196
Net Debt
-9,147
Equity value
51,343
TP (INR)
667
Upside (%)
109
EBITDA
BCORP: 5-S Analysis
5-S Score
1. Size & scalability [30]
2. Sales Mix [20]
3. Supply chain efficiencies [20]
4. Strategic & Other issues [10]
5. Strength of financials [20]
5-S Score
Valuation Score
18
16
14
7
12
67
94
Rank
7
3
1
6
3
4
2
Average
21
15
11
7
11
65
76
January 2013
26

Birla Corporation
5-S Analysis [Score 67 / 100] & [Rank 4]
Size & Scalability [18 / 30]
Has cement capacity of 9.3mtpa across plants located
in Rajasthan, Madhya Pradesh, Uttar Pradesh and
West Bengal.
Expect strong scale-up in volumes over FY12-15
(8.7% CAGR) on the back of stabilization of recently
added capacities (1.7mtpa in Satna, 1.2mtpa in
Chanderia and 0.6mtpa in Durgapur in 3QFY12) and
favorable market mix.
No major capacity addition in foreseable future, as
both planned expnasion at Rajasthan & MP are
impacted by litigation.
Strategic & Other Issues [7 / 10]
ownership is sub-judice, as the will of Late
Mrs Priyamvada Birla bequeathing all M.P.Biral
group property to Late Mr Rajendra Lodha is being
contested by Birla family.
BCORP is largely a pure cement player, with
insignificant contribution from Jute and other
business to its revenue and profit.
With regards to mining ban, High court has levied a
compensation of INR45m. Currently, the matter is
subjudice and resolution would be critical.

BCORP's
Sales Mix [16 / 20]
Sales mix concentrated in North, Central and East
India, where demand-supply outlook remains
healthy.
Expect favorable market mix to drive ~9.5% CAGR in
average realization over FY12-15 (INR29/15/10 per
bag increase respectively).
While its expansion at MP and Rajasthan are
impacted by litigation, as and when it is cleared, it
will strengthen presence in NEC market.
Strength of Financials [12 / 20]
Expect EBITDA/ton to improve to INR976 in FY15 from
INR660/780 in FY12/13E (12% CAGR).
Expect revenue/EBITDA/PAT CAGR of 16%/31%/30%
over FY13-15.
No major capacity addition in foreseable future, as
both planned expnasion at Rajasthan & MP are
impacted by litigation.
Net cash of ~INR5.1b as on FY14E and strong
operating cash flow visibility (INR15.7b over FY13-
15) to address capex.
Improvement in operating cycle to augment RoCE
and RoE by 4.3pp and 3.8pp, respectively.
Supply Chain Efficiencies [14 / 20]
One of the most cost efficient cement producers,
with average cost of production being consistently
8-10% lower than the MOSL average.
Cost advantage attributable to high dependence on
linkage coal (~65%), superior fuel efficiency and low
cost power generation (captive power accounts for
66% of requirement).
Ban on limestone mining at its Rajasthan plant has
impacted its volumes and cost adversely (~INR1b of
overall cost impact).
While BCORP is also in the process of setting up two
CPPs at Chanderia (50MW) and Satna (35MW), we
are yet to account for any benefit due to lack of
visibility on the timeline.
January 2013
Valuation & View [94 / 100]
BCORP trades at an FY15E EV of USD32/ton (v/s
USD64/ton for MOSL Mid Cap Cement Universe and
USD111/ton for overall Cement Universe) and 2.3x
FY15E EBITDA (v/s 3.9x FY15E EBITDA for MOSL Mid
Cap Cement Universe and 5.9x FY15E EBITDA for
overall Cement Universe).
We value BCORP at INR464/share (4x FY15E EV/
EBITDA with implied EV/ton of USD52). Maintain
Buy;
our target price implies 46% upside.
Our Blue Sky scenario analysis indicates that BCORP
has potential to double in 2 years time, with target
price of INR667.
27

Birla Corporation
Financials and Valuation
Income Statement
Y/E March
Net Sales
Change (%)
Total Expenditure
EBITDA
Change (%)
Margin (%)
Depreciation
EBIT
Int. and Finance Charges
Other Income - Rec.
PBT
Change (%)
Tax
Tax Rate (%)
PAT
Change (%)
Margin (%)
2010
21,570
20.5
14,519
7,051
65.6
32.7
556
6,495
270
1,383
7,608
74.3
2,036
26.8
5,572
72.2
25.8
2011
21,238
-1.5
17,059
4,179
-40.7
19.7
648
3,530
526
1,372
4,376
-42.5
1,177
26.9
3,199
-42.6
15.1
2012
22,469
5.8
19,345
3,124
-25.2
13.9
800
2,324
525
1,662
3,461
-20.9
1,068
30.9
2,392
-25.2
10.6
2013E
25,660
14.2
21,733
3,927
25.7
15.3
1,098
2,829
899
1,620
3,549
2.6
878
24.8
2,671
11.7
10.4
(INR Million)
2014E
29,747
15.9
24,566
5,182
32.0
17.4
1,269
3,913
899
1,551
4,564
28.6
1,232
27.0
3,332
24.8
11.2
2015E
34,305
15.3
27,586
6,719
29.7
19.6
1,343
5,376
899
1,722
6,198
35.8
1,674
27.0
4,525
35.8
13.2
Balance Sheet
Y/E March
Equity Share Capital
Reserves
Net Worth
Loans
Deferred Liabilities
Capital Employed
Gross Block
Less: Accum. Deprn.
Net Fixed Assets
Capital WIP
Investments
Curr. Assets
Inventory
Account Receivables
Cash and Bank Balance
Others
Curr. Liability & Prov.
Account Payables
Provisions
Net Current Assets
Appl. of Funds
E: MOSL Estimates
2010
770
17,142
17,912
7,092
795
25,799
14300
7313
6,987
3278
11417
8,418
2837
221
3393
1966
4,299
3,650
649
4,118
25,799
2011
770
19,809
20,579
10,158
1125
31,862
17513
7759
9,754
4889
11692
10,559
3596
443
3711
2810
5,032
4,507
526
5,527
31,862
2012
770
21,664
22,434
11,243
1533
35,210
21968
8486
13,482
5139
10448
11,526
4171
372
4386
2597
5,386
4,744
642
6,140
35,210
2013E
770
23,659
24,429
11,243
1595
37,267
29107
9584
19,523
1000
3000
20,012
4875
513
11288
3336
6,268
5,389
880
13,743
37,267
2014E
770
26,270
27,040
11,243
1686
39,969
30607
10853
19,754
1000
3000
23,468
5652
595
13354
3867
(INR Million)
2015E
770
29,984
30,754
11,243
1810
43,807
32607
12196
20,411
1000
3000
27,798
6518
686
16135
4460
8,402
7,204
1,198
19,396
43,807
7,253
6,247
1,006
16,215
39,969
January 2013
28

Birla Corporation
Financials and Valuation
Ratios
Y/E March
Basic (INR) *
EPS
Cash EPS
BV/Share
DPS
Payout (%)
Valuation (x)
P/E
Cash P/E
P/BV
EV/Sales
EV/EBITDA
EV/Ton - Cap (US$)
Dividend Yield (%)
Return Ratios (%)
RoE
RoCE
Working Capital Ratios
Inventory (Days)
Debtor (Days)
Working Capital Turnover (Days)
Leverage Ratio
Current ratio
Debt/Equity (x)
2010
72.4
79.6
232.6
6.0
9.7
2011
41.5
50.0
267.2
6.0
16.9
2012
31.1
41.5
291.3
6.0
22.6
2013E
34.7
48.9
317.2
7.5
25.3
2014E
43.3
59.7
351.1
8.0
21.6
2015E
58.8
76.2
399.4
9.0
17.9
10.3
7.7
1.1
0.7
5.1
37
1.9
9.2
6.5
1.0
0.8
5.2
40
2.4
7.4
5.3
0.9
0.6
3.6
36
2.5
5.4
4.2
0.8
0.5
2.3
31
2.8
31.1
30.5
15.5
15.4
10.7
11.3
10.9
11.9
12.3
13.7
14.7
16.2
48
4
0.8
62
8
0.7
68
6
0.6
69
7
0.7
69
7
0.7
69
7
0.8
2.0
0.4
2.1
0.5
2.1
0.5
3.2
0.5
3.2
0.4
3.3
0.4
Cash Flow Statement
Y/E March
Op.Profit/(Loss) before Tax
Interest/Dividends Recd.
Direct Taxes Paid
(Inc)/Dec in WC
CF from Operations
(inc)/dec in FA
(Pur)/Sale of Investments
CF from Investments
(Inc)/Dec in Debt
Interest Paid
Dividend Paid
CF from Fin. Activity
Inc/Dec of Cash
Add: Beginning Balance
Closing Balance
2010
7,301
567
-1,913
-894
5,060
-2,795
-5,555
-8,350
4,368
-252
-631
3,485
196
3,197
3,393
2011
4,456
719
-1,089
-687
3,398
-4,927
-152
-5,079
3,104
-566
-539
1,999
318
3,393
3,711
2012
3,124
1,662
-1,068
62
3,779
-4,778
1,244
-3,534
1,085
-525
-541
23
268
3,711
4,385
2013E
3,927
1,620
-816
-702
4,029
-3,000
7,448
4,448
0
-899
-676
-1,575
6,902
4,386
11,288
(INR Million)
2014E
5,182
1,551
-1,141
-405
5,187
-1,500
0
-1,500
0
-899
-721
-1,620
2,066
11,288
13,354
2015E
6,719
1,722
-1,550
-400
6,491
-2,000
0
-2,000
0
-899
-811
-1,710
2,781
13,354
16,135
January 2013
29

Initiating Coverage | Sector: Cement
Century Textiles
BSE SENSEX
S&P CNX
19,987
6,057
CMP: INR427
TP: INR460
Neutral
5-S framework
5-S score, Rank
63
Valuation score, Rank 42
7
9
Cement poised for growth, performance improvement
Delay in land value unlocking, high leverage to remain near-term drags
Target price & upside
Base case
Blue Sky
INR460
INR 1,028
8%
140%
Stock Info
Bloomberg
Equity Shares (m)
52-Week Range (INR)
1,6,12 Rel. Perf. (%)
CENT IN
93.0
470/238
1-1/24/51
Century Textiles (CENT) is likely to witness 11% CAGR in cement volumes over FY13-15,
driven by 4.3mtpa expansion in Maharashtra and West Bengal by mid-FY14.
Cost savings from upcoming CPP and new capacity with better operating efficiency will
enhance operating margins of the cement business.
However, acute margin pressure in non-cement segments, high leverage (net debt of
INR62.5b in FY15E) and delay in real estate value unlocking would limit upside potential.
We initiate coverage with a Neutral rating; our target price of INR460 implies 8%
upside.
M.Cap. (INR b) / (USD b) 40/0.7
Real estate value unlocking potential significant, but back-ended
CENT has 40 acres of mill land in Worli, one of Mumbai’s most attractive real
estate micro-markets. Recent transactions/PE deals in Central Mumbai have
materialized at a valuation of INR1.6b-1.8b/acre. We value CENT’s mill land with
~5msf of leasable area at ~INR26b (FY15E NAV). Our valuation implies land value
of ~INR1.2b/acre, 25-30% discount to the recent deals. We believe that the implied
discount is attributable to (a) back-ended land monetization plan under
commercial leasing model, and (b) prevailing challenges in the Central Mumbai
commercial real estate market due to weak demand, threat of oversupply and
high vacancy.
Valuation summary (INR b)
Y/E March
2013E 2014E 2015E
Sales
58.0 68.9 80.6
EBITDA
5.0
6.8
9.0
NP
-1.0
-0.6
0.4
Adj EPS (INR) -10.6
-6.3
3.8
EPS Gr. (%) -544.9 -40.9 -160.8
BV/Sh. (INR) 188.3 176.7 175.3
RoE (%)
-5.4
-3.4
2.2
RoCE (%)
3.2
4.5
6.4
Payout (%)
-49.8 -84.2 138.5
Valuations
P/E (x)
-40.4 -68.4 112.5
P/BV (x)
2.3
2.4
2.4
EV/EBITDA (x) 15.6 14.4 11.0
EV/Ton (USD)
79
78
73
Capacity additions, cost saving triggers to improve cement profitability
After stagnancy in capacity growth over FY08-12, we expect CENT’s 4.3mtpa
expansion in Maharashtra and West Bengal by mid-FY14 to aid meaningful volume
growth visibility (estimate 11% CAGR over FY13-15 v/s flat volume over FY10-12).
Demand outlook is strong due to fundamentally sound market mix (West, Central
and East India). Historically, CENT has posted lower cement profitability (EBITDA/
ton of INR456/516 v/s average INR894/1,010 for MOSL Cement Universe in FY12/
13E) owing to lower realizations, high freight cost and vintage plants. Going ahead,
we believe cost savings from upcoming CPP (would meet 80% requirement) and
new cement plants with better operating efficiency will enhance operating
margins, though it will be difficult to completely bridge the gap with peers. We
expect 19% CAGR in cement EBITDA/ton over FY13-15 to INR734.
Shareholding pattern (%)
As on
Sep-12
Promoter
40.4
Dom. Inst 17.1
Foreign
10.4
Others
32.2
Jun-12 Sep-11
40.4
40.4
17.4
18.2
8.8
6.9
33.5
34.6
Non-cement segments, high leverage to remain near-term drags
Stock performance (1 year)
Revival in textiles (revenue/EBITDA contribution of 26%/4%) and paper (revenue/
EBITDA contribution of 17%/15%) hinges on demand recovery, softening of input
costs (e.g. cotton) and its ability to tackle competitive pressure. We expect both
the segments to continue with weak margins and subdued RoCE. Its spiraling
debt (net debt of INR62.5b in FY15E) and high interest on the back of ongoing
capex stoke further concerns.
January 2013
30

Century Textiles
Near-term upside potential limited; initiate with Neutral
While the cement business is poised for steady improvement, acute margin
pressure in non-cement segments, high leverage (FY15E net debt-equity of 4.9x)
and delay in real estate value unlocking would limit upside potential. CENT trades
at 11.1x FY15E EBITDA. For the cement business, this implies FY15E EV of USD72/ton
v/s USD64/ton for MOSL Mid Cap Cement Universe and USD111/ton for overall
Cement Universe. Our SOTP-based valuation is INR460/share: (1) cement (USD75/
ton), (2) paper (1x FY15E sales), (3) textiles (0.4x FY15E sales), and (4) land (FY15E
NAV). We initiate coverage with a
Neutral
rating; our target price implies 8% upside.
About Century Textiles
Century Textiles (CENT), BK Birla group’s flagship, is a diversified company with presence
in cement, textiles, paper & pulp, and chemicals.
It has 8.5mtpa of cement capacity (to be expanded to 12.8mtpa by FY14) and has the
largest market share in Central India.
Given the near-term challenges in the textiles and paper businesses, the robust outlook
on cement and significant value unlocking potential in real estate will be the key drivers.
Blue Sky Scenario
Century Textiles
Century Textiles has potential the potential to multiply 2.5x, driven by Mr Kumar
Mangalam Birla, the Chairman of the Aditya Birla Group, inheriting his grandfather,
Mr BK Birla's interests in Century Textiles. Though a timeline cannot be assigned,
such an event could lead to the following:
Consolidation of Century Textiles' cement business with UltraTech.
Hive-off of the paper business, as it would be non-core for the Aditya Birla Group.
Sale of land bank, rather than own development, resulting in faster monetization.
CENT: Blue Sky Scenario (INR m)
Textile
Cement
Paper
Parameter
Multiple
EV/Sales
0.4
EV/ton(US$)
120
EV/Sales
2
FY15E
8,937
84,480
28,653
Remarks
No change in business fundamentals
Merger of cement assets with A.V,Birla Group
Paper business sale as part of restructuring
on inheritance by A.V.Birla Group
Others
EV/Sales
0.5
696
Total EV
122,766
Less: Net Debt
60,150
Add: Value of Land @ INR1.5/acre
33,000
Market Cap
Fair Value (INR)
Upside (%)
95,616
1,028
140
Freehold land sale rather than own devel-
opment on inheritance by A.V.Birla Group
CENT: 5-S Analysis
5-S Score
1. Size & scalability [30]
2. Sales Mix [20]
3. Supply chain efficiencies [20]
4. Strategic & Other issues [10]
5. Strength of financials [20]
5S Score
Valuation Score
January 2013
22
18
11
5
7
63
42
Rank
5
1
4
7
9
7
9
Average
21
15
11
7
11
65
76
31

Century Textiles
5-S Analysis [Score 63 / 100] & [Rank 7]
Size & Scalability [22 / 30]
Existing cement capacity of 8.5mt with no major
expansion over FY08-12.
Posted muted volume growth (1% CAGR) over FY09-
12 at high utilization (95-99%).
Ongoing greenfield expansion of 1.5mt in West
Bengal (INR5.2b by March 2013) and 2.8mt fo
brownfield expansion in Maharashtra (INR16b
including 60MW power plant by September 2013)
would be the key drivers of volume growth
(estimate 11% CAGR) over FY13-15E.
Strategic & Other Issues [5 / 10]
CENT's 40-acre mill land in Worli offers significant
value unlocking potential. However, given delayed
monetization and subdued commercial demand, we
value the land at 25-30% discount to recent
transactions at INR26b (INR281/share).
Textile (revenue/EBITDA contribution of 26%/4%)
and paper (17%/15%) businesses remain near-term
drags on margins and capital efficiency.
Sales Mix [18 / 20]
Fundamentally sound market mix, with ~49% of
dispatches to Central India, while East and West
India account for 27% and 24% of dispatches,
respectively.
CENT commands 10-11% market share in Central
India and 4-5% each in East and West India.
The trade segment contributes ~90% of CENT's
cement sales (v/s industry average of 65%), resulting
in lower pricing volatility.
We model INR15/15/10 per bag increase in
realizations over FY13/FY14/15.
Strength of Financials [7 / 20]
Profitability significantly lower than peers in cement
(FY12/13E EBITDA/ton at INR456/516 - 45-50%
discount to MOSL Cement Universe).
Expect 19% CAGR in EBITDA/ton over FY13-15 to
INR734, though it would be difficult to completely
bridge the gap with peers.
Expect revenue/EBITDA CAGR of 18%/34% over FY13-
15. High interest cost (1.25-1.6x EBIT) to dent FY13-
14 PAT.
Net debt to peak out in FY15. We estimate net debt
of ~INR52.5b (net debt-equity of 4.9x) in FY15 on
the back of INR28b capex over FY13-15E in cement
and commercial construction.
Supply Chain Efficiencies [11 / 20]
Valuation & View [42 / 100]
ENT trades at 11.1x FY15E EBITDA. For the cement
business, this implies Fy15E EV of USD72/ton
v/s USD64/ton for MOSL Mid Cap Cement Universe
and USD111/ton for overall Cement Universe.
Our SOTP-based valuation is INR460/share: (1)
cement (USD75/ton), (2) paper (1x FY15E sales), (3)
textiles (0.4x FY15E sales), and (4) land (FY15E NAV).
We initiate coverage with a
Neutral
rating; our target
price implies 8% upside.
Our Blue Sky scenario analysis suggets that CENT
has potential to be 2.5x, driven by inheritance of
Century textile by A.V.Birla group, although timeline
can't be assigned.
Cost of production at par with MOSL Cement
Universe. High proportion (~60%) of coal linkages
and high blending (1.43x) enable energy cost
advantage.
Freight cost to remain high due to high lead (450-
500km) distance - 50% sold outside home markets.
Vintage cement plants (average age of 24 years) have
lower operating efficiencies. New plants with
various subsidies to aid cost savings.
Upcoming CPP to enable 80% self sufficiency at
extended capacity (v/s 75% currently).
Expect cost of cement production per ton to grow at
a moderate 5% CAGR over FY13-15E.
January 2013
32

Century Textiles
Size & Scalability: Ongoing expansion to aid healthy recovery
Volume growth drivers in place for cement business
CENT has cement capacity of 8.5mtpa, including (1) 2.1mtpa in Chhattisgarh, (2) 1.9mtpa
in Maharashtra, and (3) 3.8mtpa in Madhya Pradesh plus recent upgradation of
0.8mtpa. It has not had any major expansions since FY08 and has posted muted volume
growth (1% CAGR) over FY09-12. Capacity utilization has improved to 95-99%. The
ongoing greenfield expansion of 1.5mtpa in West Bengal (capex INR5.2b; by March
2013) and 2.8mtpa split grinding capacity in Maharashtra (capex of INR16b including
60MW power plant by September 2013) would be the key driver of volume growth
(estimate 11% CAGR over FY13-15).
Expect ongoing expansion to revive volume growth hereon
Source: Company, MOSL
Sales Mix: Market mix favorable
Favorable market mix aids resilience in cement demand
CENT has a fundamentally sound market mix (West, Central and East India), where we
foresee healthy demand-supply dynamics. Almost 49% of its dispatches cater to Central
India, while East and West India account for 27% and 24%, respectively. It commands
10-11% market share in Central India and 4-5% each in East and West India. The trade
segment contributes ~90% of CENT’s cement sales (v/s industry average of 65%),
rendering relatively low pricing volatility. CENT’s blended cement realization has
been historically lower than peers (5-10% lbelow MOSL Cement Universe average)
due to relatively weaker brand equity. We model INR15/15/10 per bag YoY increase in
realizations over FY13/14/15.
Market mix skewed towards better performing states
Historically, realizations have been lower than peers (INR/ton)
Source: Company, MOSL
January 2013
33

Century Textiles
Supply Chain Efficiencies: Vintage plant, high lead distance remain overhangs
High freight cost to
remain an overhang as
~50% of its production is
sold outside home
markets
Cost of production at par with MOSL Cement Universe average
CENT’s cost of cement production in FY12 was INR2,999/ton against INR2,959/ton for
our Cement Universe. In FY12, CENT’s total cost/ton had increased by 17.3%, led by
sharp rise in energy cost (24% owing to price escalation) and ~22% hike in rail freight
(freight mix is skewed towards railways: 68%).
High dependence on linkage coal; vintage plant, high lead distance key overhangs
Coal linkages account for 60% of CENT’s fuel mix, while domestic open market
purchases account for the balance 40%. While the high proportion of linkage coal
gives CENT a cost advantage, currently, shrinking of coal linkage to result in increasing
energy cost pressure. Its high blending at 1.43x clinker (~95% blended cement) has
led to better than average power consumption (~78KWH/ton of cement v/s 77-90KWH/
ton for peers).
However, we expect freight cost to remain an overhang, as ~50% of its production is
sold outside home markets, resulting in higher lead distance (450-500km). Moreover,
the average age of CENT’s cement plants is 24 years; these vintage plants have
comparatively lower operating efficiencies.
Vintage plants: Average age 28years
Century Cement (Chattisgarh)
Maihar Cement (MP) -I
Manikgarh Cement (Maharashtra)
Maihar Cement (MP) -II
Total
Established
1974
1980
1985
1996
Capacity (mt)
2.1
1.8
1.9
2.0
7.8
Age (years)
38
32
27
16
28
Source: Company, MOSL
Upcoming CPP in
Maharashtra would make
it ~80% self sufficiency in
power
Additional CPP, new plants to aid cost savings
Currently, CENT’s 75MW captive power plant (CPP) fulfills 70-75% of its power
requirement; it purchases the balance requirement from the grid. The average cost
of power generation through the CPP is INR4.2/unit as compared to INR6.1/unit for
grid purchases and INR15-16/unit for DG-set produced power. CENT is setting up a
60MW power plant at Manikgarh (Maharashtra) by September 2013, which would
take total CPP capacity to 115MW. On its expanded capacity of 12.8mtpa, the CPP
would be able to supply almost 80% of its requirement. This would help reduce power
cost. Besides, its upcoming cement capacities in Maharashtra and West Bengal would
reduce the average age of its plants. The new plants would also be eligible for various
incentives such as capital/VAT/electricity/CST subsidies.
Expect cost pressure to moderate over FY12-15
On the back of moderation in energy cost escalation and higher efficiencies aided by
new plants, we expect CENT’s cost of cement production to grow at a moderate 5%
CAGR over FY13-15E. However, shrinking cosl linkage would result in rise in energy
cost.
January 2013
34

Century Textiles
CPP addresses significant energy requirement (%)
Total cost/ton to witness 5% CAGR over FY13-15
Source: Company, MOSL
Strategic & Other Issues: Value unlocking from real estate a key trigger
Worli land offers huge value unlocking opportunity...
CENT has 40 acres of mill land in Worli, which is one of Mumbai’s most attractive real
estate micro-markets. Recent transactions/PE deals in Central Mumbai have
materialized at a valuation of INR1.6b-1.8b/acre, which indicates significant value
unlocking potential. However, CENT plans to monetize the land only under
commercial leasing so that it provides steady rental income to overcome the cyclicality
of other businesses.
Location of CENT’s mill land at Worli
Source: Company, MOSL
January 2013
35

Century Textiles
Value of Central Mumbai land transactions has been spiraling since FY05
Source: Industry, MOSL
... but litigation overhangs limits developable potential
Of the total 40 acres, CENT owns ~22 acres, while 10 acres is on lease from the Wadia family
and 8 acres is occupied by the housing colony. The lease is for 999 years (~113 years
lapsed), renewable for another 999 years. However, the leasehold portion is currently
under litigation with the Wadia family and lacks monetization certainty. While the company
is yet to freeze on a development plan (potential area, product mix, scheme of
development, etc) for the balance land , it plans to undertake commercial development
under lease model. We assume ~5msf of potential developable area considering 2.66x
FSI (net of workers’ rehab and disputed area) under IT Park scheme.
Due to back ended
development plan, we
value Worli land at
almost 25-30% discount
to recent transactions
Valuing Worli mill land at ~INR26b (INR281/share)
We value CENT’s mill land with ~5msf of leasable area at ~INR26b (FY15E NAV). Our
valuation implies land value of ~INR1.2b/acre, 25-30% discount to the recent deals.
We believe the implied discount is attributable to (a) prolonged land monetization
plan, and (b) prevailing challenges in Central Mumbai commercial real estate due to
weak demand, oversupply threat and high vacancy.
Albeit slower value unlocking, lease model aids steady annuity stream
Currently, CENT has two commercial projects under construction (1) adjacent to
Century Bhavan (0.3msf/0.58msf of leasable area/construction area at total cost of
INR3.5b; to be completed by March 2013), and (2) on mill land (0.38msf/0.8msf of
leasable area/construction area at total cost of INR4.3b; to be completed by June
2013). Both the projects have witnessed significant progress (INR2.8b yet to be
incurred) and should begin yielding rent income from FY14. We estimate rent income
of INR0.7b/1.2b/1.5b in FY14/15/16E from ongoing development.
January 2013
36

Century Textiles
Non-cement businesses remain a drag on capital efficiency
CENT is a diversified company, with presence in cement, textiles, paper & pulp, and
chemicals. Cement is the biggest contributor to CENT’s sales (~56%) and EBITDA (~74%),
while textiles (revenue/EBITDA contribution of 26%/4%) and paper (revenue/EBITDA
contribution of 17%/15%) account for the balance. Historically, diversification has
helped CENT to address the vagaries of cyclical industries. Nonetheless, on the back
of recent operating performance, we believe paper (-2.1% RoCE against 52% of
allocated capital) and textiles (-2.6% RoCE against 21% of allocated capital) remain a
drag on overall capital efficiency.
Segment-wise revenue mix
Segment-wise EBITDA mix
Capital allocation skewed towards non-cement businesses, yet RoCE low for paper and textiles
Source: Company, MOSL
The paper business has
posted negative revenue
CAGR of 3% over FY09-12
owing to stiff
competition from China/
Indonesia, stringent
forest norms, etc.
Paper – capacity stabilization to drive growth amidst margin pressure
CENT offers a wide range of paper products catering to niche segments – pulp, writing
& printing paper, tissue paper, multi-layered packaging board, etc. The paper business
has posted negative CAGR of 3% over FY09-12 (led by 21% drop in FY12) owing to stiff
competition from China/Indonesia, stringent forest norms, etc. However, domestic
demand outlook remains stable (7-8% CAGR), also led by the government’s literacy
drive. CENT has ramped up its paper capacity to 0.42mtpa v/s 0.24mtpa in FY11 with
the commencement of its multi-layered packaging board plant (0.18mtpa). CENT has
0.16mtpa of pulp capacity, which would aid uninterrupted pulp supply for good quality
production. The company has incurred capex of ~INR22.6b in the paper segment over
FY09-12. We do not expect any major capex hereon, with focus on improving capital
efficiency (RoCE at -2.1/-2.9% in FY12/1HFY13).
37
January 2013

Century Textiles
We model 22% revenue CAGR over FY12-15, which would be attributable to (a)
stabilization of newly added capacity, (b) focus on speciality products, and (c) tapping
of export markets (UK, Iran, UAE, South East Asia, etc). Declining paper realizations
and sustained pressure of raw material (pulp) cost and supplies would keep margins
under pressure. We expect PBIDT margin to recover from 5% in FY13 (9.2% in FY12) to
8-10% in FY14-15.
Textiles – weak demand, intense competition remain headwinds
In the textiles segment, CENT has 25mtpa of capacity in Gujarat along with 21m meters
of denim, 26,000 tons of viscose, and 24,960 spindles (yarn) in Indore. The key products
include 100% cotton fabric, denim, viscose filament yarn (VFY), rayon yarn, etc. It has
forward integrated into the ready-to-wear segment by introducing the brand “Cottons
by Century” and has also developed export markets (Brazil, Chile and Bolivia) for VFY.
Encouraging recovery in
demand & soft cotton
prices over 1HFY13 bodes
well for 2-5pp margin
expansion
over FY13-15
Weak global demand, spiraling cotton prices and competition from Chinese/
Bangladeshi products have led to significant pressure on the segment, with muted
PBDIT margin (negative to 2% over FY09-12), despite revenue CAGR of 24%. However,
encouraging recovery in demand and soft cotton prices over 1HFY13 bodes well for
margin recovery. We model 24% revenue CAGR over FY13-15, with 2-5pp margin
expansion.
Expect capacity addition to drive paper sales
Expect moderate margin expansion in textiles
Source: Company, MOSL
Strength of Financials: Sharp rise in leverage a concern
Cement business
profitability to improve
over FY13-15 on account
of cost saving triggers
and improving
pricing
Expect profitability to revive on the back of cost saving triggers
The profitability of CENT’s cement business has been significantly lower than the
industry average, with FY12/13E cement EBITDA at INR456/516 per ton against INR850/
1,010 per ton for MOSL Cement Universe. This is largely on account of lower
realizations, vintage plants, and high lead distance. We expect cement business
profitability to improve over FY13-15 on account of (a) pricing strengths in operating
markets, (b) input cost moderation, and (c) benefit of upcoming CPP and new plants
(with subsidy incentives and better efficiencies). The 1.5mtpa grinding unit in West
Bengal would further increase blending. However, given its vintage plants, it would
be difficult for the company to completely bridge the gap between its current
profitability and the industry’s average profitability. We estimate 19% CAGR in CENT’s
cement EBITDA/ton over FY13-15 to INR734 (discount with peers to narrow by 5pp),
implying uptick in EBITDA margin from 13.2% in FY12 to 16-17% in FY13-15E.
38
January 2013

Century Textiles
Expect 34% EBITDA CAGR over FY13-15; high interest cost to drag PAT
We expect CENT to post revenue/EBITDA CAGR of 18%/34% over FY13-15E, as against
4%/-32% over FY10-12, on the back of steady volume growth and margin expansion in
the cement business. However, high interest cost on the back of spiraling debt would
eat away meaningful profit over FY13-14 (estimate interest cost at 1.25-1.6x EBIT).
Expect cost saving triggers to improve profitability
Interest cost to eat way significant profit (Interest/EBIT)
Source: Company, MOSL
Cement capacity
expansion and ongoing
commercial building
would necessitate
~INR28b of capex
over FY13-15
Net debt to increase further on the back of ~INR28b capex over FY13-15
We expect CENT’s installed capacity to increase from 8.5mtpa to 12.8mtpa by
September 2013, along with additional CPP of 60MW. The capex includes (1) greenfield
capacity of 1.5mtpa in West Bengal (capex of INR5.2b by March 2013), and (2) brownfield
expansion of 2.8mtpa in Manikgarh, Maharashtra (INR16b including 60MW of power
plant by September 2013). Both the projects have been delayed on account of
challenges relating to forest clearance, labor issues, etc. CENT has already incurred
~INR6b (of the total INR21b) till FY12; it plans to incur INR3.5b in FY13 and the balance
in FY14-15. This coupled with INR2.5b-3b towards ongoing commercial building would
necessitate ~INR28b of capex over FY13-15.
We model minimal capex towards textiles and paper as per management guidance,
since CENT has already heavily invested in these segments over FY09-12 (INR30b+).
We expect CENT’s net debt to peak out in mid-FY14. We estimate net debt of ~INR55b
(net debt-equity of 3x) in FY14 as against INR39.8b (net debt-equity of 2.1x) in FY12.
High leverage would remain an overhang for the company.
Expect non-cement capex to moderate (INR b)
High cement and real estate capex to dent FCF (INR b)
January 2013
39

Century Textiles
Net debt to peak out in FY15 (INR b)
Capital efficiency to revive slowly over FY13-15 (%)
Source: Company, MOSL
Valuation & View
Value unlocking in real estate could be back-ended
While the cement business is poised for steady improvement, acute margin pressure
in non-cement segments (textiles and paper) and high leverage (FY14E net debt-
equity of 3x) would remain drags in the near term. Though real estate offers
meaningful value unlocking potential, slow monetization, coupled with the relatively
weak outlook for commercial real estate in Mumbai would dilute upside potential.
Initiating coverage with a Neutral rating
CENT trades at 11.1x FY15E EBITDA. For the cement business, this implies FY15E EV of
USD72/ton v/s USD64/ton for MOSL Mid Cap Cement Universe and USD111/ton for
overall Cement Universe. Our SOTP-based valuation is INR460/share: (1) cement
(USD75/ton), (2) paper (1x FY15E sales), (3) textiles (0.4x FY15E sales), and (4) land
(FY15E NAV). We initiate coverage with a
Neutral
rating; our target price implies 8%
upside.
SOTP Valuation (INR m)
Textile
Cement
Implied
Paper
Others
Total EV
Less: Net Debt
Add: PV of Land
Market Cap
Fair Value (INR)
Upside (%)
Parameter
EV/Sales
EV/ton(USD)
EV/EBITDA
EV/Sales
EV/Sales
Multiple
0.4
75
1
0.5
FY14E
7,771
52,800
9.2
12,735
632
73,938
59,009
22,655
37,585
404
(5)
FY15E
8,937
52,800
7.3
14,327
696
76,759
60,150
26,177
42,787
460
8
Remarks
Valued at 20-30% discount to peers
Valued at 50% discount to replacement cost
Valued at 30-40% discount to peers
Valued at 30% discount to recent transaction
Source: Company, MOSL
January 2013
40

Century Textiles
Financials and Valuation
Income Statement
Y/E March
Net Sales
Change (%)
EBITDA
Margin (%)
Depreciation
EBIT
Interest Expenses
Other Income - Rec.
PBT before EO Expense
Extra Ordinary Expense/(Income)
PBT after EO Expense
Current Tax
Deferred Tax
Tax Rate (%)
Reported PAT
PAT Adj for EO items
Change (%)
Margin (%)
2010
44,529
16.7
7,311
16.4
2,345
4,966
1,005
903
4,864
-529
5,392
2,220
-387
34.0
3,560
3,211
15.9
7.2
2011
46,772
5.0
5,762
12.3
2,397
3,366
1,183
1,254
3,437
139
3,298
931
126
32.0
2,241
2,335
-27.3
5.0
2012
47,892
2.4
3,420
7.1
2,581
839
1,721
1,107
226
3
223
16
-12
1.9
219
221
-90.5
0.5
2013E
58,017
21.1
5,024
8.7
3,952
1,072
3,363
978
-1,312
0
-1,312
-328
0
25.0
-984
-984
-544.9
-1.7
(INR Million)
2014E
68,854
18.7
6,824
9.9
4,655
2,169
4,055
1,110
-775
0
-775
-194
0
25.0
-582
-582
-40.9
-0.8
2015E
80,634
17.1
9,037
11.2
5,369
3,668
4,511
1,314
471
0
471
118
0
25.0
354
354
-160.8
0.4
Balance Sheet
Y/E March
Equity Share Capital
Fully Dilute Eq Sh Cap
Other Reserves
Total Reserves
Net Worth
Deferred Liabilities
Total Loans
Capital Employed
Gross Block
Less: Accum. Deprn.
Net Fixed Assets
Capital WIP
Investments - Trade
Curr. Assets, Loans and Advances
Inventory
Account Receivables
Cash and Bank Balance
Loans and Advances
Others
Curr. Liability & Prov.
Account Payables
Other Current Liabilities
Provisions
Net Current Assets
Appl. of Funds
E: MOSt Estimates
January 2013
2010
930
930
16,822
16,822
17,752
3,576
23,668
44,995
46,748
21,904
24,844
12,874
584
20,339
8,684
2,251
574
7,702
1,128
13,646
7,949
172
5,525
6,694
44,995
2011
930
930
18,601
18,601
19,531
3,577
31,115
57,154
48,120
24,121
23,999
19,976
684
20,156
10,707
3,072
406
2,252
3,720
7,661
4,117
2,744
800
12,496
57,154
2012
930
930
18,059
18,059
18,989
4,633
40,344
67,309
67,130
26,038
41,092
11,119
714
22,002
10,952
3,335
501
2,104
5,110
7,617
3,117
3,575
925
14,385
67,309
2013E
930
930
16,585
16,585
17,515
4,633
50,544
76,035
76,850
29,990
46,859
11,800
714
23,159
11,444
3,974
101
2,543
5,096
6,497
3,497
3,656
-656
16,662
76,035
(INR Million)
2014E
930
930
15,513
15,513
16,444
4,633
60,544
84,964
100,150
34,645
65,505
1,000
714
25,281
12,639
4,150
536
2,830
5,126
7,535
4,150
3,773
-388
17,745
84,964
2015E
930
930
15,377
15,377
16,307
4,633
63,044
87,327
103,891
40,014
63,877
2,392
714
29,078
14,359
5,523
503
3,535
5,158
8,734
4,639
3,976
118
20,344
87,327
41

Century Textiles
Financials and Valuation
Ratios
Y/E March
Basic (INR)
EPS
Cash EPS
BV/Share
DPS
Payout (%)
Valuation (x)
P/E
Cash P/E
P/BV
EV/Sales
EV/EBITDA
EV/Ton (USD)
Dividend Yield (%)
Return Ratios (%)
RoE
RoCE
2010
34.5
59.7
190.8
5.5
16.8
2011
25.1
50.9
209.9
5.5
26.7
2012
2.4
30.1
204.1
4.5
223.9
2013E
-10.6
31.9
188.3
4.5
-49.8
2014E
-6.3
43.8
176.7
4.5
-84.2
2015E
3.8
61.5
175.3
4.5
138.5
179.7
14.2
2.1
1.4
19.9
90
1.1
-40.4
13.4
2.3
1.3
15.6
79
1.1
-68.4
9.8
2.4
1.4
14.4
78
1.1
112.5
6.9
2.4
1.2
11.0
73
1.1
20.3
16.1
12.5
10.0
1.1
3.5
-5.4
3.2
-3.4
4.5
2.2
6.4
Working Capital Ratios
Fixed Asset Turnover (x)
1.0
Asset Turnover (x)
1.0
Debtor (Days of sales)
18
Creditor (Days of sales)
65
Inventory (Days of sales)
71.2
Working Capital Turnover (Days of sales)50
Leverage Ratio (x)
Debt/Equity
1.0
0.8
24
32
83.6
94
0.7
0.7
25
24
83.5
106
0.8
0.8
25
22
72.0
104
0.7
0.8
22
22
67.0
91
0.8
0.9
25
21
65.0
90
1.3
1.9
2.6
3.6
4.6
4.9
Cash Flow Statement
Y/E March
Oper. Profit/(Loss) before Tax
Interest/Dividends Recd.
Direct Taxes Paid
(Inc)/Dec in WC
CF from Operations
EO Income/(Exp)
CF from Operating incl EO Expense
(inc)/dec in FA
(Pur)/Sale of Investments
CF from Investments
(Inc)/Dec in Debt
Interest Paid
Dividend Paid
CF from Fin. Activity
Inc/Dec of Cash
Add: Beginning Balance
Closing Balance
January 2013
2010
7,311
903
-2,607
130
5,736
1,957
7,693
-11,982
-119
-12,101
6,085
-1,005
-599
4,317
-91
665
574
2011
5,762
1,254
-3,513
-3,386
117
2,666
2,783
-8,654
-99
-8,753
7,447
-1,183
-599
5,802
-167
574
407
2012
3,420
1,107
-252
-503
3,772
423
4,195
-10,818
-30
-10,848
9,229
-1,721
-490
6,748
95
406
501
2013E
5,024
978
328
-2,677
3,653
0
3,653
-10,400
0
-10,400
10,200
-3,363
-490
6,347
-400
501
101
(INR Million)
2014E
6,824
1,110
194
-648
7,479
0
7,479
-12,500
0
-12,500
10,000
-4,055
-490
5,455
435
101
536
2015E
9,037
1,314
-118
-2,632
7,602
0
7,602
-5,134
0
-5,134
2,500
-4,511
-490
-2,501
-33
536
503
42

Initiating Coverage | Sector: Cement
Dalmia Bharat
BSE SENSEX
S&P CNX
19,987
6,057
CMP: INR193
TP: INR427
Buy
5-S framework
5-S score, Rank
74
Valuation score, Rank 96
1
1
Poised for fast-track growth, with entry into top league
De-risking market mix; initiating with Buy
Target price & upside
Base case
Blue Sky
INR427
INR669
122%
247%
Stock Info
Bloomberg
Equity Shares (m)
52-Week Range (INR)
1,6,12 Rel. Perf. (%)
DBEL IN
81.2
204/92
5/54/19
Dalmia Bharat (DBEL) is poised for strong scale-up, driven by sustained focus on capacity
and market expansion through both organic and inorganic routes.
DBEL to post 13% volume CAGR (FY13-15) on the back of (1) new expansion, (2) demand
recovery in southern states, and (3) uptick in utilization in North East capacity.
Strong operating cash flow (~INR23b over FY13-15, ex-subsidiaries) to support on-
going capex and later balance sheet de-leveraging.
DBEL trades at attractive valuations of USD46/ton for 15mtpa of pro-rata capacity
(~22mtpa capacity under control). We initiate coverage with a Buy rating; our target
price of INR427 implies 122% upside.
M.Cap. (INR b) / (USD b) 15.6/0.3
Capacity expansion to drive superior volume growth
DBEL is poised for strong operational scale-up, driven by sustained focus on
capacity and market expansion through both the organic and inorganic routes.
We expect its recent acquisitions of 2.8mtpa capacity in the North East (Adhunik
and Calcom), coupled with ongoing expansion – (a) 2.5mtpa of greenfield plant
in Karnataka (DCBL), (b) 1.5mtpa of grinding unit in West Bengal (OCL), and (c)
0.9mtpa of brownfield expansion at Calcom – to place it among the top-4 cement
groups in India in terms of capacity under management (21.9mtpa by FY15, with
effective stake of 15mtpa). We expect DBEL to post 12.7% volume CAGR FY13-15
(v/s 8.3% for our Cement Universe) on the back of (1) new expansion, (2) demand
recovery in southern states, and (3) uptick in utilization in North East capacities.
Valuation summary (INR b)
Y/E March
2013E 2014E 2015E
Sales
26.5 30.7 36.2
EBITDA
6.5
7.8
9.4
NP
2.5
3.3
3.6
Adj EPS (INR) 27.9 36.1 38.1
EPS Gr. (%)
33.9 29.4
5.6
BV/Sh. (INR) 383.3 419.4 458.3
RoE (%)
8.5 10.1 10.0
RoCE (%)
11.1 11.5 11.9
Payout (%)
14.6 12.9 12.9
Valuations
P/E (x)
6.9
5.3
5.1
P/BV (x)
0.5
0.5
0.4
EV/EBITDA (x) 4.6
3.4
3.1
EV/Ton (USD)
55
50
46
Diversifying market mix – not merely South-centered
DBEL (standalone) is a dominant player in the South (fourth-largest by FY14),
with the largest sales exposure in Tamil Nadu and Kerala (but with limited
exposure to AP with ~13% contribution). While unfavorable market outlook in
south and demand de-growth in Andhra Pradesh render near-term uncertainty,
the company has de-risked itself through (a) entry into the fast-growing North
East market, and (b) exposure to the better performing East market through OCL.
Shareholding pattern (%)
As on
Sep-12
Promoter
62.8
Dom. Inst
3.5
Foreign
14.4
Others
19.3
Jun-12 Sep-11
62.8
58.3
3.3
3.4
14.6
18.0
19.3
20.4
Superior profitability to sustain; balance sheet strength offers comfort
DBEL and OCL enjoy superior profitability on account of higher realizations and
operational efficiency. We expect the trend to continue, with added benefits
from (a) new CPP, (b) lower imported coal prices, and (c) positive operating
leverage, with recovery in demand in southern states and uptick in utilization in
newly acquired plants. We expect DBEL’s EBITDA/ton (ex-subsidiaries) to improve
from INR1,031 in FY12 to INR1,241/1,325 in FY14/15 (8% CAGR over FY12-15).
Ongoing capex plan of ~INR26.5b (including subsidiaries) would drive up effective
net debt to INR26b by FY14 as against INR8.7b in FY12. However, strong operating
cash flow (~INR23b over FY13-15 in standalone operations) visibility gives healthy
cushion to address capex need and future acquisitions. DBEL has maintained a
dividend payout of 18-20% over FY11-12.
Stock performance (1 year)
January 2013
43

Dalmia Bharat
Trading at steep discount for 4th larget player; initiating with Buy
DBEL trades at an EV/EBITDA of 3.4x/3.1x FY14/FY15 and EV of USD46/ton, for highly
efficient player who will evolve to be fourth largest player by FY15. Our SOTP value
stands at INR427/share: (1) DCB and OCL at 5x FY15E EBITDA, and (2) Adhunik and
Calcom at USD70/ton (FY15E capacity; as against acquisition cost of USD120-130/
ton), implying equity value of INR1.8b for Adhunik and a negative INR100m for
Calcom (owing to high debt and lower utilization till FY14). We initiate coverage
with a
Buy
rating; our target price of INR427 implies 122% upside.
About Dalmia Bharat (DBEL)
DBEL is a holding company (85% stake) for in Dalmia Cement Bharat (DCBL) - a SPV
owning all cement assets, with Kohlberg Kravis Roberts (KKR) holding the balance 15%.
DCBL has cement capacity of 9mtpa in Tamil Nadu and Andhra Pradesh. DCBL also holds
45.37% stake in OCL India (5.4mtpa capacity in Orissa), 100% stake in Adhunik Cement
(1.5mt capacity in Meghalaya) and 76% stake in Calcom (1.3mt capacity in Assam).
DBEL holds effective stake of 96.1% in DCB Power Venture, which has thermal power
generation capacity of 72MW.
Blue Sky Scenario
Dalmia Bharat
Dalmia Bharat has the potential to be a 4-bagger in 2-3 years, driven by:
Its being one of the top-4 cement producers in India, with capacity under control
of ~22mtpa (~15mtpa based on economic interest).
Ramp-up in North-East subsidiaries, resulting in higher profitability.
Deleveraging, driven by completion of ongoing capex and significant improvement
in cash flow from operations during the upturn in the cement cycle.
Improvement in capital efficiency, as capex over last 2-3 years starts contributing.
DBEL: Blue Sky Scenario (FY15)
DBCL
Parameter
EV/Ton (USD)
Multiple
100
INR m Catalyst
53,367 Scale-up of capacity to 11.5mt in an upcycle,
improving utilization and beginning of
balance sheet deleveraging
8,527 Commissioning of new capacity at West
Bengal, driving volumes and profitability
6,961 Improving utilizations driven by strong
growth in North East market, enjoying very
high profitability
7,477 Commissioning of clinker capacity driving
cost savings and high profitability
76,331
21,992
54,340
669
247
OCL
Adhunik
EV/Ton (USD)
EV/Ton (USD)
100
100
Calcom
EV/Ton (USD)
100
Total EV
Less: Pro-rata Net Debt (adj for CWIP)
Total Equity Value
Fair value (INR/share)
Upside (%)
DBEL: 5-S Analysis
1. Size & scalability [30]
2. Sales Mix [20]
3. Supply chain efficiencies [20]
4. Strategic & Other issues [10]
5. Strength of financials [20]
5-S Score
Valuation Score
January 2013
5-S Score
29
14
10
9
12
74
96
Rank
1
7
5
2
3
1
1
Average
21
15
11
7
11
65
76
44

Dalmia Bharat
5-S Analysis [Score 74 / 100] & [Rank 1]
Size & Scalability [29 / 30]
Strategic & Other Issues [9 / 10]
In the refractories segment, DBEL has installed
capacity of 0.08mtpa, while OCL has 0.11mtpa.
The total industry capacity is 2.5mtpa. Most of the
production capacity is underutilized (current
capacity utilization of 65%). Growth in the steel
industry (which accounts for 75% of the demand for
refractories) will be critical for demand uptick in the
refractories segment.
For DBEL's refractories business, we model 4%
volume CAGR and 9% revenue CAGR over FY12-15.
Recent open offer for Dalmia Bharat Sugar Ltd (DBSL)
for 26% stake is not consistent with demerger of
cement to bring focus.
Existing capacity of 9mtpa in DCBL, along with
5.35mtpa in associate, OCL (stake of 38.6%).
Recently acquired (a) 76% stake in Assam-based
Calcom Cement (1.3mtpa), and (b) 100% in
Meghalaya-based Adhunik Cement (1.5mtpa).
Strong expansion plans: (1) DCBL: 2.5mtpa at
Karnataka with 45MW CPP by 4QFY14, (2) OCL:
1.5mtpa grinding unit in West Bengal by 3QFY14, and
(3) Calcom: 0.9mtpa brownfield expansion.
Capacity to reach 21.9mtpa (~15mtpa pro-rata) in
FY15, placing DBEL among the top-4 in India.
We model 12.7% volume CAGR for DCBL (including
acquisitions) over FY13-15.
Sales Mix [14 / 20]
Dominant player in South India (fourth largest in
India by FY15), with largest sales exposure to Tamil
Nadu and Kerala, but limited contribution from AP.
Unfavorable Andhra Pradesh (~13% of standalone
volumes) market renders near-term uncertainty.
Has de-risked market mix with (a) entry into fast
growing North East market, and (b) exposure in
better performing East market through OCL.
We model price uptick of INR12.5/12.5 per bag in
FY13/14/15 for DCBL - 5.5% CAGR over FY13-15. For
OCL, we assume INR15/12.5 per bag price uptick,
implying 6% CAGR over FY13-15.
Strength of Financials [12 / 20]
Expect DBEL's (standalone) EBITDA/ton to improve
from INR1,031 in FY12 to INR1,325 in FY15 (8% CAGR).
Revenue/EBITDA to post 17%/20% CAGR over FY13-
15 (ex subsidiaries).
Capex of ~INR26.5b (includng subsidiaries) likely to
augment effective net debt to INR26.4b by FY14 as
against INR8.7b in FY12.
Strong standalone operating cash flow (~INR23b over
FY13-15) visibility to support on-going capex and
later drive balance sheet de-leveraging.
Has maintained dividend payout 18-20% over FY11-
12).
Supply Chain Efficiencies [10 / 20]
Valuation & View [96 / 100]
DBEL trades at an EV/EBITDA of 3.4x/3.1x FY14/FY15
and EV of USD46/ton, for highly efficient player who
will evolve to be fourth largest player by FY15.
Our SOTP value stands at INR427/share: (1) DCB and
OCL at 5x FY15E EBITDA, and (2) Adhunik and Calcom
at USD70/ton (FY15E capacity; as against acquisition
cost of USD120-130/ton), implying equity value of
INR1.8b for Adhunik and a negative INR100m for
Calcom (owing to high debt and lower utilization
till FY14).
We initiate coverage with a
Buy;
our target price of
INR427 implies 122% upside. Our Blue-sky scenario
suggests fair value of ~INR669, an upside of 247%.
DBEL enjoys superior profitability due to higher
realizations and operational efficiency.
Expect the trend to continue, with added benefits
from (a) new CPP, (b) lower imported coal prices,
and (c) positive operating leverage.
Limited clinker capacity to be drag on raw material
cost or volume growth for OCL and Calcom in short
term.
Higher lead distance due to rising dispatches outside
Andhra Pradesh to impact freight cost.
We model 4% CAGR in cost per ton over FY13-15.
Its recent acquisitions, Calcom and Adhunik, will
enjoy superior profitability due to subsidies offered
in North East and favorable demand-supply.
January 2013
45

Dalmia Bharat
Size & Scalability: Organic and inorganic expansion to aid strong scale-up
DBEL is expected to be
among the top 4 cement
players in India by FY15
in terms of capacity
under management
Organic/inorganic expansion to aid strong operational scale-up
DBEL has existing capacity of 9mtpa in DCBL, along with 5.35mtpa in associate, OCL
(effective stake of 38.6%). It has recently acquired (a) 76% stake in Assam-based
Calcom Cement (1.3mtpa), and (b) 100% in Meghalaya-based Adhunik Cement
(1.5mtpa), which will enhance its footprint in the fast growing North East market.
Besides strategic acquisitions, DBEL also has strong organic expansion plans:
DCBL:
2.5mtpa greenfield plant in Karnataka with 45MW CPP (INR13b ex CPP) by
4QFY14,
OCL:
1.5mtpa grinding unit in West Bengal (INR5-5.5b) by 3QFY14
Calcom:
0.9mtpa brownfield expansion (clinker capacity expansion of 1mtpa)
We expect capacity to reach 21.9mtpa (effective stake of 15mtpa) in FY15 as against
the current 17.1mtpa (effective stake of 11.8mtpa), placing DBEL among the top-4
cement groups in India in terms of capacity under management.
Strong scale-up in cement capacity would place DBEL among the top 4 cement groups in India
Source: Company, MOSL
We expect healthy
volume growth trend to
continue, led by steady
expansion, de-
bottlenecking of North
East capacity, and
demand recovery south.
Expect 13% volume CAGR over FY13-15
DCB has been operating at low capacity utilization owing to weaker business dynamics
in the southern states. OCL’s operations were impacted due to the mining ban in
Orissa in 4QFY12. DCB’s recent acquisitions in the North East are also witnessing
subdued utilization (25-35%) on account of various operational bottlenecks. Hence,
demand recovery coupled with easing of bottlenecks will drive volume growth. DBEL
has posted 15% CAGR in dispatch volumes over FY10-12 (v/s industry CAGR of 6%), led
by stabilization of capacity added over FY09-10. We expect the healthy growth trend
to continue, led by (1) steady expansion through organic and inorganic routes, (2) de-
bottlenecking of North East capacity, and (3) demand recovery in the southern states.
We model 13% volume CAGR for DCBL (pro-rata) and 7% for OCL (despite weaker
FY13) over FY12-15 v/s 8.3% for our Cement Universe.
Lower utilization offers huge scope for uptick in operating leverage
Utilization
DCBL
OCL
Calcom*
Adhunik*
FY07
79
94
FY08
95
100
FY09
52
50
FY10
50
57
FY11
58
64
FY12
60
58
25
35
FY13E
FY14E
FY15E
66
57
40
57
MOSL
46
63
71
62
53
29
37
42
49
Source: Company,
January 2013

Dalmia Bharat
We model 13% volume CAGR for DCBL (including acquisitions), including 8.5% CAGR for OCL
* including recent acquisitions
Source: Company, MOSL
Sales Mix: Diversification to de-risk market-mix
DCB's market mix is
skewed towards non-AP
southern states (TN and
Kerala), where
growth has been
largely stable
Core market unfavorable at present
-
de-risking strategy a positive direction
DBEL (through DCBL) is the sixth-largest cement player in the South and is likely to be
the fourth-largest by FY15, post the commissioning of its 2.5mtpa greenfield expansion
in Karnataka. Its plants are located near limestone reserves in Tamil Nadu and Andhra
Pradesh, and are strategically positioned to cater to all the southern states.
The southern region has been a major underperformer on account of prevailing
oversupply scenario, subdued demand and political crisis in key cement consuming
state- Andhra Pradesh (demand de-growth of 9%/5% in FY12/YTDFY13). However,
DCBL has posted steady volume growth of 16%/7.2% in FY12/9MFY13, given that its
market mix is skewed towards non-AP southern states, where growth has been largely
stable. Nonetheless, recovery in Andhra Pradesh would be a definite trigger, hereon.
OCL’s market mix remains steady due to favorable demand-supply dynamics at the
eastern region (demand growth of 7%). Additionally, upcoming elections in the key
demand-driving states like Karnataka, Andhra Pradesh and Orissa should boost
infrastructure commitments.
Steady market diversification to balance out southern headwinds
While unfavorable market outlook in south and sustained demand de-growth in
Andhra Pradesh render near-term uncertainty, the company has de-risked itself
through (a) exposure to the better performing East market through OCL, and (b) entry
into the fast-growing North East market. OCL India is focused on Orissa, West Bengal,
Bihar and Jharkhand. The company has ~23% market share in Orissa.
De-risking of market
concentration is in line
with DBEL’s objective of a
Pan India presence
DCB’s recent acquisition of (a) 76% stake in Assam-based Calcom Cement, and (b)
100% stake in Meghalaya-based Adhunik Cement would strengthen its footprint in
the fast growing North East market, where it will manage 2.8mtpa out of the total
7mtpa existing capacity. De-risking of market concentration is in line with DBEL’s
objective of a Pan India presence. The North East market is attractive, with cement
demand growing at 10-15% per year. Also, DCB’s local manufacturing presence will
give it a strong substitution opportunity, as ~30% of the cement demand in the North
East is currently being addressed by mainland sources.
January 2013
47

Dalmia Bharat
DCB’s market mix suggests lower exposure in AP
DCB has leading market share in major southern states
OCL’s market mix
OCL has the largest market share in Orissa
Source: Company, MOSL
Expect realization CAGR of 5% over FY13-15
Historically, both DCB and OCL have enjoyed higher realizations than our Cement
Universe (10-15% premium), owing to its market mix. The supply overhang and lower
capacity utilization in the South could lead to pricing volatility in the region. We
model price uptick of INR12.5/12.5 per bag in FY14/15 for DCBL – 5% CAGR over FY13-
15. For OCL, we assume INR15/12.5 per bag price uptick, implying 6% CAGR over FY13-
15 on the back of healthy outlook for the East market.
Supply Chain Efficiencies: CPP offers meaningful self sufficiency in power
Cost structure at par with MOSL Cement Universe
DCB’s cost of production is broadly in line with the industry average. It has installed
thermal power capacity of 72MW in DCBL Power Venture (effective stake of 96.1%),
which makes it ~60% self sufficient in energy at full capacity. Fuel mix is skewed
towards imported coal/pet coke from Indonesia (85%). The lower proportion (15%)
of linkage coal leads to higher energy cost for DCBL, despite superior energy efficiencies
– power utilization at 73kwh/ton (v/s 79-93kwh/ton for MOSL Cement Universe) and
coal requirement of <100kg/ton (v/s 120-160kg/ton for MOSL Cement Universe).
January 2013
48

Dalmia Bharat
OCL sources almost 45% of its fuel through linkage coal, 20-25% from open market
and the rest from imported coal. The higher proportion of linkage coal aids energy
efficiency for OCL. The management has indicated that due to no major linkage option,
its North East plants are likely to source fuel through open market purchases, which
could be a drag on overall energy cost.
We model 4% CAGR in cost of production over FY13-15.
DBEL’s energy cost structure
Fuel mix skewed towards imported coal
Source: Company, MOSL
Increase in CPP capacity to lower OCL’s energy cost
While DCB is ~60% self sufficient in energy requirement, OCL has commenced a 54MW
coal-based CPP (second unit of 27MW completed in April 2012) in Rajgangpur, Orissa.
This will significantly improve OCL’s cost efficiency, as ~90% of its power requirement
was earlier met through purchased power. Given that DCB’s upcoming plants will be
together with 45MW CPP, it will be able to meet ~75% of its power requirement in-
house by FY15.
DCB to benefit from softening of imported coal prices
Prices of imported coal and pet coke have softened meaningfully – down 13% in
YTDFY13 in INR terms. We expect this to translate into significant moderation in energy
cost, as imported coal accounts for ~85% of DCB’s fuel mix.
Limited clinker expansion in OCL a concern; expect synergies in North East
Limited expansion in clinker capacity (leading to higher purchased clinker) would be
drag on volume growth/ raw material cost for OCL. At its expanded capacity, cement:
clinker ratio would stand at 1.4x for DCBL and 2.3x for OCL. While clinker capacity is a
constraint at its recently acquired Calcom plant, we believe (1) 1mtpa of clinker
expansion by FY14-end, and (2) synergy with Adhunik plant (excess clinker) would
partially mitigate the concern.
Lower clinker capacity could be a drag on raw material cost / cement volume growth
Capacities (MT)
DCBL
OCL
Calcom
Adhunik
Total
January 2013
Current
Clinker
Cement
6.5
2.9
0.3
1.0
10.7
9.0
5.3
1.3
1.5
17.1
Expansion
Clinker
Cement
1.6
-
1.0
-
2.6
2.5
1.4
0.9
-
4.7
Total
Clinker
Cement
11.5
6.7
2.1
1.5
21.8
MOSL
49
8.1
2.9
1.3
1.0
13.3
Source: Company,

Dalmia Bharat
Freight cost impacted by higher lead distance
DBEL’s freight cost grew at ~14% CAGR over FY09-12, driven by diversification of its
market mix outside Andhra Pradesh. Given that its logistics mix is skewed towards
road transport (81%), we factor in ~10% increase in freight cost in FY13 to capture the
recent INR5/liter (+12.5%) hike in diesel prices. DBCL has set up a railway siding at
Andhra Pradesh plant, resulting in deeper market reach and lower logistics costs.
Acquisition of Calcom and Adhunik would make DBEL the only large player in the
North East with substantial logistics synergies.
Strategic & Other Issues: Steel Industry key to refractory demand growth
Fortunes of steel industry key to demand for refractories
DBEL has installed capacity of 0.08mtpa, while OCL has 0.11mtpa. The industry capacity
is 2.5mtpa, which is largely underutilized at 65% utilization. Growth in the steel
industry will be critical for growth in the refractories segment. For DBEL’s refractories
business, we model 4% volume CAGR and 9% revenue CAGR over FY12-15.
Ongoing open offer for DBSL for 26% stake is not consistent with demerger of
cement, although cash outflow would be insignificant at less than INR500m.
Strength of Financials: Leverage to increase led by ~INR29b over FY13-14
Superior profitability to continue with cost benefits
Both DCB and OCL enjoy superior profitability on account of higher realizations and
operational efficiency. However, higher raw material cost owing to purchased clinker
(further aggravated in case of OCL due to mining ban in Orissa) and spiraling energy
cost resulted in subdued EBITDA over FY11-12. We expect steady uptick in DCBL’s
profitability on the back of (a) improvement in realizations (expect increase of INR12.5/
bag in FY14 and INR12.5/bag in FY15), (b) moderating input cost inflation and benefit
of softening imported coal prices, and (c) positive operating leverage. We expect
DCBL’s cement EBITDA/ton to increase from INR1,031 in FY12 to INR1,325 in FY15 (9%
CAGR over FY12-15).
OCL is likely to post a sharp uptick in profitability over FY13-15, led by (1) INR15/12.5
per bag increase in realizations in FY14/15, and (2) cost savings following the
commencement of mining operations and full benefit of captive power plants. We
expect EBITDA/ton of INR1,363 in FY15 (v/s INR596 in FY12 and INR899 in FY11).
Expect above par profitability to sustain (EBITDA/ton)
Capital efficiency to improve with uptick
in utilization and profitability (%)
Source: Company, MOSL
January 2013
50

Dalmia Bharat
Premium profitability at North East plants
DBCL’s North East acquisitions (Calcom and Adhunik) are expected to enjoy multiple
subsidies such as VAT subsidy (INR400-500/ton for 10 years), transport subsidy (INR250-
300/ton for 5 years), and excise subsidy (~INR300/ton for 10 years). These translate
into total potential subsidy of INR1,000-1,200/ton, which should augment profitability,
despite poor capacity utilization (25-35%). While the management has not shared the
financials of recent acquisitions, we model EBITDA/ton of INR1,540 for Adhunik and
INR531 for Calcom (due to high clinker purchase) in FY13. Calcom is likely to witness
uptick in profitability once its clinker facility commences operations by early FY15.
We believe that strengthening of profitability hinges on (1) synergistic benefits in
logistics and clinker (excess clinker in Adhunik can be sourced by Calcom), (2) higher
realizations on account of branding, and (3) operating leverage.
Undergoing strong operational scale-up
DBEL is undergoing a strong capex cycle comprising both organic and inorganic
expansion to achieve its objective of Pan India footprints. Since January 2012, it has
acquired (a) 76% stake in Assam-based Calcom Cement with existing capacity of
1.3mtpa for INR3.15b, and (2) 100% stake in Meghalaya-based Adhunik Cement with
1.5mtpa capacity for INR5.6b. Its ongoing 0.9mtpa brownfield expansion at Calcom
plant (clinker capacity expansion of 1mtpa) will be operational by FY14-end,
necessitating capex of INR4b-5b.
Moreover, DCB has 2.5mtpa of upcoming greenfield expansion in Karnataka along
with 45MW CPP for total capex of INR16b, which is expected to be completed towards
the end of FY14. OCL is setting up a 1.5mtpa grinding unit at Medinipur, West Bengal at
a cost of INR5b. The project has already received most approvals and is expected to
get commissioned by November 2013. The company has recently commissioned a
10km conveyor belt for transportation of limestone from mines to plant.
Major expansion to conclude over FY13-15 (MT)
Current
Clinker Cement
DCBL
OCL
Calcom
Adhunik
Total
6.5
2.9
0.3
1.0
10.7
9.0
5.3
1.3
1.5
17.1
Expansion
Clinker Cement
1.6
-
1.0
-
2.6
2.5
1.4
0.9
-
4.7
Total
Clinker Cement
8.1
2.9
1.3
1.0
13.3
11.5
6.7
2.1
1.5
21.8
Capex Time line
16.0 4QFY14/1QFY15
5.5 3QFY14
5.0 FY14-end
NA 4QFY14/1QFY15
26.5
Source: Company, MOSL
OCL has obtained environment clearance for production of 2.7mtpa cement at its
Kapilas Cement Manufacturing Works, which currently has installed capacity of
1.35mtpa, although there are no immediate plans for expansion. It is also in the
process of obtaining requisite approvals and acquiring land for its captive coal block
in Orissa (14.7% stake with OCL Iron & Steel).
January 2013
51

Dalmia Bharat
Net debt (pro-rata) to peak in FY14 at INR27b
We expect the company to incur capex of ~INR26b (DBEL’s effective economic interest
of ~INR19b) across all entities over FY13-15. The funding will be done through a mix of
internal accruals and debt, with debt contributing ~70% of the capex. This, along with
~INR8b of recent acquisitions, is expected to increase effective net debt to INR27b by
FY14 v/s INR8.7b in FY12.
Expect effective net debt to increase by ~INR18b over FY13-14
Net Debt
Eff. Stake (%)
DBCL
85
OCL
38.6
Adhunik
85.0
Calcom
64.6
Total Net Debt
Net Debt based on Eco. Interest
FY12
8,233
4,295
0
0
12,528
8,654
FY13E
16,102
3,394
5,250
5,000
29,746
22,688
FY14E
FY15E
18,705
17,589
4,757
1,667
4,511
3,610
8,000
8,250
35,974
31,116
26,737
23,992
Source: Company, MOSL
Healthy operating cash flow offers strong cushion
DBEL (standalone) is likely to generate ~INR23b of cash flow from operations over
FY13-15, which renders strong cushion to its capex outflow. However, we expect the
company to fund a meaningful portion of the capex through debt, as its inorganic
growth strategy would necessitate surplus funds. Despite its ambitious growth plan,
DBEL has maintained a dividend payout of 18-20% over FY11-12).
DBEL to post 17% revenue and 20% EBITDA CAGR over FY13-15 (ex subsidiaries)
DBEL to generate operating cash flow of INR23b over FY13-15, limiting rise in leverage, despite huge capex
Source: Company, MOSL
January 2013
52

Dalmia Bharat
Valuation & View
Trading at very attractive valuation for fourth largest player
DBEL trades at very attractive valuations for highly efficient player who will evolve to
be fourth largest player by FY15. DBEL trades at an EV/ton of USD49/46 ton (v/s USD64/
56 for our Mid Cap Cement Universe and USD125/115 for our Full Cement Universe)
and 3.4x/4.1x FY14E/FY15E EBITDA (v/s 4.4x/3.5x EBITDA for our Mid Cap Cement
Universe and 7.4x/6.1x EBITDA for our Full Cement Universe).
Our target price implies 122% upside
Our SOTP value stands at INR427/share: (1) DCB and OCL at 5x FY15E EBITDA, and (2)
Adhunik and Calcom at USD70/ton (FY15E capacity; as against acquisition cost of
USD120-130/ton), implying equity value of INR1.8b for Adhunik and a negative
INR100m for Calcom (owing to high debt and lower utilization till FY14). We initiate
coverage with a Buy rating; our target price of INR427 implies 122% upside.
DBEL: Sum of the Parts valuations
INR m
Valuation method
Multiple
5
5
70
70
FY13E
FY14E
FY15E
DBCL
EV/EBITDA (x)
OCL
EV/EBITDA (x) & 40% hold-co discount
Adhunik
EV/Ton
Calcom
EV/Ton
Total EV
Less: Pro-rata Net Debt
Total Equity Value
Fair value (INR/share)
Upside (%)
Implied EV/Ton (on pro-rata capacity)
27,826 33,304 40,011
4,734 5,665 6,573
4,871 4,871 4,871
3,110 3,110 5,232
40,540 46,949 56,687
19,688 17,737 21,992
20,852 29,212 34,695
257
360
427
33.2
86.5
122.0
63
70
69
Source: Company, MOSL
January 2013
53

Dalmia Bharat
January 2013
54

Dalmia Bharat
Financials and Valuation
Income Statement
Y/E March
Net Sales
Change (%)
Total Expenditure
% of Sales
EBITDA
Margin (%)
Depreciation
EBIT
Int. and Finance Charges
Other Income - Rec.
PBT bef. EO Exp.
EO Expense/(Income)
PBT after EO Exp.
Current Tax
Deferred Tax
Tax Rate (%)
Reported PAT
PAT Adj for EO items
Change (%)
Margin (%)
2010
21,543
22.8
16,947
78.7
4,596
21.3
1,320
3,276
1,757
487
2,006
53
1,954
77
604
34.9
1,273
1,307
-2.2
6.1
2011
17,459
-19.0
13,811
79.1
3,648
20.9
1,753
1,895
1,724
543
714
0
714
86
525
85.5
103
103
-92.1
0.6
2012
23,304
33.5
17,748
76.2
5,556
23.8
1,817
3,739
1,513
874
3,099
395
2,704
832
396
45.4
1,476
1,691
1,538.8
7.3
2013E
26,470
13.6
19,923
75.3
6,547
24.7
1,817
4,730
1,709
754
3,775
0
3,775
1,510
0
40.0
2,265
2,265
33.9
8.6
(INR Million)
2014E
30,673
15.9
22,836
74.5
7,836
25.5
1,901
5,936
1,867
818
4,887
0
4,887
1,955
0
40.0
2,932
2,932
29.4
9.6
2015E
36,235
18.1
26,821
74.0
9,414
26.0
2,605
6,809
2,445
799
5,162
0
5,162
2,065
0
40.0
3,097
3,097
5.6
8.5
Balance Sheet
Y/E March
Equity Share Capital
Total Reserves
Net Worth
Deferred Liabilities
Total Loans
Capital Employed
Gross Block
Less: Accum. Deprn.
Net Fixed Assets
Capital WIP
Total Investments
Curr. Assets, Loans&Adv.
Inventory
Account Receivables
Cash and Bank Balance
Loans and Advances
Curr. Liability & Prov.
Account Payables
Provisions
Net Current Assets
2010
162
14,098
14,260
3,074
28,961
46,295
34,587
7,896
26,691
3,846
7,248
13,404
7,074
2,138
2,203
1,989
5,077
4,923
153
8,327
2011
162
27,615
27,777
715
18,890
47,381
37,765
1,846
35,919
1,167
6,592
10,179
2,976
1,008
4,543
1,651
3,965
3,774
191
6,214
2012
162
28,746
28,908
989
16,008
45,905
38,208
3,659
34,549
1,165
11,935
6,925
2,615
1,355
664
2,292
6,328
6,000
328
597
50,177
2013E
162
30,965
31,127
989
22,608
54,724
40,373
5,476
34,896
3,000
21,077
7,448
3,321
2,076
-605
2,657
8,907
6,642
2,265
-1,459
59,445
2014E
162
33,893
34,056
989
29,608
(INR Million)
2015E
162
37,049
37,212
989
26,608
64,809
53,373
9,982
43,390
2,000
21,077
12,932
4,546
2,841
1,907
3,637
10,589
8,524
2,065
2,343
70,741
64,652
41,373
7,377
33,996
9,000
21,077
13,123
3,848
2,405
3,792
3,079
9,170
7,215
1,955
3,953
69,957
Appl. of Funds
46,295
51,467
E: MOSL Estimates; * Adjusted for treasury stocks
January 2013
55

Dalmia Bharat
Financials and Valuation
Ratios
Y/E March
Basic (INR) *
EPS
Cash EPS
BV/Share
DPS
Payout (%)
Valuation (x) *
P/E
Cash P/E
P/BV
EV/Sales
EV/EBITDA
EV/Ton (US$)
Dividend Yield (%)
Return Ratios (%)
RoE
RoCE
Working Capital Ratios
Asset Turnover (x)
Inventory (Days)
Debtor (Days)
Leverage Ratio (x)
Current Ratio
Debt/Equity
* Adjusted for treasury stocks
3.2
9.5
0.5
119.9
33
2.6
2.0
2.4
5.4
0.3
62.2
19
2.6
0.7
2010
16.1
32.3
175.6
2.0
14.9
2011
1.3
22.9
342.1
1.3
114.3
2012
20.8
43.2
356.0
3.2
20.5
9.3
4.5
0.5
1.0
4.2
44
1.7
5.8
10.1
0.5
41.0
19
1.1
0.6
2013E
27.9
50.3
383.3
3.5
14.6
6.9
3.8
0.5
1.1
4.6
55
1.8
8.5
11.1
0.4
45.8
25
0.8
0.7
2014E
36.1
59.5
419.4
4.0
12.9
5.3
3.2
0.5
0.8
3.4
50
2.1
10.1
11.5
0.4
45.8
25
1.4
0.9
2015E
38.1
70.2
458.3
4.3
12.9
5.1
2.7
0.4
0.9
3.1
46
2.2
10.0
11.9
0.5
45.8
25
1.2
0.7
Cash Flow Statement
Y/E March
Oper. Profit/(Loss) before Tax
Interest/Dividends Recd.
Depreciation
Direct Taxes Paid
(Inc)/Dec in WC
CF from Operations
EO expense
CF from Operating incl EO
(inc)/dec in FA
(Pur)/Sale of Investments
CF from investments
Issue of Shares
(Inc)/Dec in Debt
Interest Paid
Dividend Paid
CF from Fin. Activity
Inc/Dec of Cash
Add: Beginning Balance
Closing Balance
2010
3,276
487
1,320
-77
-3,038
1,968
455
2,423
-3,141
-1,612
-4,752
-19
5,572
-1,757
-189
3,607
1,278
925
2,203
2011
1,895
543
1,753
-2,971
4,454
5,674
-53
5,622
-499
656
157
8,475
-10,072
-1,724
-118
-3,439
2,340
2,203
4,542
2012
3,883
874
1,817
-832
1,737
7,479
0
7,479
-441
-5,343
-5,784
-877
-2,882
-1,513
-303
-5,575
-3,880
4,543
663
2013E
5,464
754
1,817
-1,510
787
7,312
0
7,312
-4,000
-9,142
-13,142
0
6,600
-1,709
-330
4,561
-1,269
664
-605
(INR Million)
2014E
6,893
818
1,901
-1,955
-1,016
6,641
0
6,641
-7,000
0
-7,000
0
7,000
-1,867
-377
4,756
4,397
-605
3,792
2015E
7,897
799
2,605
-2,065
-274
8,962
0
8,962
-5,000
0
-5,000
0
-3,000
-2,445
-401
-5,846
-1,884
3,792
1,907
January 2013
56

Update | Sector: Cement
India Cements
BSE SENSEX
S&P CNX
19,987
6,057
8
3
CMP: INR88
TP: INR119
Buy
5-S framework
5-S score, Rank
58
Valuation score, Rank 89
Cost saving triggers to enhance profitability
Trading at steep discount; maintain Buy
Target price & upside
Base case
Blue Sky
INR119
INR217
35%
146%
Stock Info
Bloomberg
Equity Shares (m)
52-Week Range (INR)
1,6,12 Rel. Perf. (%)
M.Cap. (INR b) / (USD b)
ICEM IN
307.2
119/69
-3/-8/0
27/0.5
India Cements (ICEM) is poised to benefit from multiple cost saving triggers, resulting
in an improvement in EBITDA/ton from INR948 in FY12 to INR1,078 by FY15.
It is likely to witness meaningful balance deleveraging - from net debt/equity of 0.8x in
FY13 to 0.5x in FY15. We expect net debt to decline from INR31.3b in FY13 to INR21.6b
in FY15.
ICEM trades at an EV of USD56/ton v/s USD64/ton for MOSL Mid Cap Cement Universe.
Maintain Buy; our target price of INR119 implies 35% upside.
Volume growth hinges on market recovery
While there are concerns of oversupply in the South, capacity addition is slowing
down significantly. We expect ICEM to post volume CAGR of 8% over FY12-15,
driven by pick-up in demand in the South (especially in Andhra Pradesh, which
accounts for 18% of its sales) and in the North (Trinetra Cement). Given the weak
market dynamics and lower prevailing utilization level (~68%), however, the
southern region will remain susceptible to pricing volatility. We have assumed
INR13/12 per bag increase in realizations in FY14/15.
Valuation summary (INR b)
Y/E March
2013E 2014E 2015E
Sales
45.3 52.4 60.9
EBITDA
8.8 10.8 12.9
NP
2.1
3.4
5.0
Adj. EPS (INR) 7.7 12.6 18.1
EPS Gr. (%) 231.3 31.5 137.0
BV/Sh (INR) 145.3 153.3 166.8
RoE (%)
5.1
7.8 10.8
RoCE (%)
8.5 10.3 12.7
Payout (%)
45.7 32.1 21.8
Valuations
P/E (x)
11.5
7.0
4.9
P/BV (x)
0.6
0.6
0.5
EV/EBITDA (x) 6.1
4.6
3.4
EV/Ton (USD)
68
65
57
Multiple cost saving triggers to enhance profitability
ICEM has the highest cost structure in our Mid Cap Cement Universe due to (1)
higher energy cost (high dependence on grid power which has been unreliable
off-late), (2) rise in freight cost (increase in lead distance), and (3) negative
operating leverage (low utilization). However, from FY14, we expect it to derive
meaningful benefits from multiple cost saving triggers such as (1) commencement
of the Andhra Pradesh CPP (48MW) by March 2013, coupled with ramp-up in TN
CPP (captive power plants to account for ~80% of power requirement, and help
save INR1/unit), (2) stabilization of the recently commenced Indonesian coal
mine (to help save USD10-15/ton on cost of imported coal), and (3) softening of
imported coal prices (60% of fuel mix). We expect ICEM's EBITDA/ton to improve
from INR948 in FY12 to INR1,078 by FY15.
Shareholding pattern (%)
As on
Sep-12
Promoter
28.2
Dom. Inst 19.8
Foreign
32.9
Others
19.1
Jun-12 Sep-11
25.8
25.8
19.1
16.7
36.4
35.4
18.7
22.2
IPL offers option value; yet, non-core capital allocation a concern
While we do not assign any value to its IPL team, based on the floor valuation of
USD225m for the auction of the last two IPL teams, ICEM's IPL team can be valued
at INR38/share (~43% of the CMP). However, its investments in non-core activities
- capital allocation to shipping for ferrying own coal, investment in IPL, significant
inter-group company loans, and potential diversification into the infrastructure
business raise concerns of suboptimal capital efficiency.
Stock performance (1 year)
Moderating capex, strong CFO to result in deleveraging
ICEM is likely to witness meaningful balance deleveraging - from net debt/equity
of 0.8x in FY13 to 0.5x in FY15, driven by no meaningful capex (INR11b over FY13-
15) and strong cash flow from operations (INR28.6b). We expect net debt to
decline from INR31.3b in FY13 to INR21.6b in FY15.
January 2013
57

India Cements
Trading at steep discount; maintain Buy
ICEM trades at an FY15E EV of USD56/ton (v/s USD64/ton for MOSL Mid Cap Cement
Universe and USD111/ton for overall Cement Universe) and 3.9x FY15E EBITDA (v/s
3.9x FY15E EBITDA for MOSL Mid Cap Cement Universe and 5.9x FY15E EBITDA for
overall Cement Universe). We expect cost saving catalysts and steady demand
recovery to drive revenue/EBITDA/PAT CAGR of 16%/21%/54% over FY13-15. We value
ICEM at INR119/share (4x FY15E consolidated cement EBITDA). Maintain
Buy;
our
target price implies 35% upside.
About India Cements (ICEM)
India Cements (ICEM) is India's fifth largest cement company in terms of existing capacity.
It has 14.1mtpa in the South and owns 61% stake in Trinetra Cement (INR7b investment
in June 2011), which has a 1.5mtpa plant in the North (Rajasthan).
The South accounts for ~80% of its dispatches (ICEM is the dominant player in the South,
with ~12% volume share), with the West and the East accounting for the balance.
ICEM also owns Chennai Super Kings, a cricket team in the Indian Premier League (IPL).
Blue Sky Scenario
India Cements
India Cements has the potential to multiply 2.5x in 2-3 years, driven by:
Savings of ~INR850m (@ USD30/ton for 0.5m tons) from captive coal block in
Indonesia.
Valuing IPL @ USD200m, if monetized.
Re-rating, led by improvement in core profitability and monetization of IPL.
ICEM: Blue Sky Scenario (FY15)
Parameter
S/A EBITDA
Trinetra EBITDA (pro-rata)
EV @ 4x EBITDA
Value for IPL
Less: Net debt
Equity value
Target Price (INR)
Upside (%)
Implied EV/Ton (USD)
INR m
13,750
839
72,944
11,023
21,644
62,323
217
146
87
Remark
Assuming savings of ~INR850m from captive coal mine
from Indonesia
Valuing IPL at USD200m
ICEM: 5-S Analysis
5-S Score
1. Size & scalability [30]
2. Sales Mix [20]
3. Supply chain efficiencies [20]
4. Strategic & Other issues [10]
5. Strength of financials [20]
5-S Score
Valuation Score
23
12
10
3
10
58
89
Rank
3
9
5
8
6
8
3
Average
21
15
11
7
11
65
76
January 2013
58

India Cements
5-S Analysis [Score 58 / 100] & [Rank 8]
Size & Scalability [23 / 30]
ICEM has existing capacity of 14.1mtpa across 7 plants
in Tamil Nadu and Andhra Pradesh.
It owns 61% stake in Trinetra Cement, which has a
1.5mtpa plant in the North (Rajasthan).
It is operating at lower utilization of 67% owing to
weak market dynamics.
While there are concerns of oversupply in the South,
capacity addition is slowing down significantly. We
expect ICEM to post moderate volume CAGR of 8%
over FY12-15.
Strategic & Other Issues [3 / 10]
While we do not assign any value to its IPL team,
based on the floor valuation of USD225m for the
auction of the last two IPL teams, ICEM's IPL team
can be valued at INR38/share (~43% of the CMP).
However, its investments in non-core activities -
capital allocation to shipping for ferrying own coal,
investment in IPL, significant inter-group company
loans, unutilized treasury stocks, and potential
diversification into the infrastructure business raise
concerns of suboptimal capital efficiency.
CCI has levied a penalty of INR1.9b on ICEM along
with other cement companies on alleged
cartelization.
Sales Mix [12 / 20]
The South accounts for ~80% of its dispatches (ICEM
is the dominant player in the South, with ~12%
volume share), with the West and the East
accounting for the balance. Andhra Pradesh accounts
for 18% of its sales.
Given the weak market dynamics and lower
prevailing utilization level (~68%), the southern
region will remain susceptible to pricing volatility.
We have assumed INR13/12 per bag increase in
realizations in FY14/15.
Strength of Financials [10 / 20]
EBITDA/ton should improve from INR948 in FY12 to
INR1,078 by FY15.
Expect cost saving catalysts and steady demand
recovery to drive revenue/EBITDA/PAT CAGR of 16%/
21%/54% over FY13-15.
Net debt/equity likely to decline from 0.8x in FY13
to 0.5x in FY15, driven by no meaningful capex
(INR11b over FY13-15) and strong cash flow from
operations (INR29b).
Expect ~570bp uptick in RoE to 10.8% over FY13-15.
Supply Chain Efficiencies [10 / 20]
ICEM has the highest cost structure in our Mid Cap
Cement Universe due to (1) higher energy cost (high
dependence on grid power which has been
unreliable off-late), (2) rise in freight cost (increase
in lead distance), and (3) negative operating
leverage (low utilization).
However, from FY14, we expect it to derive benefits
from multiple cost saving triggers such as (1)
commencement of the Andhra Pradesh CPP (48MW)
by March 2013 (CPP to account for ~80% of power
requirement v/s ~40% in FY12, and help save INR1/
unit), (2) stabilization of the recently commenced
Indonesian coal mine (to help save USD10-15/ton
on cost of imported coal), and (3) softening of
imported coal prices (60% of fuel mix).
January 2013
Valuation & View [89 / 100]
ICEM trades at an EV of USD56/ton (v/s USD64/ton
for MOSL Mid Cap Cement Universe and USD111/
ton for overall Cement Universe) and 3.9x FY15E
EBITDA (v/s 3.9x FY15E EBITDA for MOSL Mid Cap
Cement Universe and 5.9x FY15E EBITDA for our Full
Cement Universe).
We value ICEM at INR119/share (4x FY15E
consolidated cement EBITDA). Maintain Buy; our
target price implies 35% upside.
We do not ascribe any value to the IPL team and
Indonesian captive coal mine.
Our Blue Sky scenario analysis indiactes for potential
2.5x in 2-3 years time with target price of INR217.
59

India Cements
Financials and Valuation
Income Statement
Y/E March
Net Sales
Change (%)
Total Expenditure
% of Sales
EBITDA
Margin (%)
Depreciation
EBIT
Int. and Finance Charges
Other Income - Rec.
PBT bef. EO Exp.
EO Expense/(Income)
PBT after EO Exp.
Current Tax
Deferred Tax
Tax Rate (%)
PAT Adj for EO items
Change (%)
Margin (%)
2010
37,711
10.0
29,445
78.1
8,265
21.9
2,331
5,934
1,426
370
4,877
-436
5,313
1,633
137
33.3
3,253
-32.9
8.6
2011
35,007
-7.2
30,670
87.6
4,337
12.4
2,440
1,897
1,417
396
876
-23
899
168
50
24.2
664
-79.6
1.9
2012
42,034
20.1
33,001
78.5
9,034
21.5
2,513
6,521
2,867
193
3,846
36
3,810
378
502
23.1
2,958
345.8
7.0
2013E
45,343
7.9
36,568
80.6
8,775
19.4
2,847
5,928
2,971
225
3,182
200
2,982
894
119
34.0
2,100
-29.0
4.6
(INR Million)
2014E
52,448
15.7
41,617
79.3
10,831
20.7
3,156
7,675
3,154
350
4,871
0
4,871
1,364
146
31.0
3,361
60.1
6.4
2015E
60,863
16.0
47,963
78.8
12,900
21.2
3,245
9,655
3,121
650
7,184
0
7,184
2,012
216
31.0
4,957
47.5
8.1
Balance Sheet
Y/E March
Equity Share Capital
Fully Diluted excl Treasury stock
Total Reserves
Net Worth
Deferred Liabilities
Total Loans
Capital Employed
Gross Block
Less: Accum. Deprn.
Net Fixed Assets
Capital WIP
Total Investments
Curr. Assets, Loans&Adv.
Inventory
Account Receivables
Cash and Bank Balance
Loans and Advances
Real Estate Projects WIP
Curr. Liability & Prov.
Account Payables
Other Current Liabilities
Provisions
Net Current Assets
Appl. of Funds
E: MOSL Estimates; * Adjusted for
January 2013
2010
3,072
2,872
38,286
41,358
2,693
21,327
65,378
57,102
17,916
39,186
7,029
3,140
2011
3,072
2,872
37,826
40,898
2,743
24,561
68,201
59,277
20,932
38,345
3,088
1,603
2012
3,072
2,872
37,604
40,676
3,245
27,010
70,931
65,019
23,690
41,329
1,451
8,520
31,202
5,258
2,098
29
23,613
204
11,571
6,330
3,916
1,325
19,631
70,931
2013E
3,072
2,872
38,674
41,746
3,364
35,429
80,538
68,970
26,537
42,433
2,000
8,520
41,305
5,901
3,416
4,170
27,613
204
13,719
6,957
4,969
1,793
27,586
80,538
(INR Million)
2014E
3,072
2,872
40,957
44,029
3,511
35,279
82,818
74,470
29,693
44,777
1,000
8,520
44,757
6,610
3,736
7,094
27,113
204
16,237
8,047
5,748
2,442
28,521
82,818
2015E
3,072
2,872
44,836
47,907
3,726
35,129
86,762
76,470
32,938
43,532
1,000
8,520
52,808
7,670
4,335
13,485
27,113
204
19,098
9,338
6,670
3,090
33,710
86,762
26,446
36,349
4,478
4,973
2,534
2,544
538
331
18,692
28,296
204
204
10,422
11,184
7,296
5,425
2,028
4,493
1,099
1,265
16,023
25,165
65,378
68,201
treasury stocks
60

India Cements
Financials and Valuation
Ratios
Y/E March
Basic (INR) *
Consol EPS
Cash EPS
BV/Share
DPS
Payout (%)
Valuation (x) *
P/E
Cash P/E
P/BV
EV/Sales
EV/EBITDA
EV/Ton (US$)
Dividend Yield (%)
Return Ratios (%)
RoE
RoCE
Working Capital Ratios
Asset Turnover (x)
Inventory (Days)
Debtor (Days)
Leverage Ratio (x)
Current Ratio
Debt/Equity
* Adjusted for treasury stocks
2010
11.3
19.4
144.0
2.0
20.3
2011
2.3
10.8
142.4
1.5
79.2
2012
9.6
19.0
141.6
2.0
24.5
2013E
7.7
17.2
145.3
2.5
45.7
2014E
12.6
22.7
153.3
3.0
32.1
2015E
18.1
28.6
166.8
3.0
21.8
9.2
4.6
0.6
1.2
5.7
63
2.3
11.5
5.1
0.6
1.2
6.1
68
2.8
7.0
3.9
0.6
1.0
4.6
65
3.4
4.9
3.1
0.5
0.7
3.4
57
3.4
8.4
10.6
1.6
3.6
7.3
10.1
5.1
8.5
7.8
10.3
10.8
12.7
0.6
43.3
22
0.5
51.9
27
0.6
45.7
18
0.6
47.5
28
0.6
46.0
26
0.7
46.0
26
2.5
0.5
3.3
0.6
2.7
0.7
3.0
0.8
2.8
0.8
2.8
0.7
Cash Flow Statement
Y/E March
Oper. Profit/(Loss) before Tax
Interest/Dividends Recd.
Direct Taxes Paid
(Inc)/Dec in WC
CF from Operations
EO expense
CF from Operating incl EO
(inc)/dec in FA
(Pur)/Sale of Investments
CF from investments
Issue of Shares
(Inc)/Dec in Debt
Interest Paid
Dividend Paid
CF from Fin. Activity
Inc/Dec of Cash
Add: Beginning Balance
Closing Balance
January 2013
2010
8,398
335
-1,443
-4,867
2,422
0
2,422
-2,961
-1,990
-4,952
2,831
1,878
-1,833
-661
2,215
-314
852
538
2011
4,337
396
-168
-9,349
-4,783
23
-4,760
2,342
1,537
3,878
-603
3,233
-1,417
-539
675
-207
538
331
2012
9,034
193
-378
5,232
14,080
-36
14,044
-3,860
-6,917
-10,777
-2,432
2,449
-2,867
-719
-3,570
-302
331
29
2013E
8,775
225
-894
-3,813
4,292
-200
4,092
-4,500
0
-4,500
0
8,419
-2,971
-898
4,549
4,142
29
4,170
(INR Million)
2014E
10,831
350
-1,364
1,989
11,806
0
11,806
-4,500
0
-4,500
0
-150
-3,154
-1,078
-4,382
2,924
4,170
7,094
2015E
12,900
650
-2,012
1,201
12,739
0
12,739
-2,000
0
-2,000
0
-150
-3,121
-1,078
-4,349
6,390
7,094
13,485
61

Initiating Coverage | Sector: Cement
JK Cement
BSE SENSEX
S&P CNX
19,987
6,057
2
5
CMP: INR337
TP: INR554
Buy
5-S framework
5-S score, Rank
69
Valuation score, Rank 81
Expansion to aid volume growth; white cement a cash cow
SOTP-based target price of INR554 implies 64% upside; Buy
Target price & upside
Base case
Blue Sky
INR554
INR710
64%
111%
Stock Info
Bloomberg
Equity Shares (m)
52-Week Range (INR)
1,6,12 Rel. Perf. (%)
M.Cap. (INR b) / (USD b)
JKCE IN
69.9
370/108
13/28/-7
24/0.4
Valuation summary (INR b)
Y/E March
2013E 2014E 2015E
Sales
30.6 37.5 48.3
EBITDA
5.9
8.1 11.0
NP
2.1
3.0
4.1
Adj EPS (INR) 30.6 42.8 60.3
EPS Gr. (%)
19.2 40.0 40.8
BV/Sh. (INR) 241.9 277.7 329.8
RoE (%)
13.3 16.5 19.4
RoCE (%)
16.1 17.2 19.1
Payout (%)
20.9 16.3 11.6
Valuation
P/E (x)
11.0
7.9
5.6
P/BV (x)
1.4
1.2
1.0
EV/EBITDA (x) 5.1
4.5
4.4
EV/Ton (USD)
69
77
76
JK Cement (JKCE) has a favorable market mix, with North and West India accounting for
~70% of dispatches. It has no exposure to the underperforming Andhra Pradesh market.
Its North India plants are operating at over 90% capacity and ongoing brownfield capacity
expansion, which is likely to be completed by 2Q/3QFY15, would aid volume growth.
Its white cement business is a cash cow. The stable operating income of INR2.5b-3b per
year from white cement would render meaningful cushion to JKCE's debt servicing
during the capex cycle.
We estimate 26% revenue CAGR over FY13-15 and expect an uptick in gray cement
profitability with (1) increasing contribution from new plants, and (2) improving
operating leverage.
JKCE currently trades at 4.3x FY15E EBITDA. Our SOTP-based target price is INR554 -
64% upside. We initiate coverage with a Buy rating.
Ongoing expansion, operating leverage to drive up volumes, profitability
JKCE has a favorable market mix, with North and West India accounting for ~70%
of its dispatches. Its Karnataka plant also supplies mainly to the West
(Maharashtra) and to relatively better placed states (Karnataka) in the South. It
has no exposure to the underperforming Andhra Pradesh market. The company's
North India (Rajasthan) plants are operating at over 90% capacity and there is
limited scope for production growth until the commissioning of the ongoing
brownfield expansion in 2Q/3QFY15. However, ramp up in the Karnataka plant
(operating at 52%/67% in FY12/2QFY13) renders meaningful cushion to volume
growth till FY14. We estimate 26% revenue CAGR over FY13-15 and expect an
uptick in gray cement profitability with (1) increasing contribution from the more
efficient new plants, and (2) improving operating leverage. We model ~24% CAGR
in EBITDA/ton to INR1,134/1,395 (INR813/896 for gray cement) in FY14/15E as
against INR914 (INR653 for gray cement) in FY13E.
Shareholding pattern (%)
As on
Sep-12
Promoter
66.6
Dom. Inst
9.1
Foreign
12.4
Others
11.9
Jun-12 Sep-11
66.6
66.2
7.2
7.1
12.1
12.9
14.2
13.8
White cement business a cash cow
JKCE is the second largest player in the duopolistic white cement industry in
India, with 40% market share. It has a production capacity of 0.4mtpa in India,
which will increase to 0.6mtpa by FY14. It is also adding a 0.6mtpa white cement
plant in UAE by December 2014 to address huge international demand. We expect
JKCE's white cement volumes to grow at 20% CAGR over FY13-15. We estimate
25% revenue/EBITDA CAGR for its white cement division over FY13-15, taking
EBITDA to INR3.2b in FY15 (v/s INR1.6b/INR2.1 in FY12/13E). The stable operating
income of INR2.5b-3b per year from white cement would render meaningful
cushion to JKCE's debt servicing during the capex cycle.
Stock performance (1 year)
Expect de-leveraging from FY15
We expect JKCE's net debt to increase from INR8.5b (net debt-equity of 0.6x) in
FY12 to ~INR25.7b (net debt-equity of 1.1x) by FY15 on the back of ~INR27.6b
capex over FY13-15. However, FCF generation from FY15 should trigger de-
leveraging. Currently, there are no meaningful capex plans beyond FY15.
January 2013
62

JK Cement
Capital efficiency to improve
JKCE's capital efficiency is superior compared to its mid-cap peers, largely due to (1)
old plants, (2) high utilization, and (3) robust profitability of its white cement
business. We expect its capital efficiency to improve by 3-6pp over FY13-15 to ~19%.
Full benefit of new capacities would drive further capital efficiency improvement.
SOTP-based target price of INR554 implies 64% upside; Buy
JKCE currently trades at 4.3x FY15E EBITDA. We value its gray cement business at 5x
FY15E EBITDA and white cement business (both domestic and UAE) at 7x FY15E
EBITDA. Our SOTP-based target price is INR554 - 64% upside. At our SOTP-based
target price, the stock would trade at an EV of USD57/ton on gray cement capacity
and USD100/ton on blended capacity. We initiate coverage with a
Buy
rating.
About JK Cement
JKCE is one of India's leading cement producers, with 7.5mtpa of gray cement capacity -
4.5mtpa in the North (Rajasthan) and 3mtpa in the South (Karnataka). It is the second largest
white cement manufacturer in India, with a capacity of 0.4mtpa (0.6mtpa by FY14).
Its ongoing 3mtpa split grinding expansion in the North would take its gray cement
capacity to 10.5mtpa by FY15. JKCE is also expanding its international footprint through
a 0.6mtpa Greenfield white cement plant in UAE to address rising international demand.
Blue Sky Scenario
JK Cement
JK Cement can multiply 2.2x in two years, driven by:
Commissioning of white cement plant at UAE and be-bottlenecking.
Improving efficiency, driven by new gray cement plant in Karnataka and
commissioning of new capacities in Rajasthan (including split grinding units).
Deleveraging, driven by completion of capex and increase in cash flow from
operations due to higher utilization during the upturn in the cement cycle.
Improvement in capital efficiency, as capex starts contributing fully from FY15.
JKCE: Blue Sky Scenario
EV/EBITDA
Target EV/EBITDA (x)
Grey Cement
White Cement
UAE White Cement
EV (INR m)
Consol Net debt (INR m)
Equity value (INR m)
Equity value (INR/Shr)
Implied EV/Ton (blended)
Implied EV/Ton (Grey)
Implied PE (White)
6
8
8
FY14E
32253
20642
1,523
54,419
12,486
41,932
600
FY15E
39084
25613
9,846
74,543
24,879
49,664
710
117
68
12.5
Average
21
15
11
7
11
65
76
63
JKCE: 5-S Analysis
1. Size & scalability [30]
2. Sales Mix [20]
3. Supply chain efficiencies [20]
4. Strategic & Other issues [10]
5. Strength of financials [20]
5-S Score
Valuation Score
January 2013
5-S Score
23
16
10
10
10
69
81
Rank
3
4
5
1
6
2
5

JK Cement
5-S Analysis [Score 69 / 100] & [Rank 2]
Size & Scalability [23 / 30]
Gray cement capacity of 7.5mtpa: (1) 4.5mtpa in the
Rajasthan, and (2) 3mtpa in the Karnataka.
Adding two split grinding units of 1.5mtpa each in
Jhajjar, Haryana (by September 2014) and Mangrol,
Rajasthan (by December 2014).
North-based capacity is operating at 90%+ utilization.
Ongoing brownfield capacity addition of 3mtpa kicks
in over 2Q/3QFY15. The South plant, which has seen
utilization increasing from ~52% in FY12 to 67% in
2QFY13, would aid volume growth till FY14.
Volumes grew 17.6% YoY in 1HFY13. We have
modeled 10% CAGR over FY13-15; the full impact of
planned addition would be evident in FY16.
Strategic & Other Issues [10 / 10]
Second-largest white cement player, with ~0.4mtpa
capacity (0.6mtpa by FY14) and ~40% market share.
It also manufacturers putty (0.3mtpa capacity).
Access to high quality limestone reserves gives a
strong competitive edge.
It is installing 0.6mtpa of white cement capacity in
UAE to cater to the rising export demand.
Volume growth has been strong - 17.5%/11% for
white cement and 39%/28% for putty in 1HFY13/FY12.
We model 20% CAGR for white cement over FY13-15
(ex UAE plant), taking EBITDA to INR3.2b in FY15.
CCI has levied a penalty of INR1.3b on JKCE along with
other cement companies on alleged cartelization.
Sales Mix [16 / 20]
Strength of Financials [10 / 20]
We expect 26%/37%/40% CAGR in JKCE's revenue/
EBITDA/PAT over FY13-15. We model ~24% CAGR in
EBITDA/ton to INR1,134/1,395 (INR813/896 for gray
cement) in FY14/15E as against INR914 (INR653 for
gray cement) in FY13E.
Net debt would increase to ~INR25.7b (net debt-
equity of 1.1x) by FY15 on the back of ~INR27.6b
capex over FY13-15.
FCF generation from FY15 should trigger de-
leveraging.
JKCE's capital efficiency is superior compared to its
mid-cap peers. We estimate further expansion of 3-
6pp over FY13-15.
Dispatch mix: North (~49%), Central (18%), West
(~18%) and South (15%).
Due to the proximity of its southern plant to the
relatively superior West India market, 55-60% of its
dispatches are to this region - mainly Maharashtra.
It has no exposure to the underperforming Andhra
Pradesh market.
JKCE witnessed weak realization growth over
1HFY13. We model in INR9/13/10 per bag increase in
average realizations over FY13/14/15.
The rising proportion of dispatches to South and
West India markets from the Karnataka plant would
also have a positive impact on overall realizations.
Supply Chain Efficiencies [10 / 20]
Sub-par cost structure due to old plants (lower
operating efficiency) and higher lead distance/
freight cost (absence of split grinding).
Has captive power capacity of 106MW, addressing
~80% of its total requirement. Fuel mix is skewed
towards pet coke and imported coal (~60%).
Freight mix is skewed towards road transport
(~80%), though the company is focusing on
increasing the share of rail transport.
We model a modest ~3% cost CAGR in gray cement
over FY13-15, led by (1) better operating efficiency
in new plants, and (2) lower lead distance.
Valuation & View [81 / 100]
JKCE currently trades at 4.3x FY15E EBITDA and USD76/
ton.
We value its gray cement business at 5x FY15E EBITDA
and white cement business at 7x FY15E EBITDA. Our
SOTP-based target price is INR554 - 64% upside.
Our blue sky scenario suggests that JKCE can deliver
over 100% returns in two years, led by (a)
commissioning of its white cement plant at UAE, (b)
improving efficiency, driven by new plant in
Rajasthan, (c) balance sheet deleveraging, driven
by completion of ongoing capex and significant
increase in cash flows from operations due to higher
utilization during the upturn in the cement cycle,
and (d) improvement in capital efficiency, as capex
incurred starts contributing fully to P&L from FY15.
64
January 2013

JK Cement
Size & Scalability: Expansion in the North to boost volumes from FY15E
Currently has gray cement capacity of 7.5mtpa
JKCE has existing gray cement capacity of 7.5mtpa across (1) three integrated cement
plants with an aggregate capacity of 4.5mtpa in the North (Rajasthan) - 3.3mtpa in
Nimbahera, 0.75mtpa in Mangrol, and 0.47mtpa in Gotan, and (2) a 3mtpa plant in the
South (Mudhol, Karnataka). JKCE has 5.6mtpa of clinker capacity - 2.2mtpa in the South
and the balance in the North.
Limited scope to enhance production in the North until brownfield expansion
Its North-based capacity is operating at 90%+ utilization. The scope to enhance
production is limited until the ongoing brownfield capacity addition of 3mtpa kicks in
over 2Q/3QFY15. The capacity addition will be distributed between two split grinding
units of 1.5mtpa each in Jhajjar, Haryana (to be operational by September 2014) and
Mangrol, Rajasthan (to be operational by December 2014).
Immediate volume growth hinges on ramp-up of production in the South
JKCE's Karnataka plant is currently operating at ~65%, in line with the industry capacity
utilization in South India. It has scaled up from ~52% utilization in FY12 to 67% in
2QFY13. We expect the utilization of JKCE's Karnataka plant to increase further, as 55-
60% of its dispatches cater to the superior western markets like Maharashtra. The
company has no exposure to Andhra Pradesh.
Volume growth to be driven by ramp-up in southern plant
Utilization of northern plants at over 90%;
southern plant operating at ~65%
Source: Company, MOSL
Expect 10% CAGR in gray cement volumes over FY13-15
JKCE posted strong volume growth of 17.6% YoY in 1HFY13, led by steady demand in
the North and ramp-up of its Karnataka plant. We have modeled 10% volume CAGR
over FY13-15. We expect the full impact of the ongoing capacity addition to benefit
volume growth in FY16.
January 2013
65

JK Cement
Sales Mix: Market mix favorable with 70% from North and West India
Market mix favorable; no exposure to Andhra Pradesh
JKCE has a favorable market mix, with North and West India accounting for ~70% of its
dispatches. The break-up of its dispatches is as follows: North (~49%), Central (~18%),
West (~18%) and South (~15%). The key contributing states are Rajasthan (21%), Haryana
(17%), Maharashtra (16%), Karnataka (13%), Madhya Pradesh (9%) and Uttar Pradesh
(9%). It has no exposure to the underperforming Andhra Pradesh market.
To benefit from better demand-supply outlook in the North
JKCE should benefit from better demand-supply outlook in the North over the next 2-
3 years. Due to the proximity of its southern plant to the relatively superior West
India market, 55-60% of its dispatches are to this region - mainly Maharashtra and
Gujarat. Its dispatches within South India are to better performing states like Karnataka
and it has no exposure to the subdued Andhra Pradesh market.
Sustenance of pricing discipline a key factor in the South
Sustenance of pricing discipline would be a key factor in South India, especially given
the (1) low utilization, and (2) depressed outlook for the largest cement consuming
state, Andhra Pradesh. Any negative cascading effect could disturb the stability of
the West and Central India markets.
Expect INR9/13/10 per bag increase in average realizations over FY13/14/15
JKCE witnessed weak realization growth over 1HFY13, with moderate rise of INR222/
bag since March 2012, followed by a sharp INR10-15/bag price drop in the North in
3QFY13. However, ex-Andhra Pradesh, the price decline in the southern states has
been relatively moderate. We expect cement prices to recover in the North in 4QFY13
along with volume uptick. We model in INR9/13/10 per bag increase in average
realizations over FY13/14/15. The rising proportion of dispatches to South and West
India markets from the Karnataka plant would also have a positive impact on overall
realizations.
Rising proportion of dispatches to West and South
India to improve realizations
Market mix evenly distributed; no exposure to Andhra Pradesh
Source: Company, MOSL
January 2013
66

JK Cement
Realizations historically lower than peers' average
Better demand dynamics in North and West India (utilization; %)
Source: Company, MOSL
Supply Chain Efficiencies: High cost structure; new plants to enhance efficiency
Sub-par cost structure due to old plants
JKCE operates at sub-industry level cost structure, disadvantaged by (1) older plants,
with inferior operating efficiency, and (2) absence of split grinding units, which
augments freight cost, given high lead distance of 625-700km. Weaker operating
efficiencies are signified by (1) JKCE's electricity consumption of ~90Kwh/ton v/s 77-
85Kwh/ton for its midcap peers, and (2) fuel consumption of ~900Kcal/kg v/s ~750Kcal/
kg for efficient peers.
JKCE's cost of production higher than MOSL average (INR/ton)
High lead distance, weak energy efficiency results in high
freight and energy costs
Source: Company, MOSL
JKCE has captive power capacity of 106MW (thermal: 93MW; waste heat recovery:
13MW) across four locations, addressing ~80% of its total requirement. Almost 60% of
fuel requirement is met with pet coke and imported coal. Its southern plant's proximity
to ports gives it easy access to imported coal. Its current freight mix is skewed towards
road transport (80%), though the management is focusing on increasing the share of
rail transport.
January 2013
67

JK Cement
Fuel mix skewed towards pet coke
Energy efficiency lower than peers (Kwh/ton)
Source: Company, MOSL
Captive power plants
Location
Gotan
Nimbhera
Bamania
Muddapur
Nimbahera
Total
Capacity (MW)
7.5
20
15
50
13
105.5
Type
Thermal
Thermal
Thermal
Thermal
Waste Heat recovery
Source: Company, MOSL
Limited strategic cost triggers
JKCE's total cost per ton escalated ~7% YoY in 1HFY13 and increased at a similar CAGR
over FY10-12, led by industry-wide escalation across cost factors. Given the continued
operating overhangs for its older plants, we do not see any major cost saving catalysts
in the near term.
However, new plants and split grinding units to enhance efficiency
As the contribution of its 3mtpa southern plant (commissioned in FY10) and two
upcoming split grinding facilities (total capacity of 3mtpa) in Rajasthan increases,
overall operating efficiencies should improve. Currently, JKCE's lead distance is 650km
in the North and 450km in the South. With split grinding units in Rajasthan, its average
lead distance and resultantly, freight cost should moderate. It should also benefit
from the declining trend in imported coal / pet coke parity prices (down ~13% YTD
FY13 in INR terms).
Expect moderate growth in cost of gray cement production
We model a moderate ~3% CAGR in cost of gray cement production over FY13-15,
which is attributable to (1) moderation in cost inflation, (2) benefit of new plants as
discussed above, and (3) operating leverage in the southern plant, which is ramping
up.
January 2013
68

JK Cement
Strategic & Other Issues: Number 2 in duopolistic white cement market
Leadership in high potential white cement market
JKCE is the second-largest player in the domestic white cement market, which is a
duopoly, with UltraTech (0.55mtpa capacity) being the leader. JKCE enjoys ~40% market
share in this segment, with 0.4mtpa of existing capacity at Gotan (Rajasthan). Ongoing
brownfield expansion of 0.2mtpa will take its total white cement capacity to 0.6mtpa
by FY14. While access to high quality limestone reserves gives JKCE a strong
competitive edge, the prevailing strong demand (both domestic and export markets)
renders huge growth visibility. It also manufacturers putty and has an installed capacity
of 0.3mtpa.
White cement offers strong demand potential
Growth Drivers
White cement demand growing at 10% per year;
growth drivers:
Higher per-capita consumption
Demand from wall putty, which is
growing at 30% per year
Higher demand from infrastructure development
in Qatar and the Middle East
Market Size & Supply
Installed capacity:
1mtpa
Only two major producers:
UltraTech Cement
and JK Cement
Domestic sales:
0.8mtpa
Export quantity:
0.15mtpa
Export markets:
South Asia, Middle East and
Africa
Entry of new players remote as:
Special quality limestone required
High investment costs
Problems in mine allocation
JK Cements
Current market share: 40%
Pan-India reach with established brand
White cement contributes 20-25% of sales
and 30-35% of profitability
White cement contribution sufficient to
service JKCE's overall interest liability and
dividend payout
Source: Company, MOSL
Capacity expansion to aid strong growth
JKCE's white cement business has posted strong growth over the last five years (FY07-
10 CAGR of 4% improving to 15% over FY10-13). White cement volumes grew 17.5%/
11% while putty volumes grew 39%/28% in 1HFY13/FY12. Currently, JKCE is operating
at 94%/60% capacity utilization in white cement/putty. We expect JKCE's white cement
business to continue registering strong growth on the back of (1) steady domestic
demand growth of 10%+, (2) ongoing capacity expansion of 0.1mtpa in each of FY13
and FY14, taking its total white cement capacity to 0.6mtpa and putty capacity to
0.5mtpa, (3) higher export market boost, and (4) strong brand equity and distribution
network.
We model 20% CAGR for white cement and 25% CAGR for putty over FY13-15 (ex UAE
plant). The segment enjoys ~30% EBITDA margin (white cement and putty combined).
We expect JKCE's white cement division to post 25% revenue/EBITDA CAGR over FY13-
15, taking EBITDA to INR3.2b in FY15 (v/s INR1.6b/INR2.1 in FY12/13E), which would
render meaningful cushion to its debt servicing during the capex cycle.
January 2013
69

JK Cement
Strong historical growth to continue in white cement
Expect 25% EBITDA CAGR over FY13-15
Source: Company, MOSL
Expanding overseas footprint to augment export market pie
Strong demand for white cement in both the domestic and overseas markets
(especially SAARC countries, Middle East, South Africa, Kenya, Tanzania, etc) has been
the key driver for JKCE's overseas greenfield project at Fujaira (UAE) in a 90:10 JV with
the Government of Fujaira. It is installing 0.6mtpa of white cement capacity (flexible
dual process, with potential 0.9mtpa of gray cement capacity) to equip itself to cater
to the rising export demand. The management's strategy would be to keep existing
capacity in India to entirely focus on domestic demand. The UAE plant is likely to
commence operations by December 2013. Assuming 50% utilization in FY15 and
investment of USD147m, we estimate ~17% RoCE and ~30%+ RoE for the UAE venture
(we have assumed zero income tax and ~7% cost of USD-denominated loan of
USD97m).
Strength of Financials: Net debt to peak at ~INR25b over capex cycle
Ongoing expansion to help scale up growth
We expect 26%/37%/40% CAGR in JKCE's revenue/EBITDA/PAT over FY13-15 as against
19%/10%/-1.6% CAGR over FY10-13. The healthy scale up would largely be attributable
to sustained volume growth, driven by added capacity and growing contribution from
white cement. Moreover, the full impact of upcoming gray cement capacity would aid
further growth in FY16; we model only partial benefit of spilt grinding expansion in
FY15.
Profitability to witness steady improvement
JKCE is witnessing steady growth in profitability after bottoming out in FY11, with
blended EBITDA/ton of INR511 (INR306 in gray cement). Its white cement business,
with steady sales growth and robust margins, adds meaningful resilience to
profitability. The segment contributes 20-25% of overall sales and 30-35% of EBITDA.
In the gray cement segment, despite no major cost saving trigger, we expect an uptick
in profitability on account of (1) rising sales contribution from the Karnataka plant,
with higher realizations and profitability, (2) improving operating leverage through
scale-up in utilization, (3) higher operating efficiency in newer plants, and (4) expected
moderation in variable cost inflation. We model ~24% CAGR in EBITDA/ton to INR1,134/
1,395 (INR813/896 for gray cement) in FY14/15E as against INR914 (INR653 for gray
cement) in FY13E.
January 2013
70

JK Cement
EBITDA/ton to increase with cost moderation, profitable sales mix and higher utilization
Ongoing capex to drive peak net debt to ~INR26b
JKCE's split grinding units of 1.5mtpa each in Jhajjar (to be operational by September
2014) and Mangrol (to be operational by December 2014) involve a capex of ~INR17.3b
(~USD105/ton) over FY13-15. The project would also include 25MW coal-based thermal
power plant, 9MW waste heat recovery-based power plant and railway siding at each
unit. JKCE is also undertaking brownfield expansion of 0.2mtpa in white cement, with
total capex of ~INR2.5b (~INR1.5b already incurred; balance to be incurred in FY14).
Both the expansions would reduce lead distance while catering to northern states.
The company has acquired land, obtained mining leases, and placed orders for the
plant and equipment. 60-70% of the capex would be debt-funded.
JKCE's UAE expansion would involve a capital expenditure of ~USD147m by December
2014, and it has already tied up for 2/3rd of the funding through debt (~USD97m). Till
date, it has incurred ~USD30m of total equity contribution of USD49m. EPC contract
has been awarded and civil and mechanical work is progressing on schedule. The
expansion will be key to cater to the Middle East and North African white cement
demand and infrastructure development projects.
Capex schedule over FY13-15 (INR b)…
…to augment net debt significantly
January 2013
71

JK Cement
Expect deleveraging from 2HFY15
We model capex of ~INR17.8b over FY14-15, following ~INR9.8b in FY13, which would
augment JKCE's net debt to ~INR25.7b (net debt-equity of 1.1x) by FY15 v/s INR8.5b
(net debt-equity of 0.6x) in FY12. The company is likely to generate FCF from FY15,
once the current capex cycle gets completed and operations at new plants begin,
triggering de-leveraging. Currently, there are no meaningful capex plans beyond FY15.
Expect JKCE to generate FCF from FY15 (INR b)
Payout ratio healthy, with 1.9% yield (%)
Source: Company, MOSL
Capital efficiency to improve 3-6pp over FY13-15
JKCE's capital efficiency is superior compared to its mid-cap peers, largely due to (1)
old plants, (2) high utilization, and (3) robust profitability of its white cement business.
We expect its capital efficiency to improve by 3-6pp over FY13-15 to ~19% on the back
of a steady volume growth driven by ongoing expansion. Full benefit of expanded
capacities could result in further improvement in capital efficiency in FY16. We have
modeled only a partial benefit of upcoming capacity in FY15.
Superior RoCE among mid-cap peers (%)
Capital efficiency to improve 3-6pp over FY13-15
Source: Company, MOSL
January 2013
72

JK Cement
Valuation & View
SOTP-based target price of INR554 implies 64% upside
JKCE currently trades at 4.3x FY15E EBITDA. We value its gray cement business at 5x
FY15E EBITDA and white cement business (both domestic and UAE) at 7x FY15E EBITDA.
Our SOTP-based target price is INR554 - 64% upside. At our SOTP-based target price,
the stock would trade at an EV of USD57/ton on gray cement capacity and USD100/ton
on blended capacity.
JK Cement: SOTP
EV/EBITDA
Target EV/EBITDA (x)
Grey Cement
White Cement
UAE White Cement
EV (INR m)
Consol Net debt (INR m)
Equity value (INR m)
Equity value (INR/Shr)
Implied EV/Ton (blended)
Implied EV/Ton (Grey)
Implied PE (White)
5
7
7
FY14E
26878
18062
1,333
46,273
12,486
33,786
483
FY15E
32570
22411
8,615
63,596
24,879
38,717
554
100
57
10.9
Source: Company, MOSL
January 2013
73

JK Cement
Financials and Valuation
Income Statement
Y/E March
Net Sales
Change (%)
Total Expenditure
% of Sales
EBITDA
Margin (%)
Depreciation
EBIT
Int. and Finance Charges
Other Income - Rec.
PBT bef. EO Exp.
EO Expense/(Income)
PBT after EO Exp.
Current Tax
Deferred Tax
Tax Rate (%)
Reported PAT
PAT Adj for EO items
Change (%)
Margin (%)
Less: Mionrity Interest
Net Profit
2010
18,268
22.0
13,891
76.0
4,377
24.0
855
3,522
616
193
3,098
0
3,098
1
852
27.5
2,246
2,246
58.8
12.3
-0.5
2,246
2011
20,831
14.0
18,180
87.3
2,651
12.7
1,128
1,523
1,185
412
750
-72
822
-55
251
23.9
626
571
-74.6
2.7
0
571
2012
25,379
21.8
20,329
80.1
5,050
19.9
1,256
3,794
1,443
558
2,908
78
2,830
902
182
38.3
1,746
1,794
214.2
7.1
0
1,794
2013E
30,648
20.8
24,774
80.8
5,874
19.2
1,328
4,546
1,966
565
3,146
0
3,146
1,007
0
32.0
2,139
2,139
19.2
7.0
0
2,139
(INR Million)
2014E
37,534
22.5
29,467
78.5
8,068
21.5
1,583
6,484
2,611
531
4,404
0
4,404
1,409
0
32.0
2,995
2,995
40.0
8.0
2
2,993
2015E
48,300
28.7
37,317
77.3
10,983
22.7
2,196
8,787
3,269
685
6,202
0
6,202
1,985
0
32.0
4,218
4,218
40.8
8.7
87
4,131
Balance Sheet
Y/E March
Equity Share Capital
Total Reserves
Net Worth
Deferred Liabilities
Total Loans
Capital Employed
Gross Block
Less: Accum. Deprn.
Net Fixed Assets
Capital WIP
Total Inves tments
Curr. Assets, Loans&Adv.
Inventory
Account Receivables
Cash and Bank Balance
Loans and Advances
Curr. Liability & Prov.
Account Payables
Provisions
Net Current Assets
Appl. of Funds
E: MOSL Estimates; * Adjusted for
2010
699
12,813
13,513
2,169
10,737
26,419
2011
699
13,250
13,949
2,109
13,808
29,866
2012
699
14,522
15,221
2,291
12,963
30,475
29,013
5,845
23,167
904
92
11,596
3,628
837
4,332
2,799
2,916
2,286
630
8,680
32,844
2013E
699
16,214
16,913
2,291
18,488
37,692
30,667
7,173
23,494
8,800
92
11,646
4,469
1,030
2,941
3,206
3,425
2,720
705
8,221
40,607
(INR Million)
2014E
699
18,719
19,419
2,291
26,928
48,638
40,502
8,756
31,745
12,500
92
12,280
5,334
1,185
1,849
3,911
4,424
3,437
986
7,856
52,194
2015E
699
22,363
23,062
2,291
29,928
55,281
58,202
10,952
47,249
800
92
17,424
6,784
1,508
4,157
4,975
5,761
4,372
1,389
11,662
59,804
23,772
27,450
3,245
4,481
20,526
22,969
2,296
1,028
48
42
6,791
9,948
2,376
3,210
819
608
1,318
3,215
2,278
2,916
3,579
2,188
3,294
1,753
285
435
3,212
7,761
26,418
31,799
treasury stocks
January 2013
74

JK Cement
Financials and Valuation
Ratios
Y/E March
Basic (INR) *
Consol EPS
Cash EPS
BV/Share
DPS
Payout (%)
Valuation (x) *
P/E
Cash P/E
P/BV
EV/Sales
EV/EBITDA
EV/Ton (US$)
Dividend Yield (%)
Return Ratios (%)
RoE
RoCE
Working Capital Ratios
Asset Turnover (x)
Inventory (Days)
Debtor (Days)
Leverage Ratio (x)
Current Ratio
Debt/Equity
* Adjusted for treasury stocks
17.7
15.9
0.7
47.5
13
1.9
0.8
4.2
7.4
0.7
56.2
9
4.5
1.0
2010
32.1
44.3
193.2
6.0
21.8
2011
8.2
24.3
199.5
2.0
26.0
2012
25.7
43.6
217.7
5.0
23.3
13.1
7.7
1.5
1.2
6.2
73
1.5
12.3
15.6
0.8
52.2
11
4.0
0.9
2013E
30.6
49.6
241.9
5.5
20.9
11.0
6.8
1.4
1.0
5.1
69
1.6
13.3
16.1
0.8
53.2
11
3.4
1.1
2014E
42.8
65.5
277.7
6.0
16.3
7.9
5.1
1.2
1.0
4.5
77
1.8
16.5
17.2
0.7
51.9
10
2.8
1.4
2015E
60.3
91.7
329.8
6.0
11.6
5.6
3.7
1.0
1.0
4.4
76
1.8
19.4
19.1
0.8
51.3
10
3.0
1.3
Cash Flow Statement
Y/E March
Oper. Profit/(Loss) before Tax
Interest/Dividends Recd.
Depreciation
Direct Taxes Paid
(Inc)/Dec in WC
CF from Operations
EO expense
CF from Operating incl EO
(inc)/dec in FA
(Pur)/Sale of Investments
CF from investments
Issue of Shares
(Inc)/Dec in Debt
Interest Paid
Dividend Paid
CF from Fin. Activity
Inc/Dec of Cash
Add: Beginning Balance
Closing Balance
2010
3,522
193
855
-1
-1,377
3,192
199
3,391
-2,329
-5
-2,334
-96
7
-616
-490
-1,196
-139
1,457
1,318
2011
1,523
412
1,128
55
-719
2,398
208
2,606
-2,411
5
-2,405
-27
3,071
-1,185
-163
1,695
1,896
1,318
3,214
2012
3,794
558
1,256
-902
633
5,338
29
5,368
-1,439
-50
-1,489
-68
-845
-1,443
-406
-2,761
1,117
3,215
4,332
2013E
4,546
565
1,328
-1,007
-385
5,047
-1
5,046
-9,550
0
-9,550
0
5,525
-1,966
-447
3,112
-1,391
4,332
2,941
(INR Million)
2014E
6,484
531
1,583
-1,409
-86
7,104
4
7,108
-13,535
0
-13,535
0
8,440
-2,611
-488
5,341
-1,086
2,941
1,855
2015E
8,787
685
2,196
-1,985
-532
9,151
-81
9,070
-6,000
0
-6,000
0
3,000
-3,269
-488
-757
2,313
1,849
4,163
January 2013
75

Initiating Coverage | Sector: Cement
JK Lakshmi Cement
BSE SENSEX
S&P CNX
19,987
6,057
CMP: INR141
TP: INR249
Buy
5-S framework
5-S score, Rank
66
Valuation score, Rank 85
6
4
Favorable market mix, expansion to drive volumes
To outperform peers on profitability growth; Buy
Target price & upside
Base case
Blue Sky
INR249
INR340
76%
140%
Stock Info
Bloomberg
Equity Shares (m)
52-Week Range (INR)
1,6,12 Rel. Perf. (%)
JKLC IN
122.4
172/42
2/60/205
JK Lakshmi Cement (JKLC) has no exposure to the South Indian market and has been
operating at 100% capacity utilization.
We expect 12% volume CAGR over FY13-15, on the back of debottlenecking of clinker
capacity, expansion of cement capacity and favorable market mix.
Superior cost structure coupled with 7% CAGR in realizations over FY13-15 will drive
14% CAGR in cement EBITDA/ton. We believe JKLC will outperform peers on profitability
growth.
JKLC trades at an FY15E EV of USD50/ton v/s USD64/ton for MOSL Mid Cap Cement
Universe. We initiate coverage with Buy, with target price of INR249 (upside 76%)
M.Cap. (INR b) / (USD b)17.3/0.3
Sailing on favorable market mix
Valuation summary (INR b)
Y/E March
2013E 2014E 2015E
Sales
21.2 25.0 30.3
EBITDA
4.3
5.7
7.1
NP
1.9
2.4
3.0
Adj EPS (INR) 15.9 20.3 25.1
EPS Gr. (%)
40.7 27.1 23.8
BV/Sh. (INR) 112.7 129.5 150.5
RoE (%)
15.0 16.7 17.9
RoCE (%)
15.6 17.1 18.5
Payout (%)
18.2 17.2 16.2
Valuations
P/E (x)
8.9
7.0
5.6
P/BV (x)
1.3
1.1
0.9
EV/EBITDA (x) 4.1
4.4
3.3
EV/Ton (USD)
62
57
51
JKLC's dispatch mix is skewed towards the North (~65%) and the West (~35%).
Commencement of the greenfield plant at Durg in Chhattisgarh and two split
grinding units in Bengal and Orissa by 4QFY14 would help it to diversify into the
better performing markets of East and Central India. Due to no exposure to the
under-performing South India market and healthy demand-supply equation in
other regions, JKLC has been operating at 100% utilization. Favorable market mix
renders stronger visibility of realization growth and profitability. We model INR15/
bag increase in realizations in FY14 and INR12 per bag in FY15.
Ongoing expansion and de-bottlenecking to scale up volume growth
JKLC is operating at maximum utilization. It has posted muted volume CAGR of
5% over FY10-13 due to limited scope to improve production. We expect
meaningful scale up in volume growth (modeling 12% CAGR over FY13-15) on the
back of (a) debottlenecking of clinker capacity by 0.33mtpa in exiting plant by
4QFY13, (b) expansion of cement capacity by 3.2mtpa by 4QFY14 (2.7mtpa of
greenfield at Durg and 0.5mtpa grinding unit at Surat), and (c) favorable market
mix. JKLC also plans to revive the defunct 1.2mtpa plant at Udaipur by FY15.
Shareholding pattern (%)
As on
Sep-12
Promoter
46.0
Dom. Inst 12.5
Foreign
7.4
Others
34.2
Jun-12 Sep-11
46.0
44.2
12.4
15.1
6.7
7.5
35.0
33.2
Self-sufficiency in power, softening imported coal prices to drive
profitability
We expect JKLC to maintain superior cost structure owing to (a) higher fuel
efficiency, (b) 100% self-sufficiency in power (lower generation cost of INR3.4/
unit; ~15% discount to MOSL Cement Universe average), and (c) softening pet
coke prices (85% of fuel mix). This, coupled with healthy uptick in realizations
(expect 7% CAGR over FY13-15) is likely to drive 14% CAGR in cement EBITDA/ton
over FY13-15 (model overall EBITDA margin of 20.4-23.4% over FY13-15 v/s 18.8%
in FY12). Potential sale of surplus power would be additional driver. JKLC will
outperform peers on profitability growth here on, leading to narrowing of
existing discount on EBITDA/ton with MOSL average over FY13-15 (15% v/s 22% in
FY12).
Stock performance (1 year)
January 2013
76

JK Lakshmi Cement
Steady OCF to limit leverage despite high capex requirement
We expect steady operating cash flow (INR4-6 annually over FY13-15) to restrict
JKLC's leverage despite high capex requirement of ~INR12b over FY13-15. Net debt
is estimated to peak out at INR10.6b (net debt-equity of 0.7x) in mid-FY14, before
the Durg plant commences and JKLC begins generating free cash flow.
Initiating coverage with a Buy rating
JKLC trades at FY15E EV of USD50/ton (v/s USD64/ton for MOSL Mid Cap Cement
Universe and USD111/ton for overall Cement Universe) and 3.3x FY15E EBITDA (v/s
3.9x FY15E EBITDA for MOSL Mid Cap Cement Universe and 5.9x FY15E EBITDA for
overall Cement Universe). We value JKLC at INR249/share (5x FY15E EBITDA),
implying an EV of USD76/ton of cement. We initiate coverage with
Buy
(76% upside).
About JK Lakshmi Cement
JK Lakshmi Cement (JKLC), promoted by the HS Singhania group, is a North India-based
cement company. It has a cement capacity of 5.3mtpa and a CPP capacity of 66MW,
which makes it self-sufficient in energy.
While the North and the West account for 90-95% of its current dispatch mix, ongoing
greenfield expansion of 2.7mtpa at Durg in Chhattisgarh would enhance its presence in
the central and eastern markets, raising total capacity to 8.5mtpa by FY14.
Blue Sky Scenario
JK Lakshmi
JK Lakshmi can potentially double in 2-3 years, driven by:
Ramp-up at its new plant at Durg, which will commission by March 2014, marking
JKLC's entry into East India.
Durg plant will be more efficient and profitable, boosting overall profitability.
Deleveraging, driven by completion ofcapex and significant improvement in
cash flow from operations during the upturn in the cement cycle.
Improvement in capital efficiency, as ongoing capex starts contributing.
JKLC: Blue Sky Scenario
EBITDA (INR m)
Target EV/EBITDA (x)
Target EV(INR m)
Net debt (INR m)
Target Equity value (INR m)
No of share (m)
Target Price (INR)
Upside (%)
EV/Ton (USD) at TP
FY15E
8,595
5
42,977
3,014
39,964
118
340
140
92
Remarks
Factoring for scale-up of Durg plant, will boost its
overall profitability
Doesn’t include any value from UCW subsidiary
JKLC: 5-S Analysis
5-S Score
1. Size & scalability [30]
2. Sales Mix [20]
3. Supply chain efficiencies [20]
4. Strategic & Other issues [10]
5. Strength of financials [20]
5-S Score
Valuation Score
January 2013
17
15
12
9
13
66
85
Rank
8
6
2
2
2
6
4
Average
21
15
11
7
11
65
76
77

JK Lakshmi Cement
5-S Analysis [Score 66 / 100] & [Rank 6]
Size & Scalability [17 / 30]
North India based cement company, with a capacity
of 5.3mt: (1) 4.2mt in Rajasthan, (2) 0.55mt in Gujarat,
and (3) 0.55mt in Haryana. Is enhancing clinker
capacity in Rajasthan by 0.33mt to 4.29mt.
2.7mtpa greenfield expansion at Durg (Chhattisgarh)
and 0.5mt grinding unit at Surat (Gujarat) to enhance
cement/clinker capacity to 8.5mt/5.8mt by 4QFY14.
Planning to revive group company, Udaipur Cement
Works' 1.2mt plant by June 2014.
Currently operating at 100%+ utilization. Expect 12%
volume CAGR over FY13-15 (v/s 15% growth in
1HFY13).
Strategic & Other Issues [9 / 10]
Has diversified into RMC, with total capacity of 0.7m
cubic meters across 14 plants. RMC business
accounts for ~7% of JKLC's revenue and enjoys
operating margin of 4.5-5%.
Plans to increase presence in value-added products
like Aerated Autoclaved Concrete (AAC) - first plant
in Haryana by mid-FY14.
Monetization of surplus power of 20MW offers
additional revenue stream potential.
Bought back shares; Acquiring defunct Udaipur
Cement Works from the promoter group
Sales Mix [15 / 20]
JKLC's dispatch mix is skewed towards the North
(~65%) and the West (~35%), with (1) Rajasthan
(30%), (2) Gujarat (30%), and (3) other northern
states being the key contributors.
Ongoing expansion to help diversify into better
performing East and Central India markets.
Market mix favorable due to no exposure to the
South and healthy utilization (75-85%) in other
regions.
Model INR15/bag increase in realizations in FY14 and
INR12/bag in FY15 (7% CAGR over FY13-15).
Strength of Financials [13 / 20]
Profitability bottomed out in 2QFY12; expect 14%
CAGR in cement EBITDA/ton over FY13-15 to INR1,034
in FY15.
Expect revenue/EBITDA/PAT CAGR of 20%/28%/26%
over FY13-15 (v/s 7%/-13%/-24% over FY10-12).
To outperform peers on profitability, with discount
vis-à-vis MOSL Cement Universe narrowing over
FY13-15 (15% v/s 22% in FY12).
Steady operating cash flow (INR4-6b annually over
FY13-15) to restrict leverage, despite heavy capex
need of ~INR12b over FY13-14. Net debt to peak out
at INR10.6b (net debt-equity at 0.7x) in mid-FY14.
Supply Chain Efficiencies [12 / 20]
Superior cost structure, with total cost at 10-15%
lower than MOSL Cement Universe.
Expect cost advantage to sustain, owing to (a) higher
fuel efficiency, (b) 100% CPP-based power self-
sufficiency, and (c) softening pet coke prices (85%
of fuel mix).
Freight cost to inch up due to (a) increase in rail
freight and diesel price, and (b) increase in lead
distance to 500-550km.
Model 4% CAGR in cost of production per ton over
FY13-15.
Valuation & View [85 / 100]
JKLC trades at an EV of USD50/ton (v/s USD64/ton
for MOSL Mid Cap Cement Universe and USD111/
ton for overall Cement Universe) and 3.3x FY15E
EBITDA (v/s 3.9x FY15E EBITDA for MOSL Mid Cap
Cement Universe and 5.9x FY15E EBITDA for overall
Cement Universe).
We value JKLC at INR249/share (5x FY15E EBITDA),
implying an EV of USD76/ton of cement. We initiate
coverage with Buy. Our target price implies 76%
upside.
Our Blue Sky scenario analysis indiactes for potential
140% return over 2-3 years time with target price of
INR340.
January 2013
78

JK Lakshmi Cement
Size & Scalability: Expansion and de-bottlenecking to drive volume
Debottlenecking of
clinker capacity and
expansion of cement
capacity to aid
meaningful uptick in
volume growth
Ongoing capacity expansion…
JKLC has existing capacity of 5.3mtpa across three integrated cement plants: (1) 4.2mtpa
at Sirohi (Rajasthan), (2) 0.55mtpa at Kalol (Gujarat), and (3) 0.55mtpa at Jhajjar
(Haryana). It is increasing clinker capacity at Jaykaypuram (Rajasthan) by 0.33mtpa
(0.165mtpa already commissioned, rest by 4QFY13) from 3.96mtpa to 4.29mtpa,
enhancing cement capacity by 0.5mtpa. Besides this, it is currently putting up a 2.7mtpa
greenfield capacity at Durg (Chhattisgarh) and 0.5mtpa of grinding units at Surat
(Gujarat). The ongoing expansion will take its cement/clinker capacity to 8.5mtpa/
5.8mtpa by 4QFY14. JKLC is also planning to revive its group company, Udaipur Cement
Works' 1.2mtpa cement plant by June 2014, in which it plans to take up majority stake
(not yet factored in our model).
…to help drive volume growth
JKLC is operating at maximum capacity utilization. It posted muted volume CAGR of
3% over FY10-12 due to limited scope to improve operating leverage. Nonetheless,
on the back of debottlenecking of its clinker capacity by 0.33mtpa and expansion of
cement capacity by 3.2mtpa (Durg and Surat), we expect it witness meaningful uptick
in volume growth (modeling 12% CAGR over FY13-15).
JKLC is operating at 100%+ utilization
Expect capacity addition to drive volume growth
Source: Company, MOSL
Sales Mix: North and West account for 90-95% of dispatches
Favorable demand-
supply dynamics in the
North and West regions
to render resilience to
JKLC's capacity utilization
and realizations
Market mix offers favorable outlook
JKLC's dispatch mix is skewed towards the North (~65%) and the West (~35%). Its key
markets are (1) Rajasthan (30%), (2) Gujarat (30%), (3) other northern states - Jammu
& Kashmir, Himachal Pradesh, Punjab, Haryana, Delhi and western Uttar Pradesh (35%),
and (4) Maharashtra (5%). We expect favorable demand-supply dynamics in the North
and West regions to render resilience to JKLC's capacity utilization and realizations.
Cement demand in the northern and western regions grew by 10% each in FY12,
compared to the Pan-India demand growth of 6.9%. With the commencement of
greenfield plant at Durg (Chhattisgarh) and two split grinding units (Bengal and Orissa)
by 4QFY14, JKLC would diversify into the even better performing markets of East and
Central India.
January 2013
79

JK Lakshmi Cement
JKLC's average realizations have been lower than our Cement Universe largely owing
to market mix. It has witnessed encouraging uptick over 1HFY13 (up INR28/bag over
FY12 average). We model INR23/15/12 per bag increase in FY13/14/15 and 7% CAGR
over FY13-15E.
Better demand dynamics in the North and the West
(utilization; %)
Demand growth in the North and the West v/s Pan India (%)
The North and the West account for 90-95% dispatches
Maharashtra,
5%
Realizations historically lower than MOSL Cement Universe
Source: Company, MOSL
Supply Chain Efficiencies: Energy efficiency, 100% CPP
The cost advantage is
primarily attributable to
lower energy cost and
fuel efficiency
Superior cost structure
JKLC enjoys superior cost structure, with cost of production at 10-15% lower than
MOSL Cement Universe average. The cost advantage is primarily attributable to lower
energy cost and fuel efficiency. Going ahead, we expect further cost savings on account
of 100% self-sufficiency in power and softening pet coke prices. However, freight
cost is likely to inch up, following the full impact of the hike in diesel prices and rail
freights. We model 4% CAGR in cost of production per ton over FY13-15E.
January 2013
80

JK Lakshmi Cement
Cost of production lower than MOSL Cement Universe (INR/ton) Energy cost escalation to soften, freight cost to inch up
Source: Company, MOSL
100% captive power to translate into further savings in energy cost
JKLC's energy cost stood at INR3.4/unit in FY12, which is almost ~15% lower than MOSL
Cement Universe. This is attributable to its 100% self-sufficiency in power (Durg
expansion will also have a CPP). The company added 30MW of power capacity in FY11,
by setting up (1) a waste heat recovery plant (12MW), and (2) a thermal power plant
(18MW), taking total CPP capacity to self-sufficient level of 66MW (v/s total power
requirement of 67MW). JKLC also has a tie-up with VS Lignite to source 21MW power
at INR3.94/unit. The combined supply leaves ~20MW of surplus power available for
merchant sales. JKLC enjoys efficient energy utilization (78units/ton of cement v/s
79-93units/ton for our Cement Universe).
Cost of power (INR/unit) at discount to industry average…
…largely attributable to 100% captive power (%)
Source: Company, MOSL
Softening of pet coke prices a key positive
Almost 85% of JKLC's fuel requirement is addressed by pet coke, while the balance is
through a mix of biomass (9-12% in 1HFY13) and domestic coal. Imported coal price
has declined ~13% in YTDFY13 (in INR terms), which led to a moderation in pet coke
prices as well. Softening of pet coke prices is expected to benefit JKLC's fuel cost.
January 2013
81

JK Lakshmi Cement
Imported coal prices moderated by 13% in YTD FY13 (INR/ton)
Trend in pet coke prices (INR/ton)
Source: Industry, MOSL
Freight cost impacted by higher lead distance
JKLC's freight cost increased by 11% annually over FY10-12, which is largely attributable
to (a) increase in rail freight, and (b) rise in lead distance to 500-550km owing to entry
into new markers. Its logistics mix is almost evenly distributed between rail (45%)
and road (55%). After the recent hike in diesel prices by INR5/liter (+12.5%), we factor
in 21% growth in freight cost in FY13 followed by 5% CAGR over FY13-15E.
Strategic & Other Issues: Surplus power to offer additional earning stream
Revenue from RMC
business accounts for 7%
of revenue at present
Minimal contribution from allied businesses (RMC, AAC blocks)
JKLC has diversified into RMC, with total capacity of 0.7m cubic meters across 14
plants. Revenue from the RMC business is ~INR1.3b, ~7% of JKLC's overall revenue (v/
s ~2% in FY08) and enjoys operating margin of 4.5-5%. It also plans to increase presence
in value-added products like Aerated Autoclaved Concrete (AAC) - the first plant is
likely to commence by mid-FY14 in Haryana. This product will help the construction
industry to save on labor cost and reduce construction time, thus bringing down overall
cost.
Segmental revenue mix trend (%)
Source: Company, MOSL
January 2013
82

JK Lakshmi Cement
Monetization of surplus power offers upside to EBITDA
JKLC added 30MW of captive power (CPP) in FY11: (1) 12MW waste heat recovery
plant, and (2) 18MW thermal power plant, taking its total CPP capacity to 66MW. It also
has a long-term agreement with VS Lignite for souring 21MW of power annually at a
fixed cost of INR3.9/unit for a period of 20 years. Combining both sources (87MW
against annual requirement of 67MW), JKLC will be left with 20MW of surplus power
capacity (upcoming Durg plant will have captive power), which can be sold in the
market at attractive rates. Assuming a selling price of INR4/unit (v/s cost of production
of INR3/unit), we estimate ~3% potential upside to our FY14E EBITDA.
Strength of Financials: Capex to drive peak debt to INR15b-16b
Profitability has bottomed out in 2QFY12
JKLC's profitability was severely impacted over FY10-12 due to (1) weak realization
growth (3% CAGR), and (2) sustained input cost pressure - particularly coal and power
- (12% CAGR in variable cost). EBITDA margin declined from 28.5% (EBITDA/ton of
INR915, 14% discount to MOSL average) in FY10 to 18.8% (EBITDA/ton of INR643, 23%
discount to MOSL average) in FY12. We believe profitability has bottomed out in
2QFY12 and a steady recovery in realization, coupled with moderation in cost factors
and better utilization has resulted in an encouraging revival in EBITDA/ton in 1HFY13
to INR900/ton. JKLC will outperform peers on profitability growth here on, leading to
narrowing of existing discount on EBITDA/ton with MOSL average over FY13-15 (9-
10% v/s 22% in FY12).
EBITDA/ton witnessing steady revival since 2QFY12
Revenue to post 20% CAGR over FY12-15
Expect steady recovery in margins
PAT to post 26% CAGR over FY12-15
Source: Company, MOSL
January 2013
83

JK Lakshmi Cement
Expect 14% CAGR in cement EBITDA/ton over FY12-15
We model 14% CAGR in cement EBITDA/ton over FY13-15E to INR1,034 (v/s INR643/
790 in FY1213E). Revenue/EBITDA/PAT are likely to post 20%/28%/26% CAGR over FY13-
15 (v/s 7%/-13%/-24% over FY10-12), while EBITDA margin is likely to expand by 3.1pp
over FY13-15E.
Leverage to increase with
ongoing capex cycle, but
steady OCF aid
meaningful cushion
Significant capex plan till FY14...
JKLC has almost ~INR16b of investment plan over FY11-15 to (a) augment clinker
capacity by 1.8mtpa to 5.8mtpa, and (b) cement capacity by 3.2mtpa to 8.5mtpa by
FY14. It has already incurred ~INR6b, and we expect the annual capex over FY13-14 of
INR5-7b. the company is also planning to revive its group company Udaipur Cement
Works' 1.2mtpa cement plant at an estimated capex of INR5.5b. JKLC will take majority
stake, with ~INR1.5b equity contribution. This plant is expected to start operations by
June 2014, albeit we are yet to factor in any contribution from it.
Key capex plans
Capex Plan
Jaykaypuram, Rajasthan
Durg, Chattishgarh
Plant type
Clinker
Greenfield Cement
with CPP (includes 2
split grinding units
at WB and Orissa).
Clinker capcity of 1.5mt
Grinding unit
AAC Block
Renovating old
cement plant
Capacity
(mt)
0.33
2.7
Capex
(INR m)
1,000
12,500
Commissioning
by
4QFY13
3QFY14
Surat/Jajjar
RMC
Haryana
Udaipur *
0.5
3 plants
1.32 Lac Cub mt
1.2
NA
500
500
1,500
16,000
4QFY14
FY14
4QFY13
FY15
FY12-15
Total
* Total capex of ~INR5.5b, with JKLC's equity contribution of INR1.5b
...but steady OCF offers cushion to leverage growth
On the back of scale up in capacity and profitability, we expect JKLC to witness uptick
in its operating cash flow (OCF) here on. We estimate annual OCF of INR4-6b over
FY13-15E (v/s INR3-3.5b at present), which should restrict any sharp increase in
leverage during capex cycle. JKLC's net debt is likely to peak out at INR10.6b (net
debt-equity of 0.7x) in FY14 on the back of estimated capex of ~INR12b over FY13-14.
Post FY14, we expect moderation in leverage, with free cash flow generation following
the commencement of the Durg plant.
Payout ratio healthy despite capex cycle
JKLC has maintained healthy payout of 15-25% (dividend yield of 1.5%) in the recent
past despite steady capex cycle. It has also made a buy-back offer to acquire shares up
to INR975m (13.9m equity shares), which is equivalent to 8.3% of net worth at the end
of 31 March 2012, at a price not exceeding INR70/share. It bought back 4.7m (3.8%)
equity shares. However, with the current market price being higher than the offer
price, JKLC may not be able to buy back more shares in the near future.
January 2013
84

JK Lakshmi Cement
Leverage to peak out in 1HFY15 (INR m)
Steady OCF to limit leverage despite significant capex
RoCE/RoE to improve from 13% in FY12 to 18% in FY15
Has maintained a payout of 15-30% despite capex (yield 1.5%)
Source: Company, MOSL
Valuation & View
To outperform peers on profitability
We expect JKLC to outperform peers on profitability, with discount vis-à-vis MOSL
Cement Universe narrowing over FY13-15 (15% v/s 22% in FY12). We estimate revenue/
EBITDA/PAT CAGR of 20%/28%/26% over FY13-15E (v/s 7%/-13%/-24% over FY10-12).
Initiating coverage with a Buy rating
JKLC trades at FY15E EV of USD50/ton (v/s USD64/ton for MOSL Mid Cap Cement
Universe and USD111/ton for overall Cement Universe) and 3.3x FY15E EBITDA (v/s
3.9x FY15E EBITDA for MOSL Mid Cap Cement Universe and 5.9x FY15E EBITDA for
oevrall Cement Universe). We value JKLC at INR249/share (5x FY15E EBITDA), implying
an EV of USD76/ton of cement. We initiate coverage with Buy (upside of 76%)
January 2013
85

JK Lakshmi Cement
Financials and Valuation
Income Statement
Y/E March
Net Sales
Change (%)
Total Expenditure
% of Sales
EBITDA
Margin (%)
Depreciation
EBIT
Int. and Finance Charges
Other Income - Rec.
PBT bef. EO Exp.
EO Expense/(Income)
PBT after EO Exp.
Current Tax
Deferred Tax
Tax Rate (%)
Reported PAT
PAT Adj for EO items
Change (%)
Margin (%)
2010
14,905
21.7
10,659
71.5
4,246
28.5
800
3,446
230
93
3,309
0
3,309
327
570
27.1
2,411
2,411
35.0
16.2
2011
13,168
-11.7
11,314
85.9
1,854
14.1
846
1,008
605
385
788
0
788
45
151
25.0
591
591
-75.5
4.5
2012
17,111
29.9
13,901
81.2
3,209
18.8
1,297
1,912
797
704
1,820
392
1,427
179
161
23.8
1,088
1,387
134.5
8.1
2013E
21,191
23.8
16,870
79.6
4,321
20.4
1,325
2,996
863
586
2,720
0
2,720
789
54
31.0
1,877
1,877
35.3
8.9
(INR Million)
2014E
25,022
18.1
19,359
77.4
5,663
22.6
1,586
4,077
1,233
600
3,445
0
3,445
999
69
31.0
2,377
2,377
26.6
9.5
2015E
30,344
21.3
23,230
76.6
7,115
23.4
2,095
5,020
1,378
620
4,262
0
4,262
1,236
85
31.0
2,941
2,941
23.7
9.7
Balance Sheet
Y/E March
Equity Share Capital
Total Reserves
Net Worth
Deferred Liabilities
Total Loans
Capital Employed
Gross Block
Less: Accum. Deprn.
Net Fixed Assets
Capital WIP
Total Investments
2010
612
9,595
10,207
1,111
9,217
20,536
19,036
8,407
10,630
1,820
4,805
2011
612
9,851
10,463
1,458
8,483
20,404
23,186
9,376
13,810
409
5,278
2012
612
11,140
11,752
1,512
9,429
22,692
24,500
11,207
13,293
2,941
4,538
7,085
1,201
382
890
4,612
5,443
5,127
316
1,642
22,692
2013E
589
12,675
13,263
1,566
11,429
26,258
25,500
12,531
12,968
5,941
5,538
8,183
1,433
475
415
5,861
6,650
5,861
789
1,533
26,258
(INR Million)
2014E
589
14,641
15,230
1,635
15,229
32,093
35,500
14,117
21,382
2,941
6,038
9,143
1,692
561
124
6,767
7,689
6,690
999
1,455
32,093
2015E
589
17,104
17,692
1,720
13,029
32,441
38,000
16,212
21,788
1,941
6,038
11,093
2,145
680
342
7,926
8,696
7,460
1,236
2,397
32,441
Curr. Assets, Loans&Adv.
6,656
4,880
Inventory
748
1,199
Account Receivables
290
280
Cash and Bank Balance
2,204
888
Loans and Advances
3,415
2,514
Curr. Liability & Prov.
3,566
4,359
Account Payables
2,202
4,127
Provisions
1,364
232
Net Current Assets
3,091
521
Appl. of Funds
20,536
20,404
E: MOSL Estimates; * Adjusted for treasury stocks
January 2013
86

JK Lakshmi Cement
Financials and Valuation
Ratios
Y/E March
Basic (INR) *
EPS
Cash EPS
BV/Share
DPS
Payout (%)
Valuation (x)*
P/E
Cash P/E
P/BV
EV/Sales
EV/EBITDA
EV/Ton (USD)
Dividend Yield (%)
Return Ratios (%)
RoE
RoCE
Working Capital Ratios
Asset Turnover (x)
Inventory (Days)
Debtor (Days)
Leverage Ratio (x)
Current Ratio
Debt/Equity
* Adjusted for treasury stocks
2010
19.7
26.2
83.4
2.5
14.8
2011
4.8
11.7
85.5
1.2
30.1
2012
11.3
21.9
96.0
1.9
25.3
2013E
15.9
27.2
112.7
2.5
18.2
2014E
20.2
33.7
129.4
3.0
17.3
2015E
25.0
42.8
150.3
3.5
16.3
12.5
6.4
1.5
1.1
5.7
71
1.4
8.9
5.2
1.3
0.8
4.1
62
1.8
7.0
4.2
1.1
1.0
4.4
57
2.1
5.7
3.3
0.9
0.8
3.3
51
2.5
26.0
20.4
5.7
7.3
12.5
13.0
15.0
15.6
16.7
17.0
17.9
18.4
0.7
18.3
6
0.6
33.2
7
0.8
25.6
7
0.8
24.7
7
0.8
24.7
7
0.9
25.8
7
1.9
0.9
1.1
0.8
1.3
0.8
1.2
0.9
1.2
1.0
1.3
0.7
Cash Flow Statement
Y/E March
Oper. Profit/(Loss) before Tax
Interest/Dividends Recd.
Depreciation
Direct Taxes Paid
(Inc)/Dec in WC
CF from Operations
EO expense
CF from Operating incl EO
(inc)/dec in FA
(Pur)/Sale of Investments
CF from investments
Issue of Shares
(Inc)/Dec in Debt
Interest Paid
Dividend Paid
CF from Fin. Activity
Inc/Dec of Cash
Add: Beginning Balance
Closing Balance
2010
4,246
93
0
-327
-454
3,558
132
3,690
-2,281
-3,916
-6,197
-159
2,191
-230
-358
1,444
-1,063
3,267
2,204
2011
1,854
385
0
-45
1,253
3,446
123
3,569
-2,739
-472
-3,212
-157
-734
-605
-178
-1,674
-1,317
2,204
887
2012
3,209
704
0
-179
-1,118
2,617
141
2,758
-3,845
740
-3,105
476
946
-797
-275
350
3
888
890
2013E
4,321
586
0
-789
-366
3,753
0
3,753
-4,000
-1,000
-5,000
-23
2,000
-863
-342
772
-475
890
415
(INR Million)
2014E
5,663
600
0
-999
-212
5,053
0
5,053
-7,000
-500
-7,500
0
3,800
-1,233
-410
2,157
-290
415
124
2015E
7,115
620
0
-1,236
-724
5,774
0
5,774
-1,500
0
-1,500
0
-2,200
-1,378
-479
-4,056
218
124
342
87
January 2013

Initiating Coverage | Sector: Cement
Madras Cements
BSE SENSEX
S&P CNX
19,987
6,057
CMP: INR233
TP: INR374
Buy
5-S framework
5-S score, Rank
68
Valuation score, Rank 65
3
7
Best in class, with superior profitability
Moderating capex, strong operations to aid healthy FCF visibility; Buy
Target price & upside
Base case
Blue Sky
INR374
INR476
61%
105%
Stock Info
Bloomberg
Equity Shares (m)
52-Week Range (INR)
1,6,12 Rel. Perf. (%)
M.Cap. (INR b) / (USD b)
MC IN
238.0
253/103
5/32/99
55/1
Madras Cements (MC) is likely to post ~10% volume CAGR over FY12-15 on the back of
steady uptick in utilization of newly added capacities.
It enjoys premium profitability (cement EBITDA/ton was INR1,125/1,251 v/s INR850/
1,010 for our Cement Universe in FY12/13E) due to superior realizations and
operational efficiencies.
MC is likely to generate ~INR26b of FCF over FY13-15, which should lead to meaningful
reduction in net debt by FY14/15 - we model net debt-equity of 0.2x by FY15.
MC offers an attractive play on superior operating efficiency, premium profitability
and strong FCF visibility. We initiate coverage with Buy with target price of INR374
(upside of 61%).
Valuation summary (INR b)
Y/E March
2013E 2014E 2015E
Sales
40.4 46.7 53.9
EBITDA
11.6 13.7 16.1
NP
4.7
6.1
7.9
Adj EPS (INR) 19.7 25.6 33.1
EPS Gr. (%)
21.7 30.3 29.1
BV/Sh. (INR) 103.3 126.0 155.6
RoE (%)
20.8 22.4 23.5
RoCE (%)
18.2 21.0 24.8
Payout (%)
12.7 11.7 10.6
Valuations
P/E (x)
11.8
9.1
7.0
P/BV (x)
2.3
1.8
1.5
EV/EBITDA (x) 6.8
5.3
3.9
EV/Ton (USD) 106
98
84
Stabilizing capacity to aid industry leading volume growth
MC has expanded its cement capacity by 6.5mtpa over the past five years. Despite
unfavorable dynamics in the southern market, we expect it to post ~10% volume
CAGR over FY13-15E, led by (1) stabilization of added capacity, (2) healthy growth
in south (ex-AP), and (3) ramp-up in dealer network in east coupled with increase
in capacity utilization at the West Bengal plant (improved to 55% from 30-35% in
FY12). We model improvement in total utilization from 61% in 1HFY13 to 76% in
FY15.
Operational efficiency, captive power drives superior profitability
MC enjoys premium profitability (cement EBITDA/ton was INR1,125/1,251 v/s
INR8501,010 for our Cement Universe in FY12/13E) due to superior realizations
and operational efficiencies. With the recent addition of captive power plants of
45MW in 1HFY13, and softening of imported coal (~75% of its fuel mix) prices, we
expect savings in energy cost. However, overall margin is likely to remain stable
at 29-30% (v/s 28-29% in FY12/13E), due to expectation of a moderate uptick in
realizations in south, which would be just enough to compensate for the cost
push from increase in rail freight, diesel price and lead distance. We model
EBITDA/ton of INR1,557 (cement EBITDA/ton of INR1,461) in FY15 v/s INR1,357
(cement EBITDA/ton of INR1,251) in FY13. MC has shown encouraging trend in
realizations and profitability over 1HFY13, which offers limited downside risks
to our estimates.
Shareholding pattern (%)
As on
Sep-12
Promoter
42.3
Dom. Inst 23.8
Foreign
5.0
Others
28.8
Jun-12 Sep-11
42.3
42.3
21.3
21.3
6.7
6.5
29.7
29.8
Stock performance (1 year)
Moderating capex, FCF visibility to trigger de-leveraging
MC underwent huge capex of ~INR44b over the last five years as a result of which
net debt spiraled to INR26.6b (net debt-equity of 1.3x). Given the lower prevailing
capacity utilization, we do not expect any major expansion in the near term,
barring the grinding capacity at Salem (0.4mtpa) and RR Nagar (1.1mtpa), which
are expected to be operational by March 2013 (INR1.7b). MC is likely to generate
~INR26b of FCF over FY13-15, which should lead to meaningful reduction in net
debt by FY14/15 (modeling net debt of INR18.9b (net debt-equity of 0.6x) in FY14
and INR8.8b (0.2x) in FY15).
88
January 2013

Madras Cements
Superior profitability justifies premium; initiating with Buy rating
MC has maintained a relatively low dividend payout (13-16%), which should improve
with the capex cycle nearing completion. The stock trades at FY15E EV of USD84/ton
(v/s USD64/ton for MOSL Mid Cap Cement Universe and USD111/ton for overall
Cement Universe) and 3.9x FY15E EBITDA (v/s 3.9x FY15E EBITDA for MOSL Mid Cap
Cement Universe and 5.9x FY15E EBITDA for overall Cement Universe). We value
MC at INR374/share (6x FY15E EBITDA) owing to its superior profitability and size.
We initiate coverage with a
Buy
rating; our target price implies 61% upside.
About Madras Cements
Madras Cements (MC) is one of the top three cement producers in South India with
total nameplate capacity of 12.5mtpa (0.95mtpa in West Bengal and the balance in the
South).
It also has operational wind farm capacity of 159MW and 157MW of CPP capacity.
Despite the unfavorable southern market, MC offers an attractive play due to superior
operating efficiency, premium profitability and strong FCF visibility.
Blue Sky Scenario
Madras Cements
Madras Cements has the potential to double in 2-3 years, driven by:
Benefit of operating leverage, as it improves utilization from ~63% in FY13 to
~82% in FY16E.
As a result, its balance sheet will turn net cash (~INR3b) by FY16 from current
net debt (~INR25.3b).
Likely improvement in RoE from 18% to 27%.
MC: Blue Sky Scenario
FY15E
EBITDA (INR m)
Target EV/EBITDA (x)
Target EV(INR m)
Net debt (INR m)
Target Equity value (INR m)
No of share (m)
Target Price (INR)
Upside (%)
EV/Ton at TP (USD)
16,062
6
96,372
7,284
89,088
238
374
60.9
130
FY16E
18,119
6
108,714
-4,560
113,274
238
476
104.6
147
MC: 5-S Analysis
5-S Score
1. Size & scalability [30]
2. Sales Mix [20]
3. Supply chain efficiencies [20]
4. Strategic & Other issues [10]
5. Strength of financials [20]
5-S Score
Valuation Score
24
13
8
9
14
68
65
Rank
2
8
9
2
1
3
7
Average
21
15
11
7
11
65
76
January 2013
89

Madras Cements
5-S Analysis [Score 68 / 100] & [Rank 3]
Size & Scalability [24 / 30]
MC has expanded its cement capacity by 6.5mtpa
(in June 2012, it added 2mtpa at Ariyalur) over the
last five years.
Along with grinding capacity at Salem (0.4mtpa) and
RR Nagar (1.1mtpa), this will augment MC's overall
cement capacity by 13.6mtpa by FY13.
No major expansion in the near term, as current
utilization is 61% (as at 1HFY13).
MC to post ~10% volume CAGR over FY13-15 (13%
growth in FY13), on the back of stabilization of
added capacities (17% YoY in 1HFY13).
Strategic & Other Issues [9 / 10]
Windmill segment (15% of capital allocation) has
posted ~6% revenue CAGR over FY09-12 and
accounts for 2-3% of overall net revenue.
The sgement has seen steady margin deterioration
from 91% in FY10 to 76% in FY12, with high
receivables from TNEB (INR980m).
Power RoCE at 4.2% (FY12) remains a drag on overall
capital efficiency (v/s cement RoCE of 22.4% and
overall RoCE of 15.4%).
CCI has levied a penalty of INR2.6b on MC along with
other cement companies on charges of alleged
cartelization.
Sales Mix [13 / 20]
Market mix broadly tilted towards South accounting
for 90% of total dispatches. However, market mix is
skewed towards better performing states - Tamil
Nadu, Karnataka and Kerala (~10% in Andhra
Pradesh).
The recent shift towards east market, driven by split
grinding unit at West Bengal would be favorable.
Lower utilization (65%) in the South will keep near-
term pricing trend volatile.
Expect realizations to increase by INR21/bag in FY13
and INR12 per bag each in FY14/15 (5.3% CAGR over
FY13-15). In 1HFY13, it posted a strong INR26/bag
increase.
Strength of Financials [14 / 20]
Superior realizations and operating efficiencies to
continue to aid premium profitability (25-20%
premium to MOSL Cement Universe average).
EBITDA/ton to witness 8% CAGR over FY13-15 to
INR1,461/1,557 (cement EBITDA/ton: INR1,360/
1,461) in FY14/15.
Revenue/EBITDA/PAT to post CAGR of 16%/18%/29%
over FY13-15, amidst stable margin of 29-30%.
Moderating capex and strong OCF to help generate
~IN26b of FCF over FY13-15, which should lead to
meaningful reduction in net debt by FY14/15
(modeling in net debt of INR18.9b (0.6x) in FY14 and
INR8.8b (0.2x) in FY15).
Supply Chain Efficiencies [8 / 20]
Softening pet coke prices (75% of fuel mix) and
recently commissioned power plants of 45MW
(taking CPP capacity to 157MW) will reduce grid
power dependence to negligible levels.
Energy efficient operations : (1) power consumption
to 78KWH/ton (v/s 83KWH/ton in FY11), and (2) coal
usage to 12% (v/s 14% in FY11).
Other expenses to remain high due to spending on
branding, dealer network and advertisement in the
newly entered eastern region, albeit benefit of
operating leverage will dilute impact.
Rise in capacity utilization to lend positive operating
leverage hereon. We model 4% CAGR in total cost
over FY13-15.
January 2013
Valuation & View [65 / 100]
MC has maintained a relatively low dividend payout
(13-16%), which should improve with the capex cycle
nearing completion.
The stock trades at FY15E EV of USD84/ton (v/s
USD64/ton for MOSL Mid Cap Cement Universe and
USD111/ton for overall Cement Universe) and 3.9x
FY15E EBITDA (v/s 3.9x FY15E EBITDA for MOSL Mid
Cap Cement Universe and 5.9x FY15E EBITDA for
overall Cement Universe).
We value MC at INR374/share (6x FY15E EBITDA)
owing to its superior profitability and size. We
initiate coverage with a
Buy
rating; our target price
implies 61% upside. Our Blue Sky valuation indiactes
for potential 105% return in 2-3 years time.
90

Madras Cements
Size & Scalability: Stabilization of added capacity to aid volume growth
Enjoys 10% capacity market share in South India
Madras Cements (MC) is one of the top three cement producers in South India, with
total nameplate capacity of 12.5mtpa (0.95mtpa in West Bengal and the balance in the
South), implying ~10% capacity market share in South India. It has five manufacturing
units along with three grinding units and has almost ~61% capacity located in Tamil
Nadu. It has operational wind farm capacity of 159MW and 157MW of CPP capacity.
Despite mix tilted towards southern market, MC offers an attractive play on superior
volume growth, operating efficiency, premium profitability and strong FCF visibility.
Leading cement producer in the South with largest exposure to Tamil Nadu
Source: Company, MOSL
Utilization ramp-up in recently added capacity…
MC has expanded its cement capacity by 6.5mtpa over the last five years, with a
recent addition being 2mtpa at Ariyalur (June 2012). Given the unfavorable demand-
supply dynamics in the southern market, the company is operating at subdued
utilization 65-70%, with its Andhra Pradesh plant being the worst affected (44%
capacity utilization).
Strong ramp-up in capacity over the last five years
Utilization muted due to demand-supply imbalance in south
Grinding
units at
TN and
WB
Ariyalur
Unit I
Ariyalur
Unit II
RR Nagar
upgradation
Source: Company, MOSL
January 2013
91

Madras Cements
We model improvement
in total utilization
from 61% in 1HFY13
to 76% in FY15.
…to aid industry leading volume growth
South India has been the worst performing cement market in the recent past, largely
due to sustained de-growth in the largest consuming Andhra Pradesh market.
Nonetheless, we expect MC to post ~10% volume CAGR over FY13-15 (15% in FY13) on
the back of (1) uptick in utilization of new capacities, (2) steady demand improvement
in Andhra Pradesh, and (3) ramp-up in dealer network in east and increase in capacity
utilization at the West Bengal plant (improved to 55% from 30-35% in FY12). We model
improvement in total utilization from 61% in 1HFY13 to 76% in FY15.
Recovery in demand, stabilizing utilization to strengthen
volume growth
Volume pick-up since 3QFY13 has been encouraging
Source: Company, MOSL
Sales Mix: Pricing outlook hinges on market recovery
MC's market mix in the
South (90% of total
dispatches) is skewed
towards better
performing states with
~10% exposure to AP
Southern market plagued with overcapacity
The southern market witnessed overcapacity coupled with muted demand growth
over FY10-12. Slowdown in demand was largely due to political turmoil in the major
consuming state, Andhra Pradesh. MC's market mix in the South (90% of total
dispatches) is skewed towards better performing states like Tamil Nadu, Karnataka
and Kerala, with only ~10% exposure to Andhra Pradesh. While Andhra Pradesh has
posted demand de-growth of 9%/5% in FY12/YTDFY13, the growth has been largely
stable (5-10%) in other southern states. Yet, we believe excess supply from Andhra
Pradesh would keep overall utilization of south-dependent players under pressure
in the near term. Going forward, demand recovery in Andhra Pradesh ahead of the
state elections will be a key factor to watch.
January 2013
92

Madras Cements
MC's sales mix skewed towards states other
than Andhra Pradesh (%)
Expect realizations to strengthen amidst demand uptick
(INR/ton)
Source: Company, MOSL
Healthy realization growth in 1HFY13, albeit subdued utilization may induce
volatility
In 1HFY13, MC posted a strong INR26/bag increase in cement realizations compared to
the FY12 average. However, we expect cement prices in the southern market to remain
volatile on the back of subdued utilization (expect ~65% over FY13-14). We expect
realizations to increase by INR21/bag in FY13 and by INR12/bag each in FY14/15 (5.3%
CAGR over FY13-15) on the back of slowing capacity addition and demand
improvement.
Supply Chain Efficiencies: Added CPP to aid energy cost savings
Post Recent expansion
MC's CPP capacity will
educe dependence on
grid power to negligible
levels
CPP capacity addition, favorable fuel cost trend…
MC has witnessed substantial increase in energy cost/ton over FY11-12 (CAGR of 14%)
due to sharp jump in the prices of imported coal and pet coke, which constitute ~75%
of its fuel mix. Going forward, we expect savings in fuel cost, led by (a) softening of
imported coal price (declined ~13% in YTDFY13 in INR terms), and (b) further CPP
contribtuion from its recently commissioned power plants of 45MW (25MW in RR
Nagar in 1QFY13 and 20MW in Ariyalur), which makes CPP capacity to 157MW, besides
its operational wind farm capacity of 159MW. This will reduce dependence on grid
power to negligible levels.
…coupled with operating efficiency to aid savings in energy cost
MC has posted encouraging improvement in power and fuel consumption over time.
In FY12, it reduced power consumption to 78KWH/ton from 83KWH/ton in FY11. Coal
usage as a percentage of cement production declined from 14% in FY11 to 12% in
FY12. We expect MC to maintain its energy efficiency and CPP contribution would
increase hereon to almost the maximum level (v/s 73% in FY12).
January 2013
93

Madras Cements
Post expansion CPP capacity distribution
Power Plant Capacity
R.R.Nagar, Tamil Nadu
Alathiyur, Tamil Nadu
Ariyalur, Tamil Nadu
Jayanthipuram, AP
Total
MW
25
36
60
36
157
MC has posted improvement in operating efficiency
Source: Company, MOSL
Freight cost to remain an overhang; other expenses high on new market spends
MC's freight mix is skewed towards road transport, which accounts for ~60% of its
volumes. Over 1Q/2QFY13, its freight cost went up by 22-27% YoY on account of (a)
increase in rail freight (by ~22%), (b) hike in diesel price by INR5/liter (~12%), and (c)
jump in lead distance due to higher dispatches outside Andhra Pradesh. We expect
the uptrend in freight cost to remain an overhang in the near term - we model 8%
CAGR in freight cost/ton over FY13-15. However, we expect some transportation cost
savings from new grinding units, which are located close to areas where fly ash is
readily available or in major cement consumption areas. Other expenses also
increased sharply in FY12 and are likely to remain high on account of higher spending
on branding, dealer network creation and advertisement in the eastern region, and
increase in packaging expenses.
Cost escalation to moderate; positive operating leverage to render support
We expect moderation in total variable cost escalation on the back of savings in energy
cost and softening of input costs, though freight cost would remain under pressure in
the near term. We model in 4% CAGR in total cost over FY13-15 as against 12% over
FY10-12. With the increase in capacity utilization, we expect favorable impact of
positive operating leverage.
Freight cost to remain
high over near-term ,
albeit new grinding units
may reduce lead distance
Expect moderation in cost factors over FY12-15 (INR/ton)
Source: Company, MOSL
January 2013
94

Madras Cements
Strategic & Other Issues: Windmill business offers additional revenue stream
Wind power - additional revenue stream, but drag on overall RoCE
MC has operational wind farm capacity of 159.2MW and 157MW of CPP capacity. Its
power capacity has not only reduced dependence on grid power for cement
operations, but has also become an additional source of revenue. Its windmill segment
has posted ~6% revenue CAGR over FY09-12 and accounts for 2-3% of overall net
revenue. However, MC has witnessed steady margin deterioration from 91% in FY10
to 76% in FY12. Tamil Nadu Electricity Board (TNEB) is the primarily consumer
(accounting for ~75% of units generated). Total receivables from TNEB stand at
INR980m, with collection cycle of 12-15 months. Margin pressure and high receivables
have resulted in deterioration in power RoCE to 4.2% in FY12. Our current valuation
does not capture any contribution from the power segment.
Margin pressure and high
receivables have resulted
in deterioration in power
RoCE to 4.2% in FY12.
Capital allocation mix (%)
Inferior power RoCE a drag on overall capital efficiency
Source: Company, MOSL
CCI penalty an overhang
CCI has levied a penalty of INR2.6b on MC along with other cement companies on
charges of alleged cartelization. Any adverse outcome of the case could impact MC's
cash flows. However, MC believes it has a strong case and has not made any provision
for this.
Strength of Financials: Profit leadership, moderating capex
Sustained profit leadership…
MC has enjoyed superior realizations on account of its market/product mix. This
coupled with operational efficiencies has resulted in superior profitability, with
EBITDA/ton at INR1,125 (v/s INR850/ton for our Cement Universe). It has maintained
EBITDA margin at 24-38% over the last six years. We believe its operating efficienies
renders strong resilience against potential pricing volatility in southern region.
January 2013
95

Madras Cements
Prevailing weakness in
southern market offers
potential pricing
volatility, and curbs any
major margin expansion
… to drive 18% EBITDA CAGR over FY13-15
On the back the industry-leading volume growth outlook and discipline in realization
trend, we estimate revenue/EBITDA CAGR of 16%/18% over FY13-15, amidst stable
margins of 29-30% (v/s 28/29% in FY12/13E). We assume only a moderate margin
expansion, which captures our belief that higher realizations would largely be diluted
by cost push. This implies cement EBITDA/ton of INR1,360/1,461 in FY14/15E v/s
INR1,125/1,251 in FY12/13E. Given the encouraging trend in realizations and
profitability over 1HFY13, we see limited downside risks to our estimates.
Expect MC to post 16% revenue and 18% EBITDA CAGR over FY13-15E
Estimate 8% CAGR in EBITDA/ton over FY12-15
PAT to grow at 30% CAGR owing to moderating interest
expense
Source: Company, MOSL
FCF visibility offers
strong potential to
reduce debt
Moderating capex to trigger de-leveraging
MC underwent huge capex of ~INR44b over the last five years to augment its capacity
by 6.5mtpa, as a result of which, net debt spiraled to INR26.6b (net debt-equity of
1.3x). Given the lower prevailing capacity utilization, we do not expect any major
expansion in the near term, barring the grinding capacity at Salem (0.4mtpa) and RR
Nagar (1.1mtpa), which are expected to be operational by March 2013 (INR1.7b). We
believe leverage has peaked out in 2HFY12. MC is likely to generate ~INR26b of FCF
over FY13-15, which should lead to meaningful reduction in net debt by FY14/15
(modeling net debt of INR18.9b (net debt-equity of 0.6x) in FY14 and INR8.8b (0.2x) in
FY15).
January 2013
96

Madras Cements
Strong FCF potential (due to lower capex) to cut down debt significantly over FY13-15
Dividend payout to increase with FCF (%)
RoCE and RoE to improve on the back of higher utilization (%)
Source: Company, MOSL
Valuation & View
Superior profitability justifies premium; initiating with Buy rating
MC has maintained a relatively low dividend payout (13-16%), which should improve
with the capex cycle nearing completion. The stock trades at FY15E EV of USD84/ton
(v/s USD64/ton for MOSL Mid Cap Cement Universe and USD111/ton for overall Cement
Universe) and 3.9x FY15E EBITDA (v/s 3.9x FY15E EBITDA for MOSL Mid Cap Cement
Universe and 5.9x FY15E EBITDA for our Full Cement Universe). We value MC at INR374/
share (6x FY15E EBITDA) owing to its superior profitability and size. We initiate
coverage with a
Buy
rating; our target price implies 61% upside.
January 2013
97

Madras Cements
Financials and Valuation
Income Statement
Y/E March
Net Sales
Change (%)
Total Expenditure
% of Sales
EBITDA
Margin (%)
Depreciation
EBIT
Int. and Finance Charges
Other Income - Rec.
PBT bef. EO Exp.
EO Expense/(Income)
PBT after EO Exp.
Current Tax
Deferred Tax
Tax Rate (%)
Reported PAT
PAT Adj for EO items
Change (%)
Margin (%)
2010
28,009
14.0
19,433
69.4
8,576
30.6
1,961
6,615
1,515
205
5,305
1
5,304
816
952
33.3
3,536
3,537
-3.1
12.6
2011
26,049
-7.0
19,868
76.3
6,181
23.7
2,208
3,973
1,399
399
2,973
16
2,957
824
39
29.2
2,094
2,105
-40.5
8.1
2012
32,361
24.2
23,173
71.6
9,188
28.4
2,539
6,649
1,592
517
5,574
5
5,569
1,121
602
30.9
3,846
3,850
82.9
11.9
2013E
40,353
24.7
28,789
71.3
11,564
28.7
3,115
8,449
2,065
555
6,939
0
6,939
1,700
555
32.5
4,684
4,684
21.7
11.6
(INR Million)
2014E
46,677
15.7
32,979
70.7
13,698
29.3
3,447
10,251
2,016
806
9,041
0
9,041
2,260
678
32.5
6,103
6,103
30.3
13.1
2015E
53,864
15.4
37,802
70.2
16,062
29.8
3,569
12,493
1,903
1,087
11,676
0
11,676
2,919
876
32.5
7,882
7,882
29.1
14.6
Balance Sheet
Y/E March
Equity Share Capital
Total Reserves
Net Worth
Deferred Liabilities
Total Loans
Capital Employed
Gross Block
Less: Accum. Deprn.
Net Fixed Assets
Capital WIP
Total Investments
Curr. Assets, Loans&Adv.
Inventory
Account Receivables
Cash and Bank Balance
Loans and Advances
Curr. Liability & Prov.
Account Payables
Provisions
Net Current Assets
2010
238
15,344
15,582
5,918
25,665
47,164
48,111
11,186
36,925
3,177
887
11,357
4,125
1,555
356
5,320
5,462
4,265
1,198
5,894
2011
238
17,107
17,345
5,890
27,912
51,147
51,105
13,175
37,930
5,457
2,673
10,988
3,923
1,751
400
4,913
5,900
4,564
1,335
5,088
2012
238
20,266
20,504
6,492
27,104
54,100
56,704
15,553
41,152
5,276
2,665
11,491
4,911
2,079
475
4,026
6,483
4,892
1,591
5,008
54,100
2013E
238
24,354
24,592
7,047
26,604
58,243
65,680
18,668
47,012
2,300
2,665
14,710
6,065
2,653
1,316
4,675
8,443
6,318
2,125
6,267
58,243
2014E
238
29,743
29,981
(INR Million)
2015E
238
36,792
37,030
8,601
18,604
64,235
70,480
25,684
44,796
1,500
2,665
27,355
8,095
3,542
9,815
5,903
12,082
8,433
3,649
15,274
64,235
7,725
24,104
61,810
69,480
22,115
47,365
1,500
2,665
20,413
7,015
3,069
5,214
5,115
10,133
7,307
2,825
10,281
61,810
Appl. of Funds
47,164
51,147
E: MOSL Estimates; * Adjusted for treasury stocks
January 2013
98

Madras Cements
Financials and Valuation
Ratios
Y/E March
Basic (INR) *
Consol EPS
Cash EPS
BV/Share
DPS
Payout (%)
Valuation (x)
P/E
Cash P/E
P/BV
EV/Sales
EV/EBITDA
EV/Ton (US$)
Dividend Yield (%)
Return Ratios (%)
RoE
RoCE
Working Capital Ratios
Asset Turnover (x)
Inventory (Days)
Debtor (Days)
Leverage Ratio (x)
Current Ratio
Debt/Equity
* Adjusted for treasury stocks
2010
15
23
65
2.0
13.5
2011
9
18
73
2.5
28.4
2012
16
27
86
2.5
15.5
2013E
20
33
103
2.5
12.7
2014E
26
40
126
3.0
11.7
2015E
33
48
156
3.5
10.6
14.4
8.7
2.7
2.4
8.4
134
1.1
11.8
7.1
2.3
1.9
6.8
106
1.1
9.1
5.8
1.8
1.6
5.3
98
1.3
7.0
4.8
1.5
1.2
3.9
84
1.5
25.1
17.4
12.8
10.1
20.3
15.4
20.8
18.2
22.4
21.0
23.5
24.8
0.6
53.8
18
0.5
55.0
22
0.6
55.4
21
0.7
54.9
21
0.8
54.9
21
0.8
54.9
21
2.1
1.6
1.9
1.6
1.8
1.3
1.7
1.1
2.0
0.8
2.3
0.5
Cash Flow Statement
Y/E March
Oper. Profit/(Loss) before Tax
Interest/Dividends Recd.
Depreciation
Direct Taxes Paid
(Inc)/Dec in WC
CF from Operations
EO expense
CF from Operating incl EO
(inc)/dec in FA
(Pur)/Sale of Investments
CF from investments
Issue of Shares
(Inc)/Dec in Debt
Interest Paid
Dividend Paid
CF from Fin. Activity
Inc/Dec of Cash
Add: Beginning Balance
Closing Balance
2010
6,615
205
1,961
-816
-1,190
6,775
-4
6,771
-5,759
-1
-5,760
-80
1,031
-1,515
-477
-1,042
-30
386
356
2011
3,973
399
2,208
-824
850
6,606
-21
6,585
-5,273
-1,785
-7,058
265
2,247
-1,399
-595
517
44
356
400
2012
6,649
517
2,539
-1,121
155
8,739
-166
8,573
-5,419
8
-5,411
-93
-808
-1,592
-595
-3,087
75
400
475
2013E
8,449
555
3,115
-1,700
-418
10,001
0
10,002
-6,000
0
-6,000
0
-500
-2,065
-595
-3,160
842
475
1,317
(INR Million)
2014E
10,251
806
3,447
-2,260
-116
12,127
0
12,127
-3,000
0
-3,000
0
-2,500
-2,016
-714
-5,230
3,897
1,316
5,214
2015E
12,493
1,087
3,569
-2,919
-392
13,838
0
13,838
-1,000
0
-1,000
0
-5,500
-1,903
-833
-8,236
4,602
5,214
9,815
99
January 2013

Initiating Coverage | Sector: Cement
Orient Paper Industries
BSE SENSEX
S&P CNX
19,987
6,057
5
6
CMP: INR79
TP: INR115
Buy
5-S framework
5-S score, Rank
66
Valuation score, Rank 79
Demerger of cement business to unlock value
SOTP-based target price of INR115 implies 45% upside; Buy
Target price & upside
Base case
Blue Sky
INR115
INR254
45%
221%
Stock Info
Bloomberg
Equity Shares (m)
52-Week Range (INR)
1,6,12 Rel. Perf. (%)
M.Cap. (INR b) / (USD b)
OPI IN
204.9
102/48
-9/10/32
16/0.3
Orient Paper Industries (OPI) is poised for meaningful value unlocking through the
ongoing demerger of the cement business into Orient Cement.
Though its paper business is loss-making, we expect steady product diversification to
propel robust growth in its electrical goods business.
We expect OPI's cement business to witness 11% volume CAGR and 19%/28% revenue/
EBITDA CAGR over FY13-15.
We initiate coverage with Buy; our SOTP-based target price of INR115 implies 45%
upside.
Cost leadership in cement eclipsed by rise in energy cost
OPI is one of the lowest cost cement manufacturers in India. Its cost of production
is ~15% lower than peers (INR2,538/ton v/s INR2,959/ton for our Cement Universe
in FY12), enabling it to achieve superior profitability (EBITDA/ton of INR1,092 v/
s INR850 for our Cement Universe in FY12). We expect a dilution in OPI’s historical
energy cost advantage impacted by shrinkage in linkage coal from Singareni Mines
(65% of its coal requirement). We model 15% CAGR in cement EBITDA/ton over
FY13-15 to INR1,007 in FY15 despite (a) elevated cost structure, and (b) volatile
prices in Andhra Pradesh (~24% of dispatches). Revival of demand in the core
market and commencement of 3mtpa greenfield capacity in Karnataka by early
FY15 would drive volume growth. We expect OPI’s cement business to witness
11% volume CAGR and 19%/28% revenue/EBITDA CAGR over FY13-15.
Valuation summary (INR b)
Y/E March
2013E 2014E 2015E
Sales
28.1 33.6 40.3
EBITDA
2.4
4.2
5.5
NP
1.2
2.2
2.6
Adj EPS (INR) 6.0 10.6 12.7
EPS Gr. (%)
-41.7 75.8 19.2
BV/Sh. (INR) 58.3 66.0 75.5
RoE (%)
10.7 17.1 17.9
RoCE (%)
12.6 18.3 17.4
Payout (%)
38.5 27.3 25.2
Valuations
P/E (x)
13.1
7.5
6.2
P/BV (x)
1.4
1.2
1.0
EV/EBITDA (x) 8.4
4.3
5.7
EV/Ton (USD)
52
29
43
Steady product diversification to propel robust growth in electrical goods
OPI has posted healthy growth in the electrical goods segment (28% revenue
CAGR over FY09-12 and 22% YoY in 1HFY13) on the back of strong outlook for CFLs
and luminaires (growing at 20%+ per annum), and its superior brand recall. We
expect the trend to continue (model 23% revenue CAGR over FY13-15), as the
company has recently diversified into higher margin home appliances, which are
likely to witness robust growth from FY14. Nonetheless, we expect segment
EBIDT margins to remain under pressure (8.5-9.5% over FY13-15 v/s 10%+ pre-
FY11) owing to higher cost of raw material such as copper, zinc and aluminum,
increasing fuel prices and higher marketing expenses for new product categories.
Shareholding pattern (%)
As on
Sep-12
Promoter
90.0
Dom. Inst
1.8
Foreign
5.5
Others
2.7
Jun-12 Sep-11
90.0
90.0
1.7
1.6
5.6
6.4
2.7
2.1
Stock performance (1 year)
Paper business unlikely to break even in near term
Despite steady sales growth (revenue CAGR of 15.6% over FY09-12), we expect
OPI’s paper business to continue witnessing losses in the near term owing to (1)
declining realization, and (2) unprecedented escalation in pulp and coal prices.
However, its recently added (a) water reservoir, and (b) 55MW CPP at Amlai are
likely to resolve certain operational bottlenecks and enable cost savings
(INR300m-350m savings at stabilization), helping to reduce EBITDA loss.
January 2013
100

Orient Paper Industries
De-merger to trigger value unlocking; initiate with Buy
Impending demerger and subsequent listing of the cement business is a key near-
term value unlocking trigger. We expect the de-merged cement business to witness
re-rating owing to its superior cost efficiency and greater efficiency in capital
allocation. OPI trades at 5.5x FY14E EBITDA (implied EV of USD53/ton and 3.3x FY14E
EBITDA for cement business). Our SOTP valuation stands at INR115/share: (1) cement
(5x FY15E EBITDA), (2) electrical goods (6x FY15E EBITDA), and (3) paper (1x FY15E
sales). We initiate coverage with a
Buy
rating; our target price implies 45% upside.
About Orient Paper
Orient Paper Industries (OPI) is part of the CK Birla Group company and is engaged in
diversified businesses including cement, paper and electrical goods.
It has cement capacity of 5mtpa in Andhra Pradesh and Maharashtra, along with captive
power plants of 50MW. It has the largest tissue paper capacity in India and enjoys strong
brand recall in the electrical goods (fans and lighting) business.
OPI is poised for meaningful value unlocking through the ongoing demerger of the
cement business into Orient Cement, which is expected to conclude in 2HFY13.
Blue Sky Scenario
Orient Paper
Orient Paper has the potential to be a 3-bagger in 2-3 years, driven by:
Demerger of cement business (by March 2013).
Scale-up of cement business to 8mtpa amidst the cement upcycle (by 2HFY15).
Ramp-up in Electrical business, driven by continued strong growth in Fans and
CFL business, and scale-up in nascent (started in 2HFY12) Home Appliances
business (by FY15-16).
Potential hive-off of Paper business to focus on Cement and Electrical Appliances.
OPI: Blue Sky Scenario (FY15)
Cement
Electrical
Parameter
EV/Ton (USD)
PE
Multiple
100
20
INR m Catalyst
43,676 Scale-up of capacity to 8mt during cement
upcycle
14,990 Scale-up in home appliance business,
with continous strong growth in fans and
CFL business
8,182 Hive-off of Paper business at 40% discount
to AP Paper-International Paper deal
valuations of 2.65x EV/Sales
66,848
14,856
51,992
254
221
Paper
EV/Sales
1.6
Total EV
Less: Net Debt
Equity Value
Equity Value (INR/sh)
Upside (%)
OPI: 5-S Analysis
5-S Score
1. Size & scalability [30]
2. Sales Mix [20]
3. Supply chain efficiencies [20]
4. Strategic & Other issues [10]
5. Strength of financials [20]
5-S Score
Valuation Score
January 2013
22
15
12
8
9
66
79
Rank
5
5
2
5
8
5
6
Average
21
15
11
7
11
65
76
101

Orient Paper Industries
5-S Analysis [Score 66 / 100] & [Rank 5]
Size & Scalability [22 / 30]
Existing cement capacity of 5mtpa across two plants
in Maharashtra (2mtpa) and Andhra Pradesh (3mtpa)
along with 50MW of captive power plant (CPP)
capacity.
Ongoing expansion to add 3mtpa in Karnataka (capex
of INR16b) by end-FY14/early-FY15.
Operating at higher than industry average utilization
- 76% v/s 65% for peers in South India.
Expect volume CAGR of 11% over FY13-15 (v/s 11.5%
over FY10-12 and 16% YoY in 1HFY13).
Strategic & Other Issues [8 / 10]
Besides cement, OPI is exposed to (a) electrical
goods (~30% of FY12 revenue), and (b) paper (~14%
of FY12 revenue).
Its electrical goods business has historically posted
above average RoCE (25-35%). However, sustained
EBITDA loss in its paper business remains a drag on
overall capital efficiency (-16% RoCE in FY12).
OPI awaits final approval for the demerger of its
cement business into Orient Cement.
We expect this to aid value unlocking, better capital
efficiency and re-rating for the cement business.
Sales Mix [15 / 20]
Maharashtra (65%) and Andhra Pradesh (24%)
account for ~90% of its dispatches. Lower utilization
in core markets may induce pricing volatility.
Has historically posted 10-15% lower realizations
than peers (MC, ICEM and DBEL).
Expected price recovery in Andhra Pradesh from
4QFY13 should improve realizations.
We factor in comparatively lower YoY uptick in
realizations (INR15/INR12 per bag in FY14/15),
implying 7% CAGR over FY13-15.
Strength of Financials [9 / 20]
Owing to cost leadership, OPI commands superior
EBITDA/ton in cement (INR1,092 in FY12 v/s INR894
for MOSL Cement Universe).
We expect profitability to decline 30% YoY to
INR893/ton in FY13 due to elevated cost structure,
before posting 153% CAGR over FY13-15.
Cost saving measures in non-cement businesses
(new CPP, water reservoir, etc) are likely to render
resilience. We expect overall revenue /EBITDA/PAT
to witness 20%/51%/45% CAGR over FY13-15.
Ongoing capex towards Karnataka plant to augment
net debt to INR15.7b by FY15
Supply Chain Efficiencies [12 / 20]
Valuation & View [79 / 100]
OPI trades at 5.7x FY15E EBITDA. Cement business
implied valuations are EV of USD43/ton (v/s USD64/
ton for our Mid Cap Cement Universe and USD111/
ton for our entire Cement Universe) and 3.6x FY15E
EBITDA (v/s 3.9x FY15E EBITDA for our Mid Cap
Cement Universe and 5.9x FY15E EBITDA for our
entire Cement Universe).
Our SOTP valuation stands at INR115/share: (1)
cement (5x FY15E EBITDA), (2) electrical goods (6x
FY15E EBITDA), and (3) paper (1x FY15E sales).
Cement, electrical goods and paper respectively
account for 68%, 18% and 13% of the SOTP value.
We initiate coverage with a Buy rating; our target
price implies 45% upside. Blue-sky scenario analysis
indicates fair value of ~INR254.
102
Lowest cost cement manufacturer, with total cost
of production 15-20% lower than our Cement
Universe (INR2,538/ton in FY12).
Cost advantage emerges from energy cost efficiency
due to higher proportion of (60-65%) low cost
linkage coal from Singareni Mines, and power and
fuel consumption efficiency.
Increasing possibility of shrinkage in linkage coal
supply would reduce cost advantage, going ahead.
However, stabilization of 50MW CPP (meet 60% of
power requirement) may aid some cost savings.
We model in ~10% CAGR in energy cost and 5% CAGR
in total cost per ton over FY13-15.
January 2013

Orient Paper Industries
Size & Scalability: Strong dispatch growth to continue
OPI is operating at higher
than industry average
utilization of 76% (v/s 65%
in South India)
Superior dispatch growth to continue on the back of market recovery
Cement accounts for ~56% of OPI’s revenue and 90%+ of EBITDA. It has 5mtpa of
cement capacity at Devapur, Andhra Pradesh (3mtpa) and Jalgaon, Maharashtra
(2mtpa), along with 50MW of captive power plant (CPP) capacity. It sells cement
under two brands,
Orient Gold
and
Birla A1 Premium.
The company is in the process of
adding 3mtpa capacity (clinker capacity of 2mtpa) at Gulburga, Karnataka (total capex
of INR16b) by FY15. Currently, OPI is operating at higher than industry average utilization
of 76% (v/s 65% in South India), despite severe underperformance in its key Andhra
Pradesh market. It has posted superior dispatch growth of 11.5% CAGR over FY10-12
and we expect the trend to continue, led by demand recovery in Andhra Pradesh and
Maharashtra, and upcoming greenfield capacity in Karnataka (by FY15). We model in
volume CAGR of 11% over FY13-15 (v/s 9.5% for our Cement Universe).
Expect OPI to continue witnessing steady volume growth over FY12-15
Source: Company, MOSL
Sales Mix: Historically lower realization than market peers
Market Mix is skewed
towards west - aiding
resilience to better
volume growth
Market mix unfavorable in recent past
Our channel checks suggest that OPI’s key markets, Maharashtra (65%) and Andhra
Pradesh (24%), which account for ~90% of its dispatches, are plagued with overcapacity
and muted demand recovery. Political turmoil has impacted cement demand in Andhra
Pradesh – de-growth of 9%/5% in FY12/YTDFY13. However, OPI has posted encouraging
dispatch growth of ~16% YoY in 1HFY13, which strengthens near-term volume growth
outlook. We believe recovery in demand in the South and the West from 4QFY13
would be a key upside for OPI.
Realizations lower than southern peers
Historically, OPI’s realizations have been 10-15% lower than its major regional peers
(MC, ICEM and DBEL). While the significant correction in cement prices in Andhra
Pradesh (INR65-70/bag) resulted in a QoQ decline of ~INR14/bag in OPI’s realizations
in 2QFY13, expected recovery from 3QFY13 should improve its blended realizations.
Nonetheless, cement prices in the southern market are likely to remain volatile in
the near-term on the back of subdued utilization (~65% over FY13-14). We expect
realizations to increase by INR2/bag in FY13 and by INR15/INR12 per bag in FY14/FY15
(7.2% CAGR over FY13-15).
January 2013
103

Orient Paper Industries
Maharashtra and Andhra Pradesh account for ~90% of OCI’s volumes
Source: Company, MOSL
Supply Chain Efficiencies: Cost leadership owing to linkage coal advantage
Higher proportion of
linkage coal renders cost
leadership and superior
profitability despite
lower realization
Energy cost advantage enables cost leadership…
OPI is one of the lowest cost cement manufacturers in India. Its cost of production is
~15% lower than peers (INR2,538/ton v/s INR2,959/ton for our Cement Universe in
FY12), enabling it to achieve superior profitability (EBITDA/ton of INR1,092 v/s INR850
for our Cement Universe in FY12). Its cost advantage largely emerges from the edge
that it enjoys in energy cost efficiency. OPI is one of the few cement companies
enjoying the advantage of high proportion of low cost linkage coal, which it receives
primarily from Sigareni Coal Mines. Linkage coal accounts for 60-65% of its fuel mix as
compared to 30-60% for some of the energy efficient players. This not only shields
OPI against the energy price volatility in the Andhra Pradesh market, but also positions
it as the lowest energy cost player in our Cement Universe (INR784/ton in FY12; ~20%
discount to MOSL Cement Universe). OPI has also maintained efficiency in power and
fuel consumption. It has reduced power consumption to 78kwh/ton from 81kwh/ton
in FY11, and has maintained coal usage as a percentage of cement production at 14%
v/s 12-16% for peers.
Fuel mix skewed towards linkage coal
Proportion of linkage coal highest among peers
Source: Company, MOSL
January 2013
104

Orient Paper Industries
Low cost linkage coal availability key to energy cost advantage; makes OPI cost leader (INR/ton)
Source: Company, MOSL
Linakage coal availability
issue may dilute cost
advantage here on
…but eclipsed by deterioration in linkage coal availability
Lately, availability of linkage coal from Singareni Coal Mines has been constrained.
This has increased OPI’s reliance on high cost imported coal and open market coal
purchases, in turn leading to an escalation in its energy cost by 20-25% YoY in 1HFY13
to INR942/ton. We believe availability of linkage coal would shrink and at expanded
capacity, the proportion of linkage coal would be even lower, elevating its overall
production cost. However, stabilization of the 50MW CPP in Andhra Pradesh should
trigger some cost savings, as its generation cost is INR1.5/unit lower than the price it
has to pay for power purchases. At full capacity, the CPP would be able to meet ~60%
of its power requirement. We model ~10% CAGR in energy cost over FY13-15.
Expect dilution in OPI’s energy cost advantage, leading to ~8% CAGR in total cost over FY12-15
Source: Company, MOSL
Expect moderate escalation in freight cost
OPI’s fright mix is skewed towards road transport, which accounts for ~75% of its
volumes. In 1HFY13, its freight cost posted increase of 7.8% YoY on account of (a)
increase in rail freight (by ~22%), (b) INR5/liter hike (up ~12%) in diesel prices, and (c)
jump in lead distance due to higher dispatches outside Andhra Pradesh. We model
7.5% CAGR in freight cost over FY13-15.
OPI’s recently commissioned 12ktpa artificial gypsum plant would offer uninterrupted
supply, though we do not expect any major cost savings.
January 2013
105

Orient Paper Industries
Strategic & Other Issues: Electrical division steady, paper remains a drag
Diversification aimed at de-risking business model
Besides cement, OPI has (a) electrical goods business (~30% of FY12 revenue), and (b)
paper business (~14% of FY12 revenue). The electrical goods division (15% capital
allocation) has historically posted above average RoCE (25-35%). However, the paper
division (26% capital allocation) has been making losses at the EBITDA level since
FY10 and remains a drag on overall capital efficiency (RoCE of -16% in FY12).
Capital allocation across segments (%)
Paper business a drag on overall RoCE (%)
Source: Company, MOSL
Robust growth trend to
continue in electrical
segment with strong
outlook in CFLs and
recent diversification
into home electrical
appliances
Electrical goods business to continue witnessing robust growth
OPI has established strong brand equity and is a leading player in the fans business
(under the brand,
Orient PSPO),
with an annual capacity of 8m units. In the lighting
division, it enjoys 4.2% market share and has entered into CFLs and several new SKUs
over the past few years. The segment has consistently augmented its revenue
contribution from 23% in FY09 to 30% in FY12. OPIL has posted 23%/39% volume CAGR
over FY09-12 in fans/CFLs, leading to 28% revenue CAGR over FY09-12 and 22% YoY
growth in 1HFY13. We expect the robust growth trend to continue on the back of (a)
strong outlook in CFLs and luminaires (20-22% industry growth), and (b) recent
diversification into home electrical appliances. We model 23% revenue CAGR over
FY12-15. Nonetheless, the segment EBIDT margin will remain under pressure (8.5-
9.5% over FY13-15 v/s 10%+ pre-FY11) owing to higher cost of raw materials such as
copper, zinc and aluminum, increasing fuel prices, and higher marketing expenses.
Electrical goods division to post 22% revenue CAGR amidst near-term margin pressure
Source: Company, MOSL
January 2013
106

Orient Paper Industries
Potential cost saving
triggers are expected to
lower EBITDA loss here on
Paper business unlikely to break even in near future
OPI’s paper division has an installed capacity of 186ktpa (tissue paper: 25ktpa; writing
paper: the balance 161ktpa), with two paper manufacturing plants at Amlai in Madhya
Pradesh and Brajrajnagar in Orissa. While operations at the Brajrajnagar plant (capacity:
76ktpa) have been suspended since 1999, the Amlai plant (capacity: 110ktpa) is
running. OPI sells paper under the brands,
Orient
and
Peacock.
Despite steady sales
growth (15-20% over FY11-12), we expect OPI’s paper business to continue witnessing
losses in the near term owing to (1) declining realizations, and (2) escalation in prices
of pulp and coal. However, its recently added (a) 250m gallon water reservoir (to
address water shortage problem – can sustain till 50 days), and (b) 55MW CPP at Amlai
(to address power requirements of the paper business) are likely to resolve some
operational bottlenecks. The resultant cost savings (INR300m-350m at stabilization)
would help reduce EBITDA loss. The said plant will also be left with ~15MW of surplus
power for expansion or monetization.
Paper segment to post steady revenue growth but unlikely to break even in near future
Source: Company, MOSL
Demerger to aid value unlocking
OPI’s Board has approved the proposal to demerge the cement business into Orient
Cement. The shareholders will get one new equity share of Orient Cement for each
share held in OPI. The demerger process is currently at an advanced stage; final
approval from Orissa High Court is expected in 2-3 months. Demerger and subsequent
listing of Orient Cement will create a focused cement play. We expect this to aid
meaningful value unlocking, improve capital efficiency and lead to re-rating.
Shareholding – before and after impending demerger
January 2013
Source: Company
107

Orient Paper Industries
Strength of Financials: Expect 51% EBITDA CAGR
With dilution of energy
cost advantage, EBITDA/
ton to decline 30% to
INR759 in FY13, before
posting a 15% CAGR
over FY13-15
Dilution of cost leadership to impact cement profitability over FY13-15
Though OPI’s cement realizations have been lower than regional peers, its cost
leadership enabled it to enjoy superior profitability. However, given the subdued
price growth due to unfavorable market-mix and dilution of its energy cost advantage,
we expect OPI’s EBITDA/ton to decline 30% to INR759 in FY13, before posting a 15%
CAGR over FY13-15. This would imply deterioration in EBITDA margin of the cement
business from 30% in FY12 to ~23.5% over FY13-15.
Strong realizations and operating efficiencies had helped OPI to maintain superior profitability
Source: Company, MOSL
Expect 51% EBITDA CAGR amidst margin expansion in non-cement businesses
Though cost structure in the cement business is likely to deteriorate over FY12-15,
cost saving measures in non-cement businesses (CPP, water reservoir, etc) would
render resilience. We estimate OPI’s overall revenue/EBITDA to witness 20%/51%
CAGR over FY13-15. EBITDA margin would expand 5.1pp over FY13-15, after declining
6.6pp over FY12-13. PAT is likely to register 45% CAGR over FY13-15 despite higher
depreciation and interest.
Expect revenue CAGR of 18.6% over FY12-15
Expect EBITDA margin expansion post FY13
Source: Company, MOSL
January 2013
108

Orient Paper Industries
High cost structure to impact capital efficiency moderately
PAT to post 45% CAGR over FY13-15
Source: Company, MOSL
Leverage to increase on the back of ongoing expansion
OPI has already acquired land for its planned 3mtpa greenfield cement capacity (clinker
capacity of 2mtpa) at Gulburga, Karnataka. The project requires ~INR16b of capex and
is likely to be completed by early-FY15. OPI expects to receive MoEF approval soon,
post which it will start ordering plant and machinery, and start construction work,
which should take 2.5 years thereon. The capex would be funded by mix of debt and
internal accruals, which is expected to augment net debt to INR14.8b by FY15 as against
INR3.8b in FY12.
Despite steady uptick in OCF, FCF negative on the back of ~INR16b capex over FY13-15
Net debt to witness sharp upswing owing to negative FCF
Healthy dividend payout (%)
Source: Company, MOSL
January 2013
109

Orient Paper Industries
Valuation & View
Trading at discount, despite superior profitability
Impending demerger and subsequent listing of the cement business is a key near-
term value unlocking trigger. We expect the de-merged cement business to witness
re-rating owing to its superior cost efficiency and greater efficiency in capital
allocation. OPI trades at 6.2x FY15 PE and 5.7x FY15E EBITDA. This implies an EV of
USD43/ton (v/s USD64/ton for our Mid Cap Cement Universe and USD111/ton for our
Full Cement Universe) and 3.6x FY15E EBITDA (v/s 3.9x FY15E EBITDA for our Mid Cap
Cement Universe and 5.9x FY15E EBITDA for our Full Cement Universe) for the cement
business.
Implied valuation of pure cement at discount despite operational efficiencies
FY13E
Market Cap (INR m)
Net Debt (NR m)
EV
EV of other businesses
Implied EV of Cement business
Implied EV/Ton
Implied EV/EBITDA
16,259
4,043
20,302
6,030
14,272
52
4.5
FY14E
16,259
1,467
17,725
9,861
7,864
29
1.9
FY15E
16,259
14,939
31,198
12,280
18,917
43
3.6
Source: Company, MOSL
Our target price implies 45% upside
Our SOTP valuation stands at INR115/share: (1) cement (5x FY15E EBITDA), (2) electrical
goods (6x FY15E EBITDA), and (3) paper (1x FY15E Sales). We initiate coverage with a
Buy
rating; our target price implies 50% upside.
Orient Papers: SOTP valuation
Parameter
Cement
Paper
Electrical
Total EV
Less: Net Debt
Equity Value
Fair Value (INR/Share)
Upside (%)
CEMENT Implied EV/Ton @ TP
EV/EBITDA
EV/Sales
EV/EBITDA
Multiple
5
1
6
FY13E
15,931
3,785
2,245
21,961
3,953
18,008
88
10.8
58
FY14E
20,959
4,352
5,509
30,820
1,376
29,443
144
81.1
FY15E
26,033
5,114
7,166
38,313
14,849
23,465
115
44.3
76
59
Source: Company, MOSL
January 2013
110

Orient Paper Industries
Financials and Valuation
Income Statement
Y/E March
Net Sales
Change (%)
Total Expenditure
% of Sales
EBITDA
Margin (%)
Depreciation
EBIT
Int. and Finance Charges
Other Income - Rec.
PBT bef. EO Exp.
PBT after EO Exp.
Current Tax
Deferred Tax
Tax Rate (%)
Reported PAT
PAT Adj for EO items
Change (%)
Margin (%)
2010
16,198
7.8
13,124
81.0
3,074
19.0
550
2,523
345
163
2,341
2,341
147
601
32.0
1,593
1,593
-31.2
9.8
2011
19,279
19.0
16,617
86.2
2,662
13.8
815
1,848
440
687
2,095
2,095
413
251
31.7
1,431
1,431
-10.2
7.4
2012
24,334
26.2
20,639
84.8
3,695
15.2
884
2,811
423
796
3,183
3,183
952
109
33.3
2,123
2,123
48.3
8.7
2013E
28,080
15.4
25,667
91.4
2,413
8.6
964
1,449
383
739
1,805
1,805
541
25
31.4
1,238
1,238
-41.7
4.4
(INR Million)
2014E
33,586
19.6
29,433
87.6
4,153
12.4
1,131
3,022
676
854
3,201
3,201
960
64
32.0
2,177
2,177
75.8
6.5
2015E
40,330
20.1
34,816
86.3
5,514
13.7
1,653
3,861
1,042
997
3,816
3,816
1,145
76
32.0
2,595
2,595
19.2
6.4
Balance Sheet
Y/E March
Equity Share Capital
Total Reserves
Net Worth
Deferred Liabilities
Total Loans
Capital Employed
Gross Block
Less: Accum. Deprn.
Net Fixed Assets
Capital WIP
Total Investments
Curr. Assets, Loans&Adv.
Inventory
Account Receivables
Cash and Bank Balance
Loans and Advances
Curr. Liability & Prov.
Account Payables
Provisions
Net Current Assets
2010
203
7,564
7,767
1,313
5,162
14,243
16,365
5,206
11,159
568
471
4,987
1,503
1,844
467
1,173
3,153
2,346
807
1,834
2011
203
8,823
9,026
1,354
4,891
15,271
17,919
5,964
11,956
273
663
6,418
1,642
2,397
588
1,790
4,076
3,393
683
2,342
2012
205
10,981
11,186
1,462
5,096
17,744
19,126
6,806
12,319
1,735
875
7,308
1,964
3,470
515
1,359
4,558
3,930
628
2,750
17,744
2013E
205
11,743
11,948
1,488
6,446
19,882
22,060
7,771
14,290
1,500
875
7,666
2,156
3,851
119
1,540
4,515
4,082
433
3,151
19,882
(INR Million)
2014E
205
13,324
13,529
1,552
10,446
25,527
22,560
8,902
13,659
8,000
875
8,578
2,579
4,145
195
1,658
5,651
4,882
768
2,928
25,527
2015E
205
15,259
15,464
1,628
16,646
33,738
39,810
10,554
29,256
750
875
9,568
3,097
4,646
166
1,659
6,777
5,863
914
2,792
33,738
Appl. of Funds
14,243
15,271
E: MOSL Estimates; * Adjusted for treasury stocks
January 2013
111

Orient Paper Industries
Financials and Valuation
Ratios
Y/E March
Basic (INR) *
Consol EPS
Cash EPS
BV/Share
DPS
Payout (%)
Valuation (x)
P/E
Cash P/E
P/BV
EV/Sales
EV/EBITDA
EV/Ton (USD)
Dividend Yield (%)
Return Ratios (%)
RoE
RoCE
Working Capital Ratios
Asset Turnover (x)
Inventory (Days)
Debtor (Days)
Creditor (Days)
Working Capital Turnover (Days)
Leverage Ratio (x)
Debt/Equity
* Adjusted for treasury stocks
2010
8
11
38
1.5
21.2
2011
7
11
44
1.5
23.5
2012
10
15
55
2.0
21.8
2013E
6
11
58
2.0
38.5
2014E
11
16
66
2.5
27.3
2015E
13
21
75
2.8
25.2
7.7
5.4
1.5
0.8
5.0
42
2.5
13.1
7.4
1.4
0.7
8.4
52
2.5
7.5
4.9
1.2
0.5
4.3
29
3.2
6.3
3.8
1.1
0.8
5.7
43
3.5
22.3
22.3
17.0
18.9
21.0
23.9
10.7
12.6
17.1
18.3
17.9
17.4
1.1
33.9
38
53
31
1.3
31.1
41
64
33
1.4
29.5
47
59
34
1.4
28.0
50
53
39
1.3
28.0
45
53
30
1.2
28.0
42
53
24
0.7
0.5
0.5
0.5
0.8
1.1
Cash Flow Statement
Y/E March
Oper. Profit/(Loss) before Tax
Interest/Dividends Recd.
Depreciation
Direct Taxes Paid
(Inc)/Dec in WC
CF from Operations
CF from Operating incl EO
(inc)/dec in FA
(Pur)/Sale of Investments
CF from investments
Issue of Shares
(Inc)/Dec in Debt
Interest Paid
Dividend Paid
CF from Fin. Activity
Inc/Dec of Cash
Add: Beginning Balance
Closing Balance
2010
2,523
163
550
-147
557
2,533
2,533
-1,845
-379
-2,224
-17
503
-345
-338
-198
111
333
444
2011
1,848
687
815
-413
387
2,550
2,550
-1,316
-192
-1,508
165
-271
-440
-337
-883
159
467
626
2012
2,811
796
884
-952
481
3,058
3,058
-2,710
-211
-2,921
499
205
-423
-463
-181
-45
588
544
2013E
1,449
739
964
-541
798
1,813
1,813
-2,700
0
-2,700
0
1,350
-383
-476
491
-396
515
119
(INR Million)
2014E
3,022
854
1,131
-960
-300
4,348
4,348
-7,000
0
-7,000
0
4,000
-676
-595
2,729
77
119
195
2015E
3,861
997
1,653
-1,142
-107
5,475
5,475
-10,000
0
-10,000
0
6,200
-1,050
-655
4,495
-30
195
166
112
January 2013

Initiating Coverage | Sector: Cement
Prism Cement
BSE SENSEX
S&P CNX
19,987
6,057
CMP: INR49
TP: INR57
Neutral
5-S framework
5-S score, Rank
54
Valuation score, Rank 53
9
8
Volume and profitability recovery, as operations normalize
Capital allocation to non-cement businesses key risk; initiate with Neutral
Target price & upside
Base case
Blue Sky
INR57
INR101
18%
109%
Stock Info
Bloomberg
Equity Shares (m)
52-Week Range (INR)
1,6,12 Rel. Perf. (%)
M.Cap. (INR b) / (USD b)
PRSC IN
503.4
60/39
-12/-22/-3
24/0.4
Prism Cement (PRSC) is likely to post strong volume CAGR of 12% over FY13-15 v/s
9.5% for our Cement Universe, driven by replacement of damaged kiln by FY13 end.
Cement profitability has declined sharply over FY11-12, but we expect cost saving
triggers to kick in from late-FY14 and drive up profitability.
We expect PRSC to post 18% revenue CAGR and 59% EBITDA CAGR over FY13-15,
implying margin expansion of ~5.1pp from FY13.
Our SOTP-based target price of INR57 implies very little upside. Moreover, its diversified
business carries the risk of inefficient allocation of capital. Neutral.
Resolution of silo breakdown to drive 12% volume CAGR
While PRSC has posted strong volume CAGR of 34% over FY10-12, led by
brownfield capacity addition in unit II of its Satna plant, we believe the major
volume thrust is already behind. There was a blip in its cement production in
1QFY13, as the blending silo in clinker unit II was damaged. Going forward, volume
growth hinges on the replacement of the silo which is expected to be resolved
by 4QFY13. We have modeled volume growth of 12% CAGR over FY13-15 for PRSC
v/s 9.5% for our Cement Universe due to lack of visibility on further capacity
expansion till FY15.
Valuation summary (INR b)
Y/E March
2013E 2014E 2015E
Sales
49.7 58.9 68.9
EBITDA
3.1
6.2
7.8
NP
0.0
2.1
3.3
Adj EPS (INR) -0.1
4.2
6.5
EPS Gr. (%)
-88.0-6,311.8 55.0
BV/Sh. (INR) 22.2 25.2 29.9
RoE (%)
-0.3 17.6 23.5
RoCE (%)
7.3 19.3 23.6
Payout (%)
NA 27.9 27.0
Valuations
P/E (x)
-724.4 11.7
7.5
P/BV (x)
2.2
1.9
1.6
EV/EBITDA (x) 12.1
5.9
4.6
EV/Ton (USD) 99.9 77.0 64.3
Cost saving triggers to kick in from FY14, drive profitability
PRSC's cement profitability has declined sharply over FY11-12 on account of (a)
subdued realization growth, (b) higher variable cost due to silo damage, (c)
sustained cost pressure, and (d) lower capacity utilization. However, we model
healthy recovery, with ~55% CAGR in EBITDA/ton over FY13-15 to INR853, led by
multiple cost saving triggers such as (1) replacement of the blending silo by the
end of FY13, (2) commencement of captive coal mine (annual savings of ~INR1b;
not factored in our estimates), and (3) encouraging uptick in realizations on the
back of favorable market mix. We expect most of the cost saving triggers to kick
in from FY14.
Shareholding pattern (%)
As on
Sep-12
Promoter
74.9
Dom. Inst
3.4
Foreign
1.3
Others
20.5
Jun-12 Sep-11
74.9
74.9
3.2
1.4
1.7
5.4
20.3
18.3
Expect steady operations in RMC; TBK margins to improve
PRSC is India's third-largest RMC player and we expect it to continue growing
steadily (at 15-20%) in this segment, with stable margins. In the TBK business,
we expect margin expansion, led by greater focus on value-added products and
cost savings driven by to switch towards low cost fuel mix. Its 4.8mtpa greenfield
expansion plan in Andhra Pradesh is still under initial evaluation and is unlikely
to commence before FY16. PRSC has generated free cash flow of INR1.1b in FY12
(v/s negative INR2.2b in FY11) on the back of steady uptick in operating cash flow
and moderating capex. We expect the trend to continue, going forward, leading
to decline in net debt to ~INR12b (net debt-equity of 0.8x) by FY15.
Stock performance (1 year)
January 2013
113

Prism Cement
Initiating coverage with Neutral rating
We expect PRSC to post 18% revenue CAGR and 59% EBITDA CAGR over FY13-15,
implying margin expansion of ~5.1pp from FY13. Our SOTP valuation is INR57/share,
which implies an EV of USD80/ton. We initiate coverage with a
Neutral
rating.
Moreover, its diversified business carries the risk of inefficient allocation of capital.
About Prism Cement
Prism Cement (PRSC), a Rajan Raheja group entity, is an integrated building material
company with presence in cement, ready-mix-concrete (RMC), and tiles and bathroom
& kitchen products (TBK). It merged its RMC and TBK businesses with its cement business
in April 2009.
Its cement business has a capacity of 5.6mtpa, with dispatch mix skewed towards central
India.
PRSC also has 74% stake in Raheja QBE General Insurance Company, a JV with QBE Group
of Australia.
Blue Sky Scenario
Prism Cement
Prism Cement has the potential to deliver ~86% returns over the next two years,
driven by:
Savings of INR1b from captive coal block, expected from 2HFY14, which is not
factored in our base assumptions.
Coal gasification at Andhra Pradesh plant and availability of LNG at Karnataka
(in 6-9 month) driving cost savings, which are yet to be factored in.
PRSC: Blue Sky Scenario (FY15)
Cement
EV/EBITDA 5x
(INR m)
32263
Remarks
To be driven by savings of INR1b from
captive coal block, which is not factored in
our base assumptions
Factoring in for EBITDA margin
improvement to 15% driven by change in
fuel mix
RMC
TBK
EV/EBITDA 6x
EV/EBITDA 6.5x
4,232
22679
Raheja QBE
At BV
Norcros
At BV
Total EV
Less: Net debt
Equity Value
Value/share (INR)
Upside (%)
Implied Cement EV/Ton (USD)
1,224
1,064
61,463
10,386
51,076
101
109
101
PRSC: 5-S Analysis
5-S Score
1. Size & scalability [30]
2. Sales Mix [20]
3. Supply chain efficiencies [20]
4. Strategic & Other issues [10]
5. Strength of financials [20]
5-S Score
Valuation Score
January 2013
12
17
10
3
12
54
53
Rank
9
2
5
8
3
9
8
Average
21
15
11
7
11
65
76
114

Prism Cement
5-S Analysis [Score 54 / 100] & [Rank 9]
Size & Scalability [12 / 30]
Strategic & Other Issues [3 / 10]
Non-cement segments (RMC, TBK) accounted for
60%/57% of revenue/EBITDA in FY12.
While non-cement businesses have posted superior
RoCE than cement in FY12, we expect steady
recovery in cement to reverse the equation, going
ahead.
We expect the RMC business to continue growing
steadily (at 15-20%), with stable margins. In the TBK
business, we expect margin expansion, led by
greater focus on value-added products and cost
savings driven by to switch towards low cost fuel
mix.
Has 5.6mtpa of cement capacity in Madhya Pradesh
and is one of the largest holders of limestone
reserves in the state.
Posted strong volume CAGR of 34% over FY10-12,
led by recent brownfield addition.
Production witnessed temporary blip in 1QFY13 due
to damage of blending silo.
Going forward, volume growth hinges on the
replacement of the silo and subsequent uptick in
utilization from the current 72%.
Expect volume growth of 12% CAGR over FY13-15,
driven by replacement of damaged blending silo by
FY13 end.
Sales Mix [17 / 20]
Sales mix concentrated in Central and East India,
with Uttar Pradesh (45%), Madhya Pradesh (32%),
Bihar (16%), and Chhattisgarh (3%) being the key
contributors.
Over FY11-12, realizations have been muted due to
(1) higher clinker sales, (2) new market entry, and
(3) relatively weaker price growth in Central India.
In 1HFY13, pricing outlook was encouraging (INR33/
bag increase over FY12 average), led by stronger
demand-supply dynamics in Central India.
We model INR37/15/12 per bag increase in PRSC's
realizations in FY13/14/15.
Strength of Financials [12 / 20]
PRSC's cement profitability has declined sharply
over FY1-12. However, we expect healthy recovery,
with ~55% CAGR in EBITDA/ton over FY13-15 to
INR853, led by multiple cost saving triggers.
Expect 18%/59% CAGR in revenue/EBITDA over FY13-
15.
Greenfield expansion of 4.8mtpa in Andhra Pradesh
is still under initial evaluation and is unlikely to
commence before FY16.
Moderate capex and FCF generation to reduce net
debt to ~INR12b (net debt-equity of 0.8x) by FY15.
Supply Chain Efficiencies [10 / 20]
Costly fuel mix (70% open market purchase) and
inefficient fuel and electricity usage a drag on
energy cost.
Increase in lead distance to 425km, with new market
entry, has increased freight cost.
Multiple cost saving triggers: (1) replacement of the
blending silo by the end of FY13, (2) commencement
of captive coal mine (annual savings of ~INR1b, not
factored in our estimates), and (3) encouraging
uptick in realizations on the back of favorable
market mix. Expect most of the triggers to kick in
from FY14.
We model in 2% CAGR in cement cost over FY13-15,
driven by normalization of production and operating
leverage.
January 2013
Valuation & View [53 / 100]
Our SOTP valuation is INR57/share. We value cement
business at 4x FY15E EBITDA, TBK business at 6.5x
FY15E EBITDA (at 25% premium to Kajaria Ceramics)
and the RMC business at 5x FY15E EBITDA.
The implied valuation of the cement business is an
EV of USD64/ton (v/s USD64/ton for our Mid Cap
Cement Universe and USD111/ton for our Full
Cement Universe) and 3.2x FY15E EBITDA (v/s 3.9x
FY15E EBITDA for our Mid Cap Cement Universe and
5.9x FY14E EBITDA for our Full Cement Universe).
We initiate coverage with a
Neutral
rating.
Moreover, its diversified business carries the risk of
inefficient allocation of capital.
115

Prism Cement
Size & Scalability: Recovery in utilization to drive dispatches hereon
Volume growth hinges on stabilization of recent expansion…
PRSC has 5.6mtpa of cement capacity at Satna in Madhya Pradesh and is one of the
largest holders of limestone reserves in the state. It has posted strong volume CAGR
of 34% over FY10-12, led by brownfield capacity addition in unit II of its Satna plant
(3.6mtpa in December 2010). There was a blip in its cement production in 1QFY13, as
the blending silo in clinker unit II was damaged. While the issue has been fixed with
an intermittent facility, the management has indicated that full resolution would
happen by the end of FY13, increasing utilization to 90% (v/s 85% in FY12 and 72% in
1HFY13). Despite immediate constraints, recovery in utilization would be the key
volume growth driver hereon.
Volume thrust from expansion already behind
To post sub-par dispatch growth over FY12-15
Source: Company, MOSL
…though lack of further expansion would limit growth potential
We have modeled volume growth of 12% CAGR over FY13-15 for PRSC v/s 9.5% for our
Cement Universe, driven by replacement of damaged blending silo by FY13 end. The
growth would be on the back of steady uptick in utilization to >100% by FY14-15. The
lack of visibility on further capacity expansion till FY15 would limit growth potential.
Sales Mix: Expect favorable market to drive 6.6% CAGR in realization
Favorable market mix…
PRSC's sales mix is concentrated in Central and East India, with Uttar Pradesh (45%),
Madhya Pradesh (32%), Bihar (16%), and Chhattisgarh (3%) being the key contributors.
With no capacity expansion planned till FY15, we expect near-term market mix to
remain unaltered. Almost 90% of its cement production is skewed towards superior
quality PPC.
January 2013
116

Prism Cement
Market mix: High contribution from Uttar Pradesh
/Madhya Pradesh (%)
Expect 12% CAGR in realization over FY12-15
Source: Company, MOSL
…to drive healthy realization growth after underperformance in FY11-12
Over FY11-12, PRSC's realizations have been 5-15% lower than our Cement Universe,
largely on account of (1) higher clinker sales, (2) entry into new markets (Bihar), with
expanded capacity, and (3) relatively weak price growth in Central India. However,
pricing outlook has been encouraging over 1HFY13 (INR33/bag increase over FY12
average), led by stronger demand-supply dynamics in Central India. We model INR37/
15/12 per bag increase in PRSC's realizations in FY13/14/15. We expect outperformance
in realizations to place PRSC largely at par with our Cement Universe by FY14-15.
Supply Chain Efficiencies: Cost saving triggers kick in from FY14
Costly fuel mix, suboptimal efficiency a drag on energy cost
PRSC procures ~30% of its coal requirement (~1mtpa) through linkage coal and the
balance through open market purchases. The higher proportion of open market coal
(@INR6,200/ton) and escalation in linkage coal prices (landed cost for PRSC at INR5,500/
ton) by Coal India had a severe negative impact on its energy cost. Its average coal
procurement cost has grown 68% over FY10-12 to INR5,400/ton v/s INR4,900/ton for
our Cement Universe. Moreover, sub-optimal fuel efficiency (partly due to lower
utilization) remains a major overhang on energy cost: (a) PRSC's average coal usage
(as % of clinker) is 17-18% v/s 14% for our Cement Universe, (b) electricity/ton of
cement has also grown by 17% over FY10-12, and (c) electricity cost stood at INR5-6/
unit (no captive power plant) v/s INR4-4.5/unit for our Cement Universe.
Coal usage/ton of clinker inferior to industry average (%)
Trend in coal usage per ton of clinker (%)
January 2013
117

Prism Cement
Rising trend in power usage (KWH/ton of cement)
Electricity cost (INR/unit) above industry average
Source: Company, MOSL
Freight mix skewed towards railways
PRSC's freight mix is skewed towards railways (60% contribution). Its overall freight
cost was up significantly (~32% on per ton of cement dispatch) over FY10-12, largely
on account of (a) increase in rail freight, and (b) increase in lead distance from 340km
to 425km, with entry into new markets post commencement of new capacity. While
we have assumed healthy uptick in PRSC's realizations over FY13-15, a part of the
increase will be offset by higher lead distance. This, along with increase in diesel
price, would keep fright cost high.
Benefits of cost savings to accrue from FY14
PRSC has three major cost saving triggers:
1.
Replacement of blending silo
by the end of FY13 would have a positive bearing on
utilization and raw material cost (estimate savings of INR130-150/ton), as it would
reduce clinker purchase.
2. PRSC's
captive coal mine
(15mtpa reserve at Chhindwara, Madhya Pradesh) is
likely to start operations by 3QFY14 and would fulfill 30%+ of its coal requirement
at an estimated landed cost of INR2,700/ton, leading to annual savings of ~INR1b
(not factored in our estimates). The mining contract for the same has already
been outsourced to Apex Encon.
3. Seven
upcoming power plants,
with cumulative capacity of 17,000MW, are set to
start operations in Central India over the next couple of years, which should reduce
PRSC's power and fly ash cost.
We model 2% CAGR in cement cost over FY13-15, driven by cost saving triggers.
However, any delay in replacement of blending silo could have a negative bearing on
utilization and raw material cost, as it would necessitate higher clinker purchases.
January 2013
118

Prism Cement
We model moderation in cost FY14 onward (INR/ton)
Source: Company, MOSL
Strategic & Other Issues: High non-cement contribution
High non-cement contribution and capital allocation
PRSC has merged its ready mix concrete (RMC) and tiles and bathroom & kitchen
products (TBK) businesses with the cement business in FY10, which resulted in the
emergence of an integrated building materials company. Its non-cement businesses
accounted for 60%/57%/42% of FY12 revenue/EBITDA/Capital Employed.
Almost 10% of PRSC's capital allocation is towards RMC, which earns RoCE of 14-16%.
TBK accounts for ~32% of capital allocation and earned RoCE of 6% in FY12 (18%/12% in
FY10/11) due to intense competition from the unorganized sector and sharp increase
in input and energy costs.
PRSC's cement business has posted inferior capital efficiency over FY11-12 due to
recent capex, cost escalation and operational bottlenecks (damage of blending silo).
We believe that the cement business is at the cusp of recovery and renders strong
visibility of profitability improvement over FY13-15. Going forward, the possibility of
continued capital allocation towards non-cement businesses would be a key concern.
Segmental revenue mix (%)
Capital allocation mix (%)
RoCE trend (%)
Source: Company, MOSL
January 2013
119

Prism Cement
RMC business to enjoy stable margin and high asset turn
PRSC is India's third-largest RMC player after UltraTech and Lafarge. It has 85 existing
plants, with a total capacity of 6m cubic meters, along with backward integration in
aggregates (9 aggregate plants, manufactured sand, etc; also supplying to third parties).
The backward integration enables PRSC's RMC business to earn relatively stable/high
margins as compared to peers (ACC makes EBITDA loss).
PRSC's RMC business enjoys 5-6% EBITDA margin along with high asset turn of 4-5x,
translating into RoCE of 14%. We expect improvement in utilization (backed by low
penetration of RMC in India; the management expects ~20% volume growth in the
near term) to boost asset turn and capital efficiency. GST implementation would be
favorable for the organized sector, as it would eliminate the tax advantage enjoyed
by the unorganized sector. We model 12% volume and 18% revenue CAGR over FY13-
15, amidst stable EBITDA margin of 5%.
Strong brands in TBK; switch to low cost fuel to aid cost savings
PRSC is India's leading tiles manufacturer, with strong brand equity and one of the
largest distribution networks. It has brands such as (1) Johnson (floor tiles and bathroom
& kitchen products), (2) Marbonite (vitrified tiles), (3) Endura (industrial tiles), etc.
Due to high competition from unorganized players, PRSC follows a JV/outsourcing
model to (a) gain cost advantage in low-end products, and (b) focus on high-end
vitrified/industrial tiles and bathroom & kitchen accessories. South India (especially
Andhra Pradesh) is PRSC's core market due to proximity to plants, while the JV model
offers geographical diversification.
We assume 15% volume CAGR over FY13-15 in TBK business, with no major change in
existing revenue mix between own manufacturing (35%), JV (45%) and outsourcing
(20%). PRSC has converted its fuel source to RNLG from high cost propane gas or LPG
in its three plants (including Pen and Kunigal), covering 40% of capacity. The company
is likely to derive cost benefits, with other plants also set to move towards natural
gas-based fuel over the next few years.
RMC: Expect steady growth amidst stable margins
TBK: Profitability to improve due to changing fuel mix
Source: Company, MOSL
January 2013
120

Prism Cement
Related / unrelated investments
PRSC primarily has two investments:
1. 29.9% stake in Norcros for INR1.33b:
Norcros is a leading supplier of ceramic tiles,
showers and adhesive products operating in UK, South Africa, Middle East and
Australia. Currently, PRSC is drawing healthy dividend (GBP650k in FY12) from this
investment and expects to enjoy export synergies on the back of Norcros'
distribution network.
2. 74% stake in Raheja QBE General Insurance (JV with QBE Australia) for INR1.53b:
The company focuses on niche segments (liability insurance, marine liability, trade
credit), with a profit sensitive approach. It does not have any plans to scale up in
the near future.
Strength of Financials: Cement business to see revival in profitability
Cement profitability to improve with potential cost savings
Sustained input cost pressure (particularly coal and power) and lower capacity
utilization led to a sharp decline in cement profitability over FY10-12. EBITDA/ton
declined from INR1,218 (margin 35%) in FY10 to INR251 (margin 8%) in FY12. This has
resulted in much lower profitability for PRSC than peers.
We expect the gap to reduce on account of higher realization uptick and cost saving
catalysts in FY14. We model ~55% CAGR in EBITDA/ton over FY13-15 (on a low base) to
INR853. On the back of steady revival in the cement segment, coupled with cost
saving triggers in TBK, we expect PRSC to post 15% revenue CAGR and 60% EBITDA
CAGR over FY13-15, implying margin expansion of ~2.3pp. The company expects
reversion to sustainable RoCE of 18-20% in the medium tserm.
Cement profitability to improve from FY14
EBITDA to post 49% CAGR over FY12-15
Source: Company, MOSL
Cement capex plan tentative; non-cement business to witness steady capex
PRSC plans to set up a greenfield capacity of 4.8mtpa in Kurnool, Andhra Pradesh,
where it has already acquired land (~3,000 acres) and obtained all requisite approvals
including mining lease, environment clearance, etc. However, given unfavorable
demand-supply dynamics in Andhra Pradesh and greater focus on stabilizing the
recently commissioned brownfield capacity at Satna, further clarity on the greenfield
expansion is likely by FY14, followed by 30 months of execution time. The
January 2013
121