17 January 2013
3QFY13 Results Update |
Sector: Automobiles
Bajaj Auto
BSE Sensex
19,987
Bloomberg
Equity Shares (m)
M.Cap. (INR b)/(USD b)
1,6,12 Rel.Perf.(%)
S&P CNX
6,057
BJAUT IN
289.4
601/11
-4/21/23
CMP: INR2,076
TP: INR2,250
Buy
52-Week Range (INR) 2,229/1,410
Financials & Valuation (INR b)
Y/E March
Sales
EBITDA
NP
EPS Gr. (%)
BV/Sh. (INR)
RoE (%)
RoCE (%)
Payout (%)
Valuations
P/E (x)
P/BV (x)
EV/EBITDA (x)
Div. Yield (%)
2013E 2014E 2015E
202.9
37.3
30.3
(2.5)
45.2
62.5
55.9
19.8
8.1
14.0
2.4
239.1
47.1
38.3
26.4
46.3
63.7
53.0
15.7
6.5
10.6
2.9
276.2
53.8
43.4
13.2
42.3
58.1
50.8
13.9
5.3
8.8
3.1
Adj. EPS (INR) 104.7 132.4 149.8
255.0 317.2 391.0
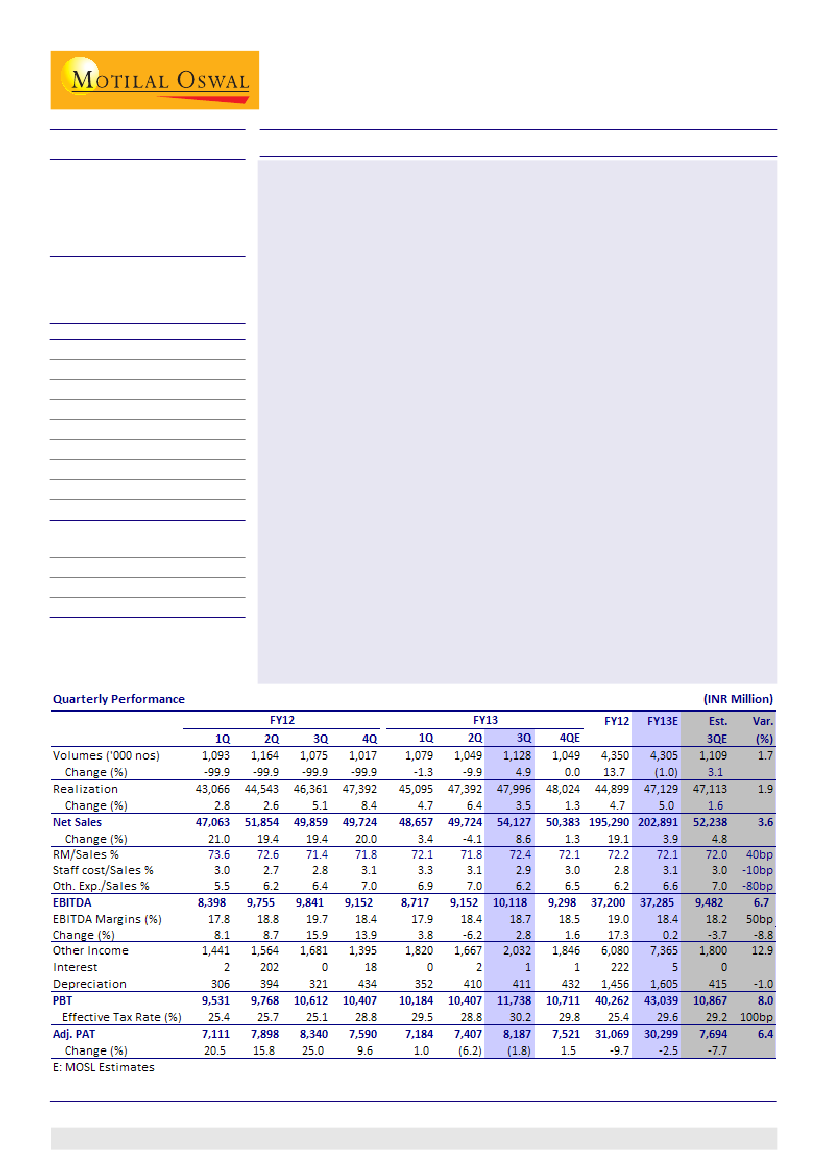
Bajaj Auto (BJAUT) posted above estimate results, with EBITDA margins at 18.7%
(v/s est 18.2%) and adj. PAT at INR8.2b (v/s est. INR7.7b), driven by richer product
mix and higher export realizations. New launches helped 5% volume growth.
Earnings call highlights
Management expects 4Q volumes to remain muted ; however, no discounts/
subventions being offered, even in 3Ws.
Expects domestic motorcycle growth to pick up in FY14 on better consumer
sentiments and new launches. Exports to grow by over 10% in FY14; expects
15-18% CAGR in exports over 3-5 years, led primarily by Africa.
FY14 export exposure of USD900m hedged at a base rate of 53 INR/USD
(average 54, v/s 49 in FY13); benefit of favorable currency could be passed on
to boost volumes.
Upgrade FY13E/FY14E EPS est by ~1.2%/2.9%
We upgrade FY13E/FY14E EPS by 1.2%/2.9% to factor higher export realizations
driven by INR depreciation. We model INR/USD rate of 49/54 for FY13E/FY14E.
Valuation and view
New launches and recovery in domestic two-wheeler industry to drive 13%
volume CAGR over FY13E-15E in domestic motorcycles. This coupled with a
recovery in export volumes and 3Ws (launch of a completely new range) to
drive 14.6% overall volume CAGR. Volume growth coupled with favorable
currency will drive 19.6% earnings CAGR over FY13E-15E.
The stock is valued at 15.7x FY14E EPS of INR132.4 and 13.9x FY15E EPS of
INR149.8. Our estimates could see upgrades for export realizations above 54
(every INR1 depreciation would boost margins by 65bp, EPS by 3.2% for FY14E/
15E). Maintain
Buy
with a target price of INR2,250 (15x FY15E EPS).
Jinesh Gandhi
(Jinesh@MotilalOswal.com) + 91 22 3982 5416
Chirag Jain
(Chirag.Jain@MotilalOswal.com) + 91 22 3982 5418
Investors are advised to refer through disclosures made at the end of the Research Report.
1

Bajaj Auto
Festive demand recovery and new launches drive growth in motorcycles;
3Ws benefit from higher diesel sales
Volumes grew 5% YoY (+7.5% QoQ) to 1.13 m units (v/s est 1.11 m) driven by
domestic markets as exports were impacted due to global slowdown and import
duty hike in Sri Lanka effective Apr-12.
Domestic motorcycles registered a growth of 7% YoY (+14.2% QoQ) driven by ramp-
up in recent launches and festive demand. On a sequential basis, market share
improves by 30bp in the domestic motorcycles helped by recent launches.
Despite sluggish demand trends, the company has not been providing any
discounts/subventions to drive sales, both in the motorcycle and 3Ws.
Bajaj enjoys 40% market share (including exports) in 125cc & above motorcycle
segment (~35% of industry volumes). In another 65%, Bajaj has 20% market share.
Motorcycle exports declined by 1% YoY (-8.5% QoQ), reflecting slowdown in the
global economy. However, Africa (Bajaj's biggest export market) continues to
perform well with Nigeria recording highest ever retails in Dec-12.
Considering the balance of payment situation and inflationary trends, Govt. actions
in key export markets are artificially curbing demand for the two-wheeler industry.
However, Bajaj (being the market leader in most markets) have gained market
share as customers prefer established brands during uncertain times.
Export volumes to the Sri Lanka market have stabilized at 7.5k for 3Ws (v/s earlier
12k) and 5.5-6k for motorcycles (v/s 10k) per month.
Growth of in 3Ws was largely driven by higher sales of diesel 3Ws (24% YoY) in the
domestic market. Bajaj continues to enjoy market leadership with 89% share in
the petrol/alternative fuel 3W segment.
Realizations were up 3.5% YoY (+1.3% QoQ) to INR47,996/unit (v/s est INR47,113),
driven by better mix (higher share of 3Ws and better motorcycle mix) together
with higher realizations on exports (+9% QoQ). Higher export realizations is despite
DEPB reduction of 3.5% effective Oct-12, and is driven by higher 3W contribution,
price increase for DEPB reduction (effective Nov-12).
Driven by 5.1% YoY volume growth and 3.5% YoY realization growth, net revenues
grew by 8.6% YoY (+8.9% QoQ) to INR54.1b (v/s est INR52.2b).
Trend in product mix
3QFY13
Motorcycles
Domestic
Exports
Total Motorcycles
% of total
Three Wheelers
Domestic
Exports
Total 3Ws
% of total
Total Volumes
687,351
298,912
986,263
87.5
3QFY12 YoY (%)
642,395
301,654
944,049
88.0
7.0
-0.9
4.5
2QFY13 QoQ (%) FY13-YTD FY12-YTD YoY (%)
601,876
326,648
928,524
88.5
14.2 1,907,716 1,950,241
-8.5 989,694 984,216
6.2 2,897,410 2,934,457
89.0
88.1
12.5
21.5
17.2
166,052 149,742
192,458 245,494
358,510 395,236
11.0
11.9
7.5 3,255,920 3,329,720
Source: Company,
-2.2
0.6
-1.3
64,168
52,134
77,310
76,558
141,478 128,692
12.5
12.0
1,127,741 1,072,741
23.1
1.0
9.9
57,047
63,637
120,684
11.5
5.1 1,049,208
10.9
-21.6
-9.3
-2.2
MOSL
17 January 2013
2

Bajaj Auto
Trend in market share (%)
75cc - 125cc
125cc - 250cc
Dom. Motorcycles
Total Motorcycles
Total Dom. 2W
Total 2W (incl exports)
Dom. 3W
3W (incl exports)
3QFY13
22.4
44.8
26.0
31.8
19.0
24.2
42.3
58.7
3QFY12
20.2
48.6
25.3
32.7
19.4
26.1
38.3
61.3
YoY (bp)
220
-370
60
-90
-40
-180
400
-260
2QFY13
QoQ (bp)
22.2
30
44.2
60
25.7
30
33.2
-140
18.3
70
24.8
-60
41.0
140
56.0
270
Source: SIAM, MOSL
Realizations improves in export markets
Market share improves in domestic segment QoQ
Source: Company, MOSL
Richer mix and higher export realizations drive QoQ margin improvement
despite reduction in export incentives
EBITDA margin improved by 30bp QoQ (-100bp YoY) to 18.7% (v/s est 18.3%), driven
by richer product mix, higher export realizations and operating leverage benefits,
despite RM cost increasing by ~60bp QoQ to 72.4%.
During the quarter, export incentives (DEPB) were reduced from 5.5% to 2% on
exports effective Oct-12. To pass the impact, Bajaj increased its export prices
effective Nov-12.
RM cost increased QoQ by 60bp
Trend in EBITDA (INR/unit) and EBITDA margin (%)
Source: Company, MOSL
17 January 2013
3

Bajaj Auto
Mix within motorcycles improved driven by recent launches i.e. Pulsar 200NS and
Discover 125ST. During the quarter, the Pulsar and Discover brand contributed
~70% of motorcycle volumes.
EBITDA grew by 2.8% YoY (+10.5% QoQ) to INR10.1b (v/s est INR9.48b).
Adj. PAT declined marginally by 2% YoY (+10.5% QoQ) to INR 8.2b (v/s est 7.69) due
to higher tax rate at 30.2% (v/s 25.1% in 3QFY12) on partial expiry of Pantnagar tax
benefits.
Other takeaways
Management expects 4QFY13 volumes to remain muted (flat YoY). Dec-12
wholesale dispatches were higher than retails to fill in channel inventory to ~30
days, post correction during festive season.
Bajaj Auto has increased its export prices to pass on ~70-75% of the impact of
DEPB (export incentive) reduction. Despite that, export realizations were up due
to higher 3W sales driven by recovery in demand from Sri Lanka and Egypt.
Management expects profitability to improve significantly in FY14 primarily driven
by higher export realizations on INR depreciation. FY14, the company has hedged
USD900m of export exposure at a base rate of INR53/USD (average rate of 54 for
FY14, v/s INR49 in FY13), although it could partly pass-on the benefit to drive
volumes.
The company expects volume and margins could get a significant boost in FY14, if
the recently launched 100c Discover (100T) is accepted well by the customers. At
similar price and mileage, the company claims it offers 30% higher power compared
to competition in the 100-110cc space.
The company expects a monthly run-rate of 45-47k units of 3Ws; benefits from
issuance of new permits in the domestic market would be additional.
Management believes that its strategy of differentiation and deeper segmentation
of the market would enable it to withstand competition from Honda, which follows
a strategy of familiarity.
Management expects its export volumes to grow by 15-18% CAGR over the 3-5
year period driven by 1) benefits accruing Kawasaki/KTM partnership, 2) entry
into newer markets (for instance Brazil), and 3) continued growth from Africa and
other key markets. Penetration levels in several African countries are below 5%
levels (compared to 10-11% in India).
The company plans to introduce a new range of 3Ws in FY14. Moreover, if the
regulatory approvals are received, the company plans to launch the 4-wheeler
(RE 60) in FY14.
Current capacity stands at 6.0m units (including 0.6m for 3Ws). Company claims
that capacity expansion, when needed, can be carried out a notice of 5-6 months.
Due to partial expiry of tax benefits at Pantnagar plant, tax rates have increased in
FY13 onwards. The company expects FY13 tax rate to be high at 29% levels (v/s
25% in FY12).
As on Dec-12, surplus cash stood at INR53.7b (v/s INR45.2b as on Jun-12).
17 January 2013
4

Bajaj Auto
Upgrade FY13/FY14 EPS est by ~1.%/2.9% to factor in for higher export
realizations
We upgrade our FY13/FY14 EPS estimates by 1.2%/2.9% to factor in for higher
export realizations driven by INR depreciation. We model INR/USD rate of 49/54
for FY13/FY14.
Revised forecast (INR m)
Rev
4,305,046
202,891
37,285
18.4
30,299
104.7
FY13E
Old
4,305,669
201,478
36,625
18.2
29,938
103.5
Chg (%)
0.0
0.7
1.8
20bp
1.2
1.2
Rev
4,886,648
239,146
47,124
19.7
38,312
132.4
FY14E
Old
Chg (%)
4,883,205
0.1
235,748
1.4
45,587
3.4
19.3
40bp
37,226
2.9
128.6
2.9
Source: MOSL
Volumes (units)
Net Sales
EBITDA
EBITDA Margins (%)
Net Profit
EPS (INR)
Valuation and view
Expect recovery in domestic two-wheeler industry together with new launches
to drive 13% volume CAGR for Bajaj over FY13-15 in domestic motorcycles. This
coupled with recovery in export volumes and 3Ws (launch of completely new
range) to drive 14.6% overall volume CAGR. Volume growth coupled with
favorable currency will drive 19.6% earnings CAGR over FY13-15E.
The stock is valued at 15.7x FY14E EPS of INR132.4 and 13.9x FY15E EPS of INR149.8.
Our estimates could see meaningful upgrades for export realizations above 54
(every INR1 depreciation would boost margins by 65bp, EPS by 3.2% for FY14/15).
Maintain
Buy
with TP of INR2,250 (15x FY15 EPS).
17 January 2013
5

Bajaj Auto
Bajaj Auto: an investment profile
Company description
Bajaj Auto (BJAUT), the flagship of the Bajaj group, is a
leading manufacturer of two-wheelers (~88% of
volumes) and three-wheelers (~12% of volumes). It is
the market leader in three-wheelers, and is the second
largest player in motorcycles and enjoys leadership in
the premium segment. It is also the largest exporter of
two-wheelers and three-wheelers (~36% of its volumes).
Recent developments
Has launched a new 100cc motorcycle (Discover
100T), providing higher power and features/style at
mileage similar to competition in that segment.
Valuation and view
The stock is valued at 15.7x FY14E EPS of INR132.4
and 13.9x FY15E EPS of INR149.8. Our estimates could
see meaningful upgrades for export realizations
above 54 (every INR1 depreciation would boost
margins by 65bp, EPS by 3.2% for FY14/15).
Maintain
Buy
with TP of INR2,250 (15x FY15E EPS).
Key investment arguments
Well diversified product and market mix, with
motorcycle and three-wheelers in domestic and
export markets.
Renewed strategy with focus on Discover and Pulsar
- two of its most profitable brands
Largest exporter of two-wheelers (~63.7% of
exports) and three-wheelers (~95% of exports), with
scope to drive overall volume growth
Sector view
Demand drivers in place, driven by increasing
penetration in rural markets and replacement
demand from urban markets
2W export provides huge opportunity, with ~2x India
opportunity in the markets similar to India.
Industry dynamics favorable, with focus on
profitability rather than market share.
Key investments risks
Strengthening-up of commodity prices to put
pressure on margins.
Increasing competitiveness in two-wheeler industry
could restrict pricing power.
Comparative valuations
P/E (x)
EPS Gr (%)
RoE (%)
EV/EBITDA (x)
FY13E
FY14E
FY13E
FY14E
FY13E
FY14E
FY13E
FY14E
Bajaj Auto
19.8
15.7
-2.5
26.4
45.2
46.3
14.0
10.6
Hero MotoCorp
16.0
14.7
-3.6
8.7
43.3
39.0
9.9
8.3
EPS: MOSL forecast v/s consensus (INR)
MOSL
Forecast
104.7
132.4
Consensus
Forecast
110.1
130.0
Variation
(%)
-4.9
1.8
FY13
FY14
Target price and recommendation
Current
Price (INR)
2,076
Target
Price (INR)
2,250
Upside
(%)
8.4
Reco.
Buy
Stock performance (1 year)
Shareholding pattern (%)
Dec-12
Promoter
Domestic Inst
Foreign
Others
17 January 2013
50.0
8.3
17.4
24.3
Sep-12
50.0
10.0
15.5
24.5
Dec-11
50.0
8.5
16.6
24.9
6

Bajaj Auto
Financials and Valuation
17 January 2013
7

Disclosures
This report is for personal information of the authorized recipient and does not construe to be any investment, legal or taxation advice to you. This research report does not constitute an offer, invitation or inducement
to invest in securities or other investments and Motilal Oswal Securities Limited (hereinafter referred as MOSt) is not soliciting any action based upon it. This report is not for public distribution and has been
furnished to you solely for your information and should not be reproduced or redistributed to any other person in any form.
Unauthorized disclosure, use, dissemination or copying (either whole or partial) of this information, is prohibited. The person accessing this information specifically agrees to exempt MOSt or any of its affiliates
or employees from, any and all responsibility/liability arising from such misuse and agrees not to hold MOSt or any of its affiliates or employees responsible for any such misuse and further agrees to hold MOSt
or any of its affiliates or employees free and harmless from all losses, costs, damages, expenses that may be suffered by the person accessing this information due to any errors and delays.
The information contained herein is based on publicly available data or other sources believed to be reliable. While we would endeavour to update the information herein on reasonable basis, MOSt and/or its
affiliates are under no obligation to update the information. Also there may be regulatory, compliance, or other reasons that may prevent MOSt and/or its affiliates from doing so. MOSt or any of its affiliates or
employees shall not be in any way responsible and liable for any loss or damage that may arise to any person from any inadvertent error in the information contained in this report . MOSt or any of its affiliates
or employees do not provide, at any time, any express or implied warranty of any kind, regarding any matter pertaining to this report, including without limitation the implied warranties of merchantability, fitness
for a particular purpose, and non-infringement. The recipients of this report should rely on their own investigations.
This report is intended for distribution to institutional investors. Recipients who are not institutional investors should seek advice of their independent financial advisor prior to taking any investment decision
based on this report or for any necessary explanation of its contents.
MOSt and/or its affiliates and/or employees may have interests/positions, financial or otherwise in the securities mentioned in this report. To enhance transparency, MOSt has incorporated a Disclosure of Interest
Statement in this document. This should, however, not be treated as endorsement of the views expressed in the report.
Disclosure of Interest Statement
1. Analyst ownership of the stock
2. Group/Directors ownership of the stock
3. Broking relationship with company covered
4. Investment Banking relationship with company covered
Bajaj Auto
No
No
No
No
Analyst Certification
The views expressed in this research report accurately reflect the personal views of the analyst(s) about the subject securities or issues, and no part of the compensation of the research analyst(s) was, is, or
will be directly or indirectly related to the specific recommendations and views expressed by research analyst(s) in this report. The research analysts, strategists, or research associates principally responsible
for preparation of MOSt research receive compensation based upon various factors, including quality of research, investor client feedback, stock picking, competitive factors and firm revenues.
Regional Disclosures (outside India)
This report is not directed or intended for distribution to or use by any person or entity resident in a state, country or any jurisdiction, where such distribution, publication, availability or use would be contrary to
law, regulation or which would subject MOSt & its group companies to registration or licensing requirements within such jurisdictions.
For U.K.
This report is intended for distribution only to persons having professional experience in matters relating to investments as described in Article 19 of the Financial Services and Markets Act 2000 (Financial
Promotion) Order 2005 (referred to as "investment professionals"). This document must not be acted on or relied on by persons who are not investment professionals. Any investment or investment activity to
which this document relates is only available to investment professionals and will be engaged in only with such persons.
For U.S.
Motilal Oswal Securities Limited (MOSL) is not a registered broker - dealer under the U.S. Securities Exchange Act of 1934, as amended (the"1934 act") and under applicable state laws in the United States.
In addition MOSL is not a registered investment adviser under the U.S. Investment Advisers Act of 1940, as amended (the "Advisers Act" and together with the 1934 Act, the "Acts), and under applicable state
laws in the United States. Accordingly, in the absence of specific exemption under the Acts, any brokerage and investment services provided by MOSL, including the products and services described herein
are not available to or intended for U.S. persons.
This report is intended for distribution only to "Major Institutional Investors" as defined by Rule 15a-6(b)(4) of the Exchange Act and interpretations thereof by SEC (henceforth referred to as "major institutional
investors"). This document must not be acted on or relied on by persons who are not major institutional investors. Any investment or investment activity to which this document relates is only available to major
institutional investors and will be engaged in only with major institutional investors. In reliance on the exemption from registration provided by Rule 15a-6 of the U.S. Securities Exchange Act of 1934, as amended
(the "Exchange Act") and interpretations thereof by the U.S. Securities and Exchange Commission ("SEC") in order to conduct business with Institutional Investors based in the U.S., MOSL has entered into
a chaperoning agreement with a U.S. registered broker-dealer, Motilal Oswal Securities International Private Limited. ("MOSIPL"). Any business interaction pursuant to this report will have to be executed within
the provisions of this chaperoning agreement.
The Research Analysts contributing to the report may not be registered /qualified as research analyst with FINRA. Such research analyst may not be associated persons of the U.S. registered broker-dealer,
MOSIPL, and therefore, may not be subject to NASD rule 2711 and NYSE Rule 472 restrictions on communication with a subject company, public appearances and trading securities held by a research analyst
account.
For Singapore
Motilal Oswal Capital Markets Singapore Pte Limited is acting as an exempt financial advisor under section 23(1)(f) of the Financial Advisers Act(FAA) read with regulation 17(1)(d) of the Financial Advisors
Regulations and is a subsidiary of Motilal Oswal Securities Limited in India. This research is distributed in Singapore by Motilal Oswal Capital Markets Singapore Pte Limited and it is only directed in Singapore
to accredited investors, as defined in the Financial Advisers Regulations and the Securities and Futures Act (Chapter 289), as amended from time to time.
In respect of any matter arising from or in connection with the research you could contact the following representatives of Motilal Oswal Capital Markets Singapore Pte Limited:
Nihar Oza
Kadambari Balachandran
Email: niharoza.sg@motilaloswal.com
Email : kadambari.balachandran@motilaloswal.com
Contact: (+65) 68189232
Contact: (+65) 68189233 / 65249115
Office address: 21 (Suite 31), 16 Collyer Quay, Singapore 049318
Motilal Oswal Securities Ltd
Motilal Oswal Tower, Level 9, Sayani Road, Prabhadevi, Mumbai 400 025
Phone: +91 22 3982 5500 E-mail: reports@motilaloswal.com