30 January 2013
3QFY13 Results Update |
Sector: Retail
Shopper's Stop
BSE Sensex
19,991
Bloomberg
Equity Shares (m)
M.Cap. (INRb)/(USD b)
52-Week Range (INR)
1,6,12 Rel. Perf. (%)
S&P CNX
6,050
SHOP IN
82.2
34.9/0.6
494/283
-11/3/32
CMP: INR425
TP: INR400
Neutral
Financials & Valuation (INR b)
Y/E March
Sales
EBITDA
Adj. PAT
Adj. EPS (INR)
EPS Gr. (%)
BV/Sh.(INR)
RoE (%)
RoCE (%)
Payout (%)
Valuations
P/E (x)
P/BV (x)
EV/EBITDA (x)
Div. Yield (%)
2013E 2014E 2015E
22.5
1.2
0.4
4.4
-43.5
82.5
5.4
6.8
15.0
96.2
5.1
30.6
0.2
26.8
1.7
0.7
8.1
84.4
89.2
9.1
10.6
15.0
52.1
4.8
20.9
0.3
31.2
2.2
1.0
11.6
42.8
98.8
11.8
13.5
15.0
36.5
4.3
16.1
0.4
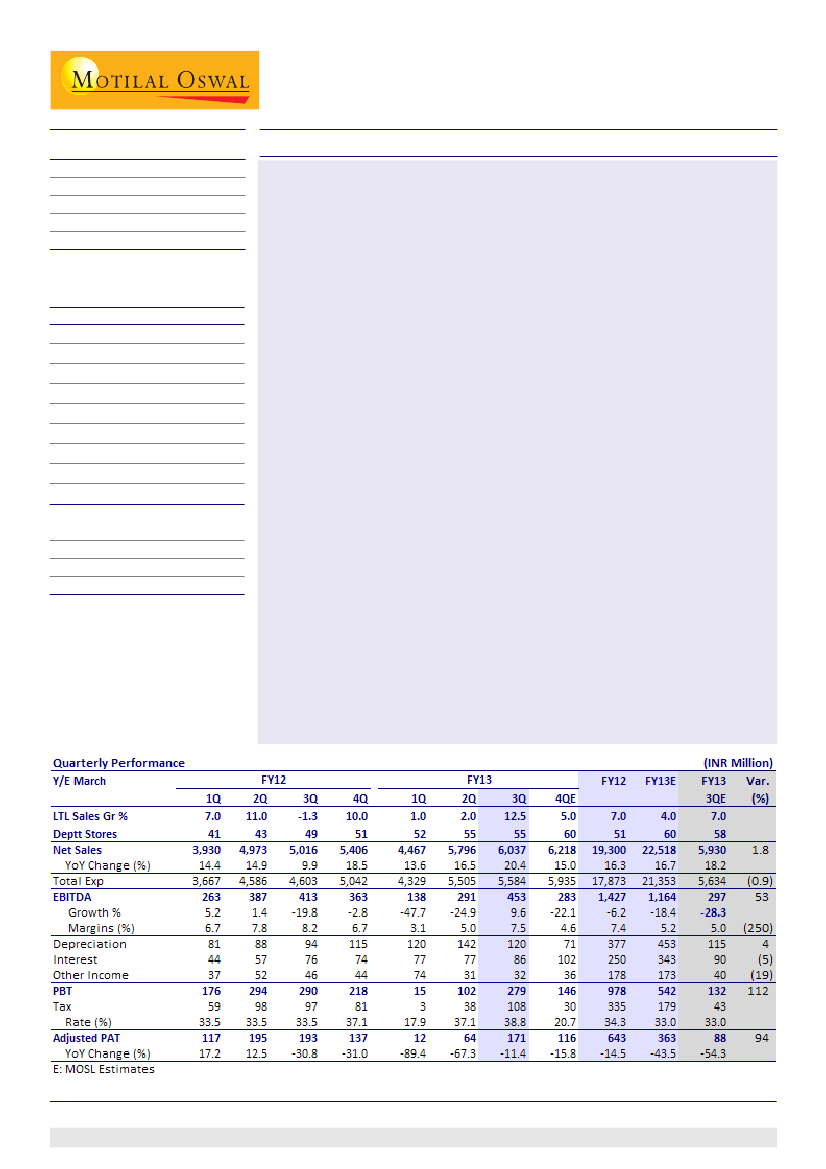
Standalone results for 3QFY13 better than expected
Standalone sales grew 20% to INR6b v/s our estimate of INR5.9b. Like-to-like
(LTL) sales grew 12.5%, aided by strong festive and wedding season sales. LTL
volumes grew 4%, the highest in eight quarters. For stores < 5 years old, LTL
sales grew 25%.
Gross margin expanded 40bp to 37.5%. However, increase in administrative
expenses (up 60bp) and employee expenses (up 60bp) led to operating margin
contraction of 70bp to 7.5%. EBITDA grew 10% to INR453m v/s our estimate of
INR297m. Sharp spike in capital costs (interest cost up 14%; depreciation up
28%) led to 4% decline in PBT. Tax rate increased 530bp, leading to 11% decline
in standalone PAT to INR171m (v/s our estimate of INR88m).
In 3QFY13, SHOP added 1
Shoppers Stop store
at Bangalore and opened 1
Crossword store, 3 M.A.C.,
1
Clinique store.
Total retail space stood at 4.8msf.
HyperCITY Retail: LTL growth improves to 3%; 3QFY13 loss at INR236m
HyperCITY Retail (51% stake) reported sales of INR2b (v/s INR1.87b in 2QFY13).
LTL sales growth improved to 3% (-2% in 2QFY13) but LTL volumes fell 14%.
Gross margin rose 150bp YoY to 19.3%. Store-level EBITDA was up 2.6x QoQ at
INR20m. Despite overall EBITDA loss of INR72m, LTL EBITDA improved to
INR41.6m (INR38.3m in 3QFY12). Net loss was INR236m (INR209m in 2QFY13).
Revising estimates upwards; maintain Neutral
SHOP reported consolidated PAT of INR43m for 3QFY13 v/s loss of INR56m in
2QFY13. Strong festive season coupled with improvement in consumer
sentiment helped SHOP to achieve its best LTL growth in 8 quarters.
We revise our FY13/14 estimates to incorporate the better than expected
3QFY13 results. The revision is sharp for FY13. We expect margin recovery in
FY14, driven by high single-digit LTL (7-8%) sales growth.
SHOP trades at 52x FY14E EPS. Maintain
Neutral,
with a TP of INR400 (SOTP:
Shoppers Stop at 20x FY15E EPS, HyperCITY at 1x FY15E sales).
Gautam Duggad
(Gautam.Duggad@MotilalOswal.com); +9122 3982 5404
Sreekanth P V S
(Sreekanth.P@MotilalOswal.com); +9122 3029 5120
Investors are advised to refer through disclosures made at the end of the Research Report.
1