31 January 2013
3QFY13 Results Update |
Sector: Consumer
Dabur India
BSE Sensex
S&P CNX
20,005
6,056
Bloomberg
DABUR IN
Equity Shares (m)
1,740.7
M.Cap. (INR b)/(USD b) 226.3/4.2
52-Week Range (Rs)
140/92
1,6,12 Rel. Perf. (%)
-2/-9/21
CMP: INR130
TP: INR156
upgrade to Buy
Financials & Valuation (INR b)
Y/E March
Sales
EBITDA
Adj. PAT
Adj. EPS (INR)
EPS Gr. (%)
BV/Sh.(INR)
RoE (%)
RoCE (%)
Payout (%)
Valuations
P/E (x)
P/BV (x)
EV/EBITDA (x)
Div. Yield (%)
29.8
10.3
22.4
1.4
23.8
8.5
18.3
1.8
20.0
7.0
15.3
2.1
2013E 2014E 2015E
61.6
10.1
7.6
4.4
16.7
12.6
34.7
38.5
40.3
72.0
12.2
9.5
5.5
25.2
15.3
35.7
40.9
42.7
84.0
14.3
11.3
6.5
19.1
18.6
35.1
40.9
42.7
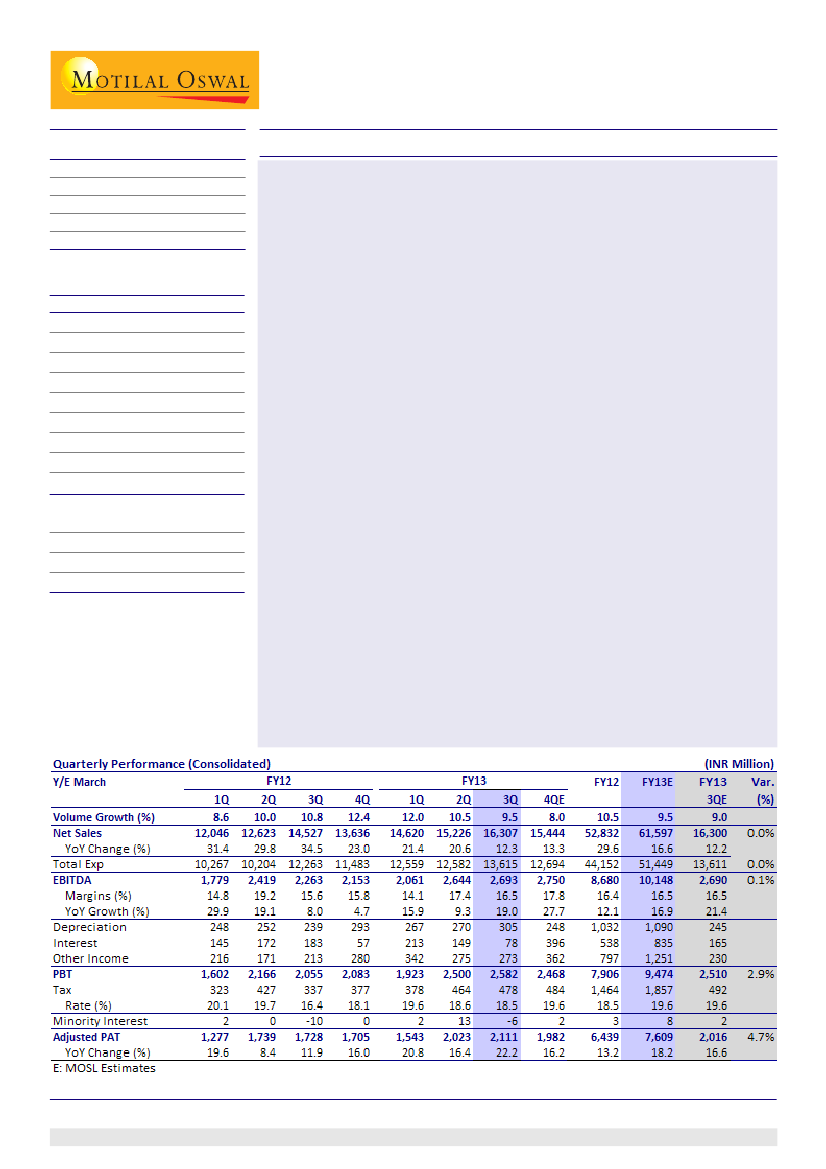
Dabur's 3QFY13 results were largely in line with our estimates. Consol net
sales grew at 12.3% YoY to INR16.34b (est INR16.3b), EBITDA grew 19% YoY to
INR2.69b (est INR2.69b), while Adj. PAT was higher than est at INR2.1b (est
INR2.01b) due to higher-than-estimated other income and lower tax rate.
Gross margin expanded 220bp to 51.2% due to softening in key input costs.
EBITDA margin expanded 90bp to 16.5% as ad expenses increased 80bp.
Domestic sales grew 13.6% to INR11.9b, with underlying volume growth at
9.5%. Gross margin remained flat at 46.2%, while EBITDA margin contracted
50bp to 16.5% due to 60bp increase in ad spend. Steep increase in tax rate
(450bp) to 20.4% curtailed Adj PAT growth at 7.5% to INR1.5b.
International business grew 9%, while organic business grew 22.4% (constant
currency growth at 16%). Reported growth is lower at 9% as Namaste business
was impacted by restructuring in Africa and re-branding in the US. Correction
in input costs led to significant gross margin expansion in international
business (gross margin up 860bp YoY in consolidated-standalone entity).
Dabur's consistent volume growth is a reflection of its investments behind
brands and distribution. Recovery in shampoo, oral care and hair care is a key
positive, while deterioration in international business though disappointing,
was a one-off. We expect Dabur to get tailwind benefits from its recent
distribution expansion initiatives and estimate PAT CAGR of 22% for FY12-
15E, one of the best in our staples universe.
Dabur trades at 23.8x FY14E and 20x FY15E EPS and has underperformed the
BSE FMCG index by 35% in the past 24 months. We expect the valuation gap
to narrow as a) volume growth sustains in 8-10% band driven by recovery in
core categories and b) margins improve led by international business division.
We value the stock at 24x PE (earlier 23x), roll over to FY15E and arrive at a
revised target price of INR156. Upgrade to
Buy
with a potential 20% upside.
Slowdown in rural FMCG growth and spike in input costs are key concerns.
Gautam Duggad
(Gautam.Duggad@MotilalOswal.com); +9122 3982 5404
Sreekanth P.V.S.
(Sreekanth.P@MotilalOswal.com); +9122 3029 5120
Investors are advised to refer through disclosures made at the end of the Research Report.

Dabur India
Consol sales up 12.3%, standalone up 13.6%; gross margin expands 220bp
Consolidated net sales
growth at 12.3% YoY to INR16.34b (est INR16.3b), EBITDA
grew 19% YoY to INR2.69b (est INR2.69b), while Adj. PAT was higher than est at
INR2.1b (est INR2.01b) due to higher-than-estimated other income and lower tax
rate. CSD sales remained sluggish, while urban sales underperformed rural sales.
However, urban sales growth remained in double digits.
Gross margin
expanded 220bp to 51.2% due to softening in key input costs.
EBITDA
margin
expanded 90bp to 16.5% as ad expenses increased 80bp and other expenses
remained flat.
Interest cost declined 57% as forex losses came down significantly. Despite 200bp
increase in tax rate to 18.6%, Adj. PAT grew 22.2% to INR2.1b (est INR2.01b).
Domestic sales
grew 13.6% to INR11.9b, with underlying volume growth at 9.5%.
Gross margin remained flat at 46.2%, while EBITDA margin contracted 50bp to
16.5% due to 60bp increase in ad spend. EBITDA grew 10.4% despite savings in
interest cost (down 85%) and 53% growth in other income. Steep increase in tax
rate (450bp) to 20.4% curtailed Adj PAT growth at 7.5% to INR1.5b.
9MFY13 consolidated sales, EBITDA and PAT are up 17.7%, 14.5% and 19.7%,
respectively.
Consolidated sales up 12.3% in line with our estimates
Management guides for 8-12% volume growth ahead
EBITDA margins expand 90bp YoY
PAT growth robust at 22.2%
Source: Company, MOSL
31 January 2013
2

Dabur India
Domestic business: Recovery in core categories; Hair care up 13.6%,
Shampoos 29%, Home Care 30.5%, Foods 22.1%
Domestic business reported 13.6% sales growth led by strong performance in
Foods, Home Care and recovery in Shampoos, Oral Care.
Hair oils posted
11.8% growth led by 15% growth in perfumed Hair Oil. Coconut
Hair oil growth remained flat due to low pricing differential between Dabur and
other competitive brands.
Shampoos posted 29%
growth on the back of improved product mix and re-launch
of Vatika shampoo. Management expects the growth to moderate going forward,
while at the same time expects market share gains in the shampoo category.
Vatika shampoo has become the largest distributed brand of Dabur and is available
in ~3.5m outlets. Management also indicated that South India still offers good
opportunity for Dabur in shampoo.
Oral Care grew 13.6% led by
Meswak and Dabur Red which posted 25% growth,
while Babool sales remained flat, an improvement QoQ. Toothpowder grew 14.6%
in 3QFY13, entirely price led.
Skin care growth was at 15.7%,
with double digit growth in Gulabari and healthy
growth in Fem led by Fem Bleach which has been re-launched and a new variant
Turmeric Herbal bleach.
Home care posted 30.5% growth
led by activations and media/marketing
initiatives.
Foods grew 22.1%
- Real franchise reported 29% growth. However, Foods margins
fell 500bp YoY due to higher discounts in Diwali (15% of sales is gift pack), higher
import component of RM and additional 1% CVD imposed by the government.
Foods gross margins is 10% lower in gift packs.
Health Supplements
posted 12% growth impacted partly by lower offtake from
CSD in Chavywanprash which still posted double digit growth. Honey and Glucose
reported strong growth.
OTC and Ethicals grew 15.6%,
while Digestive declined 5.4%.
Foods, Home Care and Shampoos record impressive growth
Category Growth (%)
Hair Care
Health Supplements
Oral Care
Foods
Digestives
Skin care
Home Care
IBD (organic)
1QFY12
9.0
0.0
12.7
31.5
7.8
16.3
24.9
12.5
2QFY12
15.9
7.8
6.0
27.5
3.8
0.0
0.5
22.8
3QFY12
19.6
13.5
11.6
17.4
19.3
4.9
18.0
37.8
4QFY12
19.8
10.9
7.7
30.4
19.4
17.6
18.0
45.8
1QFY13
2QFY13
3QFY13
10.4
13.2
13.9
18.0
15.7
12.0
8.1
7.0
13.6
34.5
18.1
22.1
9.8
11.9
-5.4
13.3
24.8
15.7
14.4
23.0
30.5
24.0
24.8
9.0
Source: Company, MOSL
International business: Healthy performance across all geographies
International business grew 9%
while organic business grew 22.4% (constant
currency growth at 16%). All key geographies performed well; growth was largely
led by GCC (22%), Egypt (15%) and Levant (21%). Levant region comprises Jordan,
Lebanon and other neighbouring markets.
Profitability in international business improved significantly.
Imputed gross and
EBITDA margins for subsidiaries (estimated as difference between consol and
31 January 2013
3

Dabur India
standalone entity) are up 860bp and 450bp respectively. Management indicated
that Middle East and Turkey business have seen strong gross margin expansion.
We note that Dabur's profitability in international business segment has seen
consistent improvement over the past four quarters led by gross margin
improvement and operating leverage benefits.
Namaste reported muted growth on account of restructuring in Africa and change
over in branding in the US. Management expects the business to normalize after
another quarter. Change in branding from Organic Root Stimulator to ORS was
necessitated due to regulatory reasons, according to management.
Hobi, its Turkey subsidiary, posted impressive 24% growth.
International business now contribute ~30% to revenues
Consistent improvement in Gross and EBITDA margins
Source: Company, MOSL
Recovery in core categories to narrow valuation gap
Hair Care
Hair Oils (13% of 3QFY13 consolidated sales)
Dabur's performance in its core cash cow Hair oils category had softened in the recent
past as it lost shares to Bajaj Corp and Marico. Marico benefited significantly in its
value-added hair oils category (shares up ~350bp in the last two years) driven by
aggressive pricing. Weakness in CSD offtake beginning CY12 also impacted volumes.
We see semblance of recovery in Dabur's hair oil business led by perfumed category.
Dabur launched various media/marketing initiatives and new variants in the last 12-
18 months to regain momentum. Potential recovery in CSD could help sustain the
current growth rates.
Hair Oils showing modest recovery
Source: Company, MOSL
31 January 2013
4

Dabur India
Shampoo (2% of 3QFY13 consolidated sales)
Shampoo business faced the brunt of price war between HUVR and P&G in FY11 and
1HFY12. Dabur lost ~30% volumes but has bounced back since then led by new
launches/re-launches, investments behinds media, distribution and marketing
initiatives. Management believes there is good potential still left in South India which
it will be tapping.
Shampoos bouncing off the low base helped by marketing interventions
Source: Company, MOSL
Oral Care (9% of 3QFY13 consolidated sales)
Oral Care has been impacted by lack of differentiation and absence at the premium
end of the spectrum, where growth rate is 20% plus. Dabur's growth in the category
has moderated to mid single digits as Babool suffered due to pricing issues. 3Q has
been better with flattish performance in Babool, however Red and Meswak have
grown ~25%. Even Toothpowder grew 15%, largely price led as the category is
underperforming due to up-trading towards toothpastes.
We expect recovery in core cash cow categories to gather steam as benefits from
recent innovations and distribution expansions flow through in FY14.
Oral Care recovery will be led by distribution expansion
Source: Company, MOSL
31 January 2013
5

Dabur India
Distribution expansion: provides uplift to medium term volumes; enhances
quality of reach
Dabur recently implemented two major projects pertaining to distribution
realignment and expansion.
Project Speed
Dabur had realigned its go-to-market distribution structure in FY12 to drive focus on
three categories - Health Care, Home & Personal Care and Foods. This project was
implemented in 3QFY12 and resulted in distributor rationalization from 4,500 to 3,600.
It also disengaged stockists of FEM and Consumer Health Division network and merged
it with the Consumer Care division.
Exclusive stockists for metro and larger cities; common in smaller towns.
This exercise was undertaken to drive distribution efficiency and optimize throughput.
Project Double
This was launched in FY12 to increase rural reach and enhance penetration of Dabur's
portfolio.
Ten states with attractive rural potential - UP, Maharashtra, WB, Bihar, Assam, Rajasthan,
Punjab, MP, Orissa and Karnataka - were selected for this. These states accounted for
~70% of the rural FMCG business. Pilot was launched in Maharashtra and UP and then
extended to other states.
It resulted in more feet on the street - ~2,000 additional sales personnel at local
village level. Benefits of these initiatives have started materializing, as evidenced by
sustained 8-10% volume growth momentum in domestic business. Dabur's strength
in rural is further augmented in our view as increase in rural reach reduces dependence
on wholesale trade. Typically, depth of portfolio coverage is limited in wholesale as
wholesale trade normally stocks fast selling SKUs to drive better stock turns in their
outlets.
Secondly, margins in wholesale business are lower. While wholesale helps reach
section of the trade where direct coverage is not feasible, we believe enhancement
of direct reach in rural markets will drive volumes and margins for Dabur in medium
to long term. It also helps drive deeper penetration of price point SKUs which are
popular in rural markets.
We expect Dabur's domestic volume growth to trend in 8-10% range due to benefits
from the distribution initiatives in rural markets. We note that most of the staples
companies in India have singularly focused on driving distribution reach in the last
three to four years (HUVR, GCPL, Marico, GSK Consumer, Nestle) to partake in the
growth opportunity offered by growing rural markets which are under penetrated in
most of the HPC categories.
Management commentary in the last two conference calls indicates continued
outperformance of rural. In 3QFY13, rural grew ~20% against the domestic company
sales growth of 13%. Management had also indicated in the past on improvement in
rural gross margins by 2-3% and possibility of taking it to company average levels.
31 January 2013
6

Dabur India
Valuation and view: Good operating performance; core categories
recovering; stock underperformance is behind; upgrade to Buy
Dabur's consistent volume growth is a reflection of its investments behind brands
and distribution. Recovery in Shampoo, Oral Care and Hair Care is a key positive,
while deterioration in international business though disappointing, was one-off.
We expect Dabur to get tailwind benefits from its recent distribution expansion
initiatives and estimate PAT CAGR of 22% for FY12-15E, one of the best in our
staples universe.
Dabur trades at 23.8x FY14E and 20x FY15E EPS and has underperformed the BSE
FMCG index by 35% in past 24 months.
The valuation discount to other mid-cap peers was due to muted performance in
its core categories.
We expect the valuation gap to narrow as a) volume growth sustains in 8-10%
band driven by recovery in core categories and b) margins improve led by
international business division.
We value the stock at 24x PE (earlier 23x), roll over to FY15E and arrive at a revised
target price of INR156. Upgrade to
Buy
with a potential 20% upside. Slowdown in
rural FMCG growth and spike in input costs are key concerns.
Dabur offers one of the best EPS CAGR in our staples universe
Source: Company, MOSL
Dabur India: One-year forward P/E (x)
Dabur Indiar v/s other FMCG companies P/E (x)
Source: Bloomberg, MOSL
31 January 2013
7

Dabur India
Dabur India: an investment profile
Company description
Dabur India is the second largest FMCG company in India,
in terms of Product portfolio. Dabur is a market leader
in
Chyawanprash
category and is increasing its presence
in other traditional categories like Hair Care, oral care,
household care and foods. Dabur's acquisition of Fem
Care given it a strategic presence in the high potential
skin care segment.
Recent developments
Dabur is expanding rural distribution network in ten
states as part of Project Double
New products such as hair serums and professional
hair care products under the Vatika brand were
launched.
Valuation and view
Dabur trades at 23.8x FY14E and 20x FY15E EPS and
has underperformed the BSE FMCG index by 35% in
the past 24 months.
We value the stock at 24x PE (earlier 23x), roll over
to FY15E and arrive at a revised target price of INR156.
Upgrade to Buy with a potential 20% upside.
Slowdown in rural FMCG growth and spike in input
costs are key concerns.
Key investment arguments
Strong herbal positioning with little competition
from MNC in categories like Hair Oil, CHD, Health
Supplements etc.
Dabur has the second broadest product portfolio
(after HUL) with presence in high potential
categories like skin care, hair care, oral care and
Health supplements.
Key investment risks
Higher than anticipated ad spends could impact
profitability adversely.
We believe that will face rising competitive intensity
in some of the key business segments; 1) Toothpaste
(likely entry of P&G) 2) Hair Oils (aggressive strategy
of Marico and Emami) 3) Shampoo (aggressive
strategy of P&G, HUL, Garnier etc resulting in
squeeze in sales growth and margins) and 4) Skin
care (rising focus of MNCs on the mass to mid
premium segment).
Comparative valuations
Dabur
P/E (x)
P/BV (x)
EV/Sales (x)
EV/EBITDA (x)
FY13E
FY14E
FY13E
FY14E
FY13E
FY14E
FY13E
FY14E
29.8
23.8
10.3
8.5
3.7
3.1
22.4
18.3
Marico
28.0
22.3
5.9
4.8
2.6
2.1
18.9
15.0
GCPL
26.7
21.9
6.2
5.4
3.5
2.8
19.4
15.8
Sector view
We have a cautious view on the sector on back of
inflationary tendency, volatile input cost
environment and a possible slowdown in the rural
economy.
Companies with low competitive pressures and
broad product portfolios will be able to better with
stand any slowdown in a particular segment.
Longer term prospects bright, given rising incomes
and low penetration.
EPS: MOSL forecast v/s consensus (INR)
MOSL
Consensus
Forecast
Forecast
FY13
4.4
4.4
FY14
5.5
5.3
Variation
(%)
-0.4
4.0
Target Price and Recommendation
Current
Price (INR)
130
Target
Price (INR)
156
Upside
(%)
20
Reco.
Buy
Stock performance (1 year)
Shareholding pattern (%)
Promoter
Domestic Inst
Foreign
Others
31 January 2013
Dec-12
68.7
5.1
19.9
6.3
Sep-12
68.7
5.4
19.6
6.4
Dec-11
68.7
5.7
19.5
6.1
8

Dabur India
Financials and Valuation
31 January 2013
9

Disclosures
This report is for personal information of the authorized recipient and does not construe to be any investment, legal or taxation advice to you. This research report does not constitute an offer, invitation or inducement
to invest in securities or other investments and Motilal Oswal Securities Limited (hereinafter referred as MOSt) is not soliciting any action based upon it. This report is not for public distribution and has been
furnished to you solely for your information and should not be reproduced or redistributed to any other person in any form.
Unauthorized disclosure, use, dissemination or copying (either whole or partial) of this information, is prohibited. The person accessing this information specifically agrees to exempt MOSt or any of its affiliates
or employees from, any and all responsibility/liability arising from such misuse and agrees not to hold MOSt or any of its affiliates or employees responsible for any such misuse and further agrees to hold MOSt
or any of its affiliates or employees free and harmless from all losses, costs, damages, expenses that may be suffered by the person accessing this information due to any errors and delays.
The information contained herein is based on publicly available data or other sources believed to be reliable. While we would endeavour to update the information herein on reasonable basis, MOSt and/or its
affiliates are under no obligation to update the information. Also there may be regulatory, compliance, or other reasons that may prevent MOSt and/or its affiliates from doing so. MOSt or any of its affiliates or
employees shall not be in any way responsible and liable for any loss or damage that may arise to any person from any inadvertent error in the information contained in this report . MOSt or any of its affiliates
or employees do not provide, at any time, any express or implied warranty of any kind, regarding any matter pertaining to this report, including without limitation the implied warranties of merchantability, fitness
for a particular purpose, and non-infringement. The recipients of this report should rely on their own investigations.
This report is intended for distribution to institutional investors. Recipients who are not institutional investors should seek advice of their independent financial advisor prior to taking any investment decision
based on this report or for any necessary explanation of its contents.
MOSt and/or its affiliates and/or employees may have interests/positions, financial or otherwise in the securities mentioned in this report. To enhance transparency, MOSt has incorporated a Disclosure of Interest
Statement in this document. This should, however, not be treated as endorsement of the views expressed in the report.
Disclosure of Interest Statement
1. Analyst ownership of the stock
2. Group/Directors ownership of the stock
3. Broking relationship with company covered
4. Investment Banking relationship with company covered
Dabur India
No
No
No
No
Analyst Certification
The views expressed in this research report accurately reflect the personal views of the analyst(s) about the subject securities or issues, and no part of the compensation of the research analyst(s) was, is, or
will be directly or indirectly related to the specific recommendations and views expressed by research analyst(s) in this report. The research analysts, strategists, or research associates principally responsible
for preparation of MOSt research receive compensation based upon various factors, including quality of research, investor client feedback, stock picking, competitive factors and firm revenues.
Regional Disclosures (outside India)
This report is not directed or intended for distribution to or use by any person or entity resident in a state, country or any jurisdiction, where such distribution, publication, availability or use would be contrary to
law, regulation or which would subject MOSt & its group companies to registration or licensing requirements within such jurisdictions.
For U.K.
This report is intended for distribution only to persons having professional experience in matters relating to investments as described in Article 19 of the Financial Services and Markets Act 2000 (Financial
Promotion) Order 2005 (referred to as "investment professionals"). This document must not be acted on or relied on by persons who are not investment professionals. Any investment or investment activity to
which this document relates is only available to investment professionals and will be engaged in only with such persons.
For U.S.
Motilal Oswal Securities Limited (MOSL) is not a registered broker - dealer under the U.S. Securities Exchange Act of 1934, as amended (the"1934 act") and under applicable state laws in the United States.
In addition MOSL is not a registered investment adviser under the U.S. Investment Advisers Act of 1940, as amended (the "Advisers Act" and together with the 1934 Act, the "Acts), and under applicable state
laws in the United States. Accordingly, in the absence of specific exemption under the Acts, any brokerage and investment services provided by MOSL, including the products and services described herein
are not available to or intended for U.S. persons.
This report is intended for distribution only to "Major Institutional Investors" as defined by Rule 15a-6(b)(4) of the Exchange Act and interpretations thereof by SEC (henceforth referred to as "major institutional
investors"). This document must not be acted on or relied on by persons who are not major institutional investors. Any investment or investment activity to which this document relates is only available to major
institutional investors and will be engaged in only with major institutional investors. In reliance on the exemption from registration provided by Rule 15a-6 of the U.S. Securities Exchange Act of 1934, as amended
(the "Exchange Act") and interpretations thereof by the U.S. Securities and Exchange Commission ("SEC") in order to conduct business with Institutional Investors based in the U.S., MOSL has entered into
a chaperoning agreement with a U.S. registered broker-dealer, Motilal Oswal Securities International Private Limited. ("MOSIPL"). Any business interaction pursuant to this report will have to be executed within
the provisions of this chaperoning agreement.
The Research Analysts contributing to the report may not be registered /qualified as research analyst with FINRA. Such research analyst may not be associated persons of the U.S. registered broker-dealer,
MOSIPL, and therefore, may not be subject to NASD rule 2711 and NYSE Rule 472 restrictions on communication with a subject company, public appearances and trading securities held by a research analyst
account.
For Singapore
Motilal Oswal Capital Markets Singapore Pte Limited is acting as an exempt financial advisor under section 23(1)(f) of the Financial Advisers Act(FAA) read with regulation 17(1)(d) of the Financial Advisors
Regulations and is a subsidiary of Motilal Oswal Securities Limited in India. This research is distributed in Singapore by Motilal Oswal Capital Markets Singapore Pte Limited and it is only directed in Singapore
to accredited investors, as defined in the Financial Advisers Regulations and the Securities and Futures Act (Chapter 289), as amended from time to time.
In respect of any matter arising from or in connection with the research you could contact the following representatives of Motilal Oswal Capital Markets Singapore Pte Limited:
Nihar Oza
Kadambari Balachandran
Email: niharoza.sg@motilaloswal.com
Email : kadambari.balachandran@motilaloswal.com
Contact: (+65) 68189232
Contact: (+65) 68189233 / 65249115
Office address: 21 (Suite 31), 16 Collyer Quay, Singapore 049318
Motilal Oswal Securities Ltd
Motilal Oswal Tower, Level 9, Sayani Road, Prabhadevi, Mumbai 400 025
Phone: +91 22 3982 5500 E-mail: reports@motilaloswal.com