7 February 2013
3QFY13 Results Update |
Sector: Healthcare
Cipla
BSE Sensex
19,640
Bloomberg
Equity Shares (m)
M.Cap. (INR b)/(USD b)
52-Week Range (INR)
1,6,12 Rel. Perf. (%)
S&P CNX
5,959
CIPLA IN
802.9
325.2/6.1
435/287
-4/4/4
CMP: INR405
TP: INR452
Neutral
Financials & Valuation (INR b)
Y/E March
Sales
EBITDA
Net Profit
Adj. EPS (INR)
EPS Gr. (%)
BV/Sh. (INR)
RoE (%)
RoCE (%)
Payout (%)
Valuations
P/E (x)
P/BV (x)
EV/EBITDA (x)
Div. Yield (%)
2013E 2014E 2015E
83.0
22.0
13.5
16.8
20.2
110.5
15.2
22.6
20.0
24.0
3.7
14.8
0.8
89.7
22.4
15.8
19.7
16.8
125.2
15.7
20.7
25.0
20.6
3.2
14.5
1.0
102.6
25.6
18.2
22.6
14.9
142.2
15.9
21.4
25.0
17.9
2.8
12.7
1.2
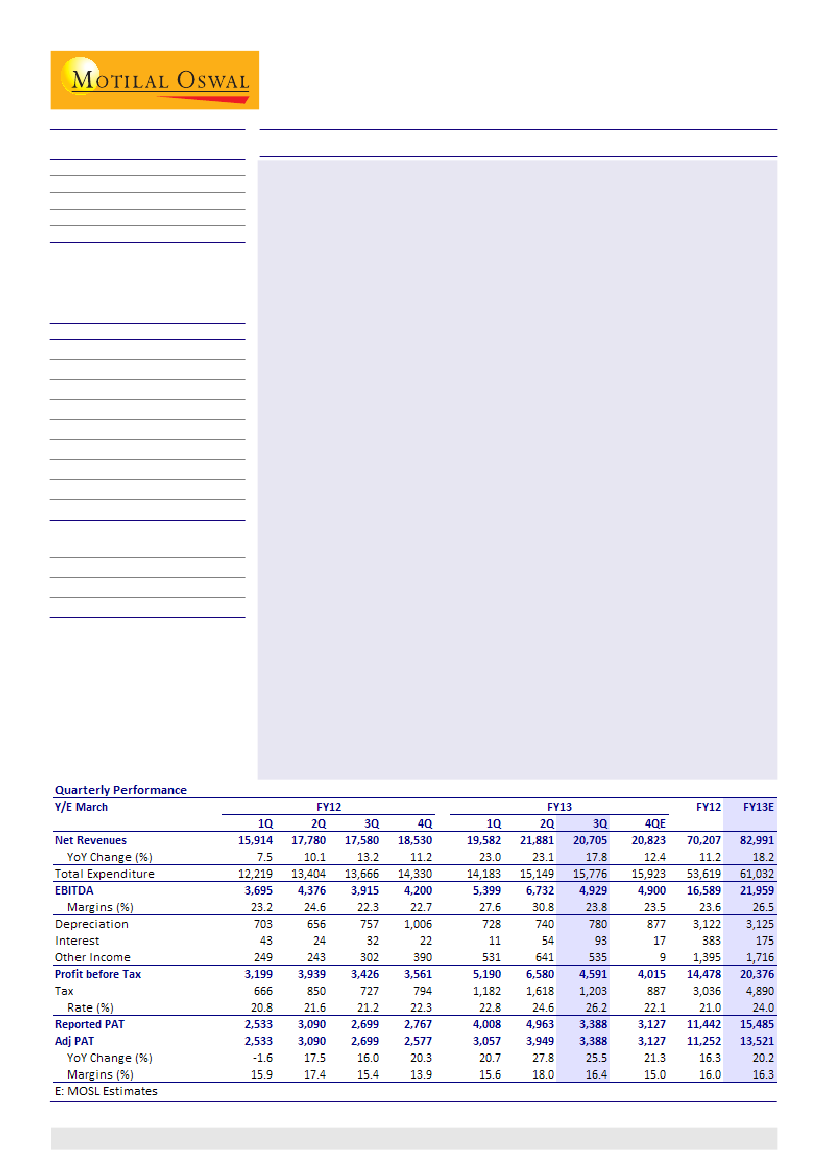
Revenues grew 18% YoY to INR20.71b (v/s est INR20.17b), EBITDA grew 26%
YoY to INR4.93b (v/s est INR4.71b) and PAT was up 26% to INR3.39b (v/s est
INR3.25b). Top line growth was primarily led by 38% YoY growth in export
formulations, while domestic formulations grew a modest 10% YoY. Export
APIs stood at INR1.38b and declined by 16% YoY on a high base.
We are positively surprised by the strong growth in export formulations,
driven by Lexapro supplies (now part of the base business) and strong growth
witnessed across key therapeutic areas. Also, there was a 6-7% benefit from
currency; however, management indicated that this high growth is not
sustainable, going forward. The muted domestic formulations growth of 10%
is below our expectation of 15%.
EBITDA margin increased 150bp YoY and stood at 23.8% (v/s our est of 23.3%).
Margin improvement was driven by favorable product mix, with higher
contribution from anti-depressants segment (includes generic Lexapro
supplies, now part of base business) and anti-allergics (includes Dymista,
currently a small contributor).
PAT growth was aided by strong top line growth coupled with healthy
operational performance. There was a forex gain of INR190m for the quarter.
While export formulations grew 38% YoY in 3QFY13, Cipla's core quarterly
performance has not been encouraging in the past many quarters. Its muted
export performance had raised uncertainty on the timelines of ramp-up at Indore
SEZ. We believe it is imperative for the company to improve asset utilization at
Indore to drive future growth and derive benefits of operating leverage
(overhead expenses continue to adversely impact performance). Post 3QFY13
performance, our core EPS est for FY13E has witnessed an upgrade of 2%, while
FY14E/15E est are largely unchanged. Our revised est take into account better-
than-expected performance in export formulations during this quarter, partially
offset by the muted growth in domestic formulations. The stock trades at 20.6x
FY14E and 17.9x FY15E EPS. Maintain
Neutral
with a TP of INR452 (20x FY15E EPS).
Hardick Bora
(Hardick.Bora@MotilalOswal.com)
Investors are advised to refer through disclosures made at the end of the Research Report.
1

Cipla
3QFY13 top line was in line with estimates
Cipla's revenues grew 17.8% YoY to INR20.7b (v/s estimate of INR20.17b), core EBITDA
grew 26% YoY to INR4.93b (v/s estimate INR4.71b) and PAT grew 25.5% to INR3.39b
(v/s estimate INR3.25b).
Top line growth was primarily led by 38% YoY growth in export formulations but
tempered down by a 10% growth in domestic formulations. API exports reported a
16% decline YoY to INR1.38b on account of a high base.
We are positively surprised by the strong growth in export formulations, driven by
Lexapro supplies (now part of the base business) and the strong growth witnessed
across key therapeutic areas. Also, there was a 6-7% benefit from currency; however,
management indicated that this high growth is not sustainable, going forward. The
muted domestic formulations growth of 10% is below our expectation of 15%.
Sales mix (INR m)
3Q
FY13
Domestic
9,240
% of revenues
45
Exports
11,067
% of revenues
53
Formulations
9,692
APIs
1,375
Other Oper. Income
398
% of revenues
2
Total Net Revenues
20,705
3Q
FY12
8,457
48
8,658
49
7,022
1,637
465
3
17,580
2Q
QoQ
FY13
(%)
9,294
(0.6)
42
27.8 12,127
(8.7)
55
38.0 10,389
(6.7)
(16.0)
1,738 (20.9)
(14.5)
460 (13.4)
2
17.8 21,881
-5.4
Source: Company, MOSL
YoY
(%)
9.3
EBITDA & EBITDA margin trend
Source: Company, MOSL
EBITDA above estimate aided by favorable product mix
EBITDA grew 26% YoY to INR4.93b (v/s est of 20.3% to INR4.71b). EBITDA margin
increased 150bp YoY and stood at 23.8% (v/s our est of 23.3%). This margin
improvement was driven by favorable product mix, with higher contribution from
anti-depressants segment (includes generic Lexapro supplies, now part of base
business) and anti-allergics (includes Dymista, currently a small contributor).
We believe the EBITDA contribution from generic Lexapro supplies, compared to
2QFY13, has reduced more than the reduction in its revenue contribution. This could
be attributed to the pressure on Teva's profitability after the 180-day exclusivity and
increased generic penetration in the escitalopram market.
PAT growth was aided by strong top line growth coupled with healthy operational
performance. There was a forex gain of INR190m for the quarter.
7 February 2013
2

Cipla
Management retains guidance for FY13
While the management did not specifically discuss the overall top line growth
guidance for FY13, it had earlier guided for 15% growth. Domestic formulations
are guided to grow by more than 15% YoY for the year and the management is
confident of sustaining this momentum in FY14.
EBITDA margin is expected to improve on account of better product mix and
positive impact of favorable currency. Management indicated that EBITDA margin
at 22-23% can be expected, going forward.
Tax rate guidance has been maintained for FY13/14 at 23-24%. Capex guidance has
been retained at INR5b for FY13, with INR3-4b guided for FY14. Forex hedges are
at USD210m.
FY13 Guidance
Business
Overall top line growth (%)
EBITDA margin (%)
Capex (INR b)
Revised guidance
Over 15%
Improved margins
5.0
Remarks
To be driven by 15%+ growth in domestic formulations. Growth in export
formulations to moderate, going forward
We estimate core EBITDA margin of 24-25%
Capex mainly directed towards API & R&D capacity expansion
Source: Company, MOSL
Domestic formulations record healthy 17% growth in 9MFY13 - unlikely to
sustain in coming quarters
Cipla is a dominant player in domestic formulations (DF) market, enjoying No. 2
ranking in the industry, supported by a field force of ~7,500 MRs. This business
contributes ~45-50% of its overall revenues and is a key earnings driver.
Company had reported 14% YoY growth in this business in FY12, post muted
performance in FY10 and FY11. After reporting a strong growth of 22% for 1HFY13,
the business recorded a muted 10% growth this quarter.
The strong growth recorded in 1HFY13 is unlikely to recur, also confirmed by the
management. Company has guided for 15%+ YoY growth for this business for FY13
and expects to maintain 14-15% growth in FY14. We have cut our growth estimate
to 15% for this business for FY13E (down from 18%) and have retained 14% growth
for FY14E/15E.
Management did not indicate the potential impact of the drug pricing policy on its
domestic business and will await the formal implementation of the policy before
sharing details.
Cipla - Domestic Formulations (DF) - Revenue Ramp-up
Source: Company, MOSL
7 February 2013
3

Cipla
Core export formulations to show moderate growth in future
Despite the strong 38% YoY growth in 3QFY13, Cipla's core quarterly performance
in export formulations has not been encouraging in the past many quarters. This
was particularly disappointing given favorable currency (Cipla does not have very
high hedges). Management also indicated that the high growth reported in this
quarter will not sustain, going forward.
There are ~76 approvals for ANDA filed along with its partners, of which 60% have
been commercialized. While there are another 23 ANDAs under the registration
process, we believe their commercialization will take another 2-3 years.
Management indicated that it continues with the product-cum-geographical
rationalization of this business to ensure focus only on profitable products/
geographies. While profitable rationalization is a long term positive, we are
cautious on this business and have factored a moderate growth rate of 15%/16%
for FY14E/15E. We note the strong growth so far in FY13 has mainly been driven by
one-off supplies of generic Lexapro.
Cipla's Export Formulation - Muted Quarterly Performance…
...Moderate growth expected ahead
Note-4QFY12 & 1HFY13 includes one-time supplies of generic Lexapro
Source: Company, MOSL
Indore SEZ approved by US FDA - A step towards building own front-end in
US
Management is planning direct entry into the US market; till date it accessed the
US market through partnerships.
We believe that Cipla will be a very late entrant in the US and hence may not be
able to generate adequate returns. The recent approval (received in 2QFY13) of
the Indore SEZ by the US FDA will facilitate Cipla's entry in the US as it plans to file
ANDAs from this facility in its own name, compared to the previous practice of
filing through partners.
Company has already filed 5 ANDAs till date.
Dymista opportunity - Will take time to scale up
Cipla's Swedish partner, Meda, had received final US FDA approval for Dymista in
May-12. Dymista is a nasal spray and consists of a combination of Azelastine HCl
and Fluticasone Proprionate and is useful in treating seasonal allergic rhinitis. It
reduces the quantum of allergy medicines that a patient needs to consume and
offers better efficacy compared to traditional first-line treatments. The US patent
office has issued two patents for Dymista expiring in 2023 and 2026.
4
7 February 2013

Cipla
Cipla is a development-cum-manufacturing partner for Meda for Dymista. The
partnership covers many markets, including the US. Cipla recently started supplies
to support the US sales and Meda is expected to launch the product in the European
market within the next two quarters.
A few reports indicate that Dymista can generate annual revenues of USD350m in
the US by 2016 for Meda. Cipla is likely to benefit as it will be supplying the global
requirements for Dymista, including that for the US. While this may not entail any
significant upside in the near term for Cipla (management has guided it expects it
to be a USD25-30m revenue opportunity over the next few years), we view it as a
long term positive for Cipla.
Cipla Medpro South Africa (CMSA) acquisition - to provide front-end in South
Africa
Cipla had earlier proposed to acquire Cipla Medpro South Africa (CMSA) for
USD220m, valuing Cipla-Medpro at 7.7x and 6.8x EV/EBITDA for CY12 and CY13
respectively based on Bloomberg consensus estimates for CMSA. For CY11, it had
reported revenues of USD244m, EBITDA of USD74m (EBITDA margins of 30.4%)
and PAT of USD50m.
This proposed acquisition will require various government and other approvals.
CMSA is one of South Africa's top 10 pharmaceutical groups. The group's operations
comprise of two divisions: 1) selling chronic and OTC medicines to the public and
private sector and 2) contract manufacturing services.
In Nov-12, and post Cipla (India)'s proposal, Cipla Medpro won a contract from the
African Government to supply AIDS drugs. This delayed the acquisition as both
the parties are now reconsidering the originally proposed terms of the acquisition.
We await further clarity from the management on the way forward.
We do not expect significant upside from this acquisition in the near term. CMSA
has intangibles of USD170-180m which account for almost 50% of its total assets
and will reflect on Cipla's balance sheet.
Cipla Medpro - Key Financials
(INR M)
INR/USD
Sales
YoY Growth (%)
EBITDA
EBITDA Margins (%)
PAT
YoY Growth (%)
ROCE (%)
RoE (%)
CY11
48
11,747
3,565
30.4
2,400
19.7
15.1
CY12E
54.5
13,467
14.6
3,206
23.8
1,936
-19.3
17.8
14.6
CY13E
53
15,329
13.8
3,656
23.8
2,318
19.7
15.4
CY14E
53
16,835
9.8
4,033
24.0
2,652
14.4
15.8
Source: Bloomberg
7 February 2013
5

Cipla
Valuation and view
While export formulations grew 38% YoY in 3QFY13, Cipla's core quarterly performance
has not been encouraging in the past many quarters. Its muted export performance
had raised uncertainty on the timelines of ramp-up at Indore SEZ. While this facility
recently got approved by the USFDA, Cipla expects to generate sales of INR6b from
this facility in FY13 (same as in FY12). Although the large capex (for past few years) is
a long term positive, we believe it is imperative for the company to improve asset
utilization at Indore to drive future growth and derive benefits of operating leverage
(overhead expenses continue to adversely impact performance).
Post 3QFY13 performance, our core EPS estimates for FY13E has witnessed an upgrade
of 2% while FY14E/15E estimates are largely unchanged. Our revised estimates take
into account better-than-expected performance in export formulations during this
quarter, but the muted growth in domestic formulations has offset this upside. We
estimate core EPS of INR19.7 for FY14E (up 17% YoY) and INR22.6 for FY15E (up 16%
YoY). Based on our revised estimates, the stock trades at 20.6x FY14E and 17.9x FY15E
earnings. We maintain
Neutral
with a target price of INR452 (20x FY15E EPS), 12%
upside.
7 February 2013
6

Cipla
Cipla: an investment profile
Company description
Cipla is the largest player in the domestic formulations
market and has a presence across most therapeutic
areas. Company also has robust exports to several
markets, including the US, Europe, South Africa, Australia
and the Middle East. Cipla's strategy for regulated
markets (Europe and the US) exports is built around
supply tie-ups with global players.
Recent developments
Proposes to acquire 51% stake in Cipla Medpro South
Africa.
Cipla Medpro wins AIDS drug contract from the
African Government.
Sector view
Differentiated portfolio in the US and emerging
markets would remain the key sales and profit
drivers in the medium term. Japan is expected to
emerge as the next growth driver, particularly for
companies with a direct marketing presence.
We are overweight on companies that are towards
the end of the investment phase, with benefits
expected to start coming from the next fiscal.
Key investment arguments
Strong capex of past years yet to be fully utilized - a
long term positive.
Commencement of exports of CFC-free inhalers to
Europe will be a key positive; Cipla has the third
largest capacity of inhalers in the world and could
be a key beneficiary of the unfolding opportunity in
the long term.
Valuation and view
While export formulations grew 38% YoY in 3QFY13,
Cipla's core quarterly performance has not been
encouraging in the past many quarters.
Its muted export performance raises uncertainty on
the timelines of ramp-up at Indore SEZ
Based on our revised estimates, the stock trades at
20.6x FY14E and 17.9x FY15E earnings. We maintain
Neutral
with a target price of INR452 (20x FY15E EPS).
Key investment risks
NPPA liability of INR16b (if it materializes) could
result in a significant one-time cash outflow.
The new pharmaceutical policy (proposed) has
raised uncertainties regarding pricing of drugs in
India. Further clarity on this is awaited.
Cipla is planning to establish front-ends in some of
the key markets - this could involve upfront
investments and long gestation.
Comparative valuations
Cipla
P/E (x)
P/BV (x)
EV/Sales (x)
EV/EBITDA (x)
FY14E
FY15E
FY14E
FY15E
FY14E
FY15E
FY14E
FY15E
20.6
17.9
3.2
2.8
3.6
3.2
14.5
12.7
DRL
17.1
15.7
4.0
3.7
2.9
2.9
14.1
12.2
Ranbaxy
16.9
13.8
2.7
2.3
1.9
1.7
13.7
11.5
EPS: MOSL forecast v/s consensus (INR)
MOSL
Forecast
FY13
FY14
16.8
19.7
Consensus
Forecast
19.2
20.7
Variation
(%)
-12.3
-4.7
Target Price and Recommendation
Current
Target
Price (INR)
Price (INR)
405
452
Upside
(%)
11.6
Reco.
Neutral
Stock performance (1 year)
Shareholding pattern (%)
Dec-12
Promoter
Domestic Inst
Foreign
Others
7 February 2013
36.8
11.8
26.2
25.2
Sep-12
36.8
13.4
24.4
25.4
Dec-11
36.8
20.4
16.5
26.3
7

Cipla
Financials and Valuation
7 February 2013
8

Cipla
N O T E S
7 February 2013
9

Disclosures
This report is for personal information of the authorized recipient and does not construe to be any investment, legal or taxation advice to you. This research report does not constitute an offer, invitation or inducement
to invest in securities or other investments and Motilal Oswal Securities Limited (hereinafter referred as MOSt) is not soliciting any action based upon it. This report is not for public distribution and has been
furnished to you solely for your information and should not be reproduced or redistributed to any other person in any form.
Unauthorized disclosure, use, dissemination or copying (either whole or partial) of this information, is prohibited. The person accessing this information specifically agrees to exempt MOSt or any of its affiliates
or employees from, any and all responsibility/liability arising from such misuse and agrees not to hold MOSt or any of its affiliates or employees responsible for any such misuse and further agrees to hold MOSt
or any of its affiliates or employees free and harmless from all losses, costs, damages, expenses that may be suffered by the person accessing this information due to any errors and delays.
The information contained herein is based on publicly available data or other sources believed to be reliable. While we would endeavour to update the information herein on reasonable basis, MOSt and/or its
affiliates are under no obligation to update the information. Also there may be regulatory, compliance, or other reasons that may prevent MOSt and/or its affiliates from doing so. MOSt or any of its affiliates or
employees shall not be in any way responsible and liable for any loss or damage that may arise to any person from any inadvertent error in the information contained in this report . MOSt or any of its affiliates
or employees do not provide, at any time, any express or implied warranty of any kind, regarding any matter pertaining to this report, including without limitation the implied warranties of merchantability, fitness
for a particular purpose, and non-infringement. The recipients of this report should rely on their own investigations.
This report is intended for distribution to institutional investors. Recipients who are not institutional investors should seek advice of their independent financial advisor prior to taking any investment decision
based on this report or for any necessary explanation of its contents.
MOSt and/or its affiliates and/or employees may have interests/positions, financial or otherwise in the securities mentioned in this report. To enhance transparency, MOSt has incorporated a Disclosure of Interest
Statement in this document. This should, however, not be treated as endorsement of the views expressed in the report.
Disclosure of Interest Statement
1. Analyst ownership of the stock
2. Group/Directors ownership of the stock
3. Broking relationship with company covered
4. Investment Banking relationship with company covered
Cipla
No
No
No
No
Analyst Certification
The views expressed in this research report accurately reflect the personal views of the analyst(s) about the subject securities or issues, and no part of the compensation of the research analyst(s) was, is, or
will be directly or indirectly related to the specific recommendations and views expressed by research analyst(s) in this report. The research analysts, strategists, or research associates principally responsible
for preparation of MOSt research receive compensation based upon various factors, including quality of research, investor client feedback, stock picking, competitive factors and firm revenues.
Regional Disclosures (outside India)
This report is not directed or intended for distribution to or use by any person or entity resident in a state, country or any jurisdiction, where such distribution, publication, availability or use would be contrary to
law, regulation or which would subject MOSt & its group companies to registration or licensing requirements within such jurisdictions.
For U.K.
This report is intended for distribution only to persons having professional experience in matters relating to investments as described in Article 19 of the Financial Services and Markets Act 2000 (Financial
Promotion) Order 2005 (referred to as "investment professionals"). This document must not be acted on or relied on by persons who are not investment professionals. Any investment or investment activity to
which this document relates is only available to investment professionals and will be engaged in only with such persons.
For U.S.
Motilal Oswal Securities Limited (MOSL) is not a registered broker - dealer under the U.S. Securities Exchange Act of 1934, as amended (the"1934 act") and under applicable state laws in the United States.
In addition MOSL is not a registered investment adviser under the U.S. Investment Advisers Act of 1940, as amended (the "Advisers Act" and together with the 1934 Act, the "Acts), and under applicable state
laws in the United States. Accordingly, in the absence of specific exemption under the Acts, any brokerage and investment services provided by MOSL, including the products and services described herein
are not available to or intended for U.S. persons.
This report is intended for distribution only to "Major Institutional Investors" as defined by Rule 15a-6(b)(4) of the Exchange Act and interpretations thereof by SEC (henceforth referred to as "major institutional
investors"). This document must not be acted on or relied on by persons who are not major institutional investors. Any investment or investment activity to which this document relates is only available to major
institutional investors and will be engaged in only with major institutional investors. In reliance on the exemption from registration provided by Rule 15a-6 of the U.S. Securities Exchange Act of 1934, as amended
(the "Exchange Act") and interpretations thereof by the U.S. Securities and Exchange Commission ("SEC") in order to conduct business with Institutional Investors based in the U.S., MOSL has entered into
a chaperoning agreement with a U.S. registered broker-dealer, Motilal Oswal Securities International Private Limited. ("MOSIPL"). Any business interaction pursuant to this report will have to be executed within
the provisions of this chaperoning agreement.
The Research Analysts contributing to the report may not be registered /qualified as research analyst with FINRA. Such research analyst may not be associated persons of the U.S. registered broker-dealer,
MOSIPL, and therefore, may not be subject to NASD rule 2711 and NYSE Rule 472 restrictions on communication with a subject company, public appearances and trading securities held by a research analyst
account.
For Singapore
Motilal Oswal Capital Markets Singapore Pte Limited is acting as an exempt financial advisor under section 23(1)(f) of the Financial Advisers Act(FAA) read with regulation 17(1)(d) of the Financial Advisors
Regulations and is a subsidiary of Motilal Oswal Securities Limited in India. This research is distributed in Singapore by Motilal Oswal Capital Markets Singapore Pte Limited and it is only directed in Singapore
to accredited investors, as defined in the Financial Advisers Regulations and the Securities and Futures Act (Chapter 289), as amended from time to time.
In respect of any matter arising from or in connection with the research you could contact the following representatives of Motilal Oswal Capital Markets Singapore Pte Limited:
Nihar Oza
Kadambari Balachandran
Email: niharoza.sg@motilaloswal.com
Email : kadambari.balachandran@motilaloswal.com
Contact: (+65) 68189232
Contact: (+65) 68189233 / 65249115
Office address: 21 (Suite 31), 16 Collyer Quay, Singapore 049318
Motilal Oswal Securities Ltd
Motilal Oswal Tower, Level 9, Sayani Road, Prabhadevi, Mumbai 400 025
Phone: +91 22 3982 5500 E-mail: reports@motilaloswal.com