WEEK IN A NUTSHELL
WIN-dow to the week that was
Week in a Nutshell (WIN)
Week
ended
th
8 Feb 2013
Key WIN-dicators
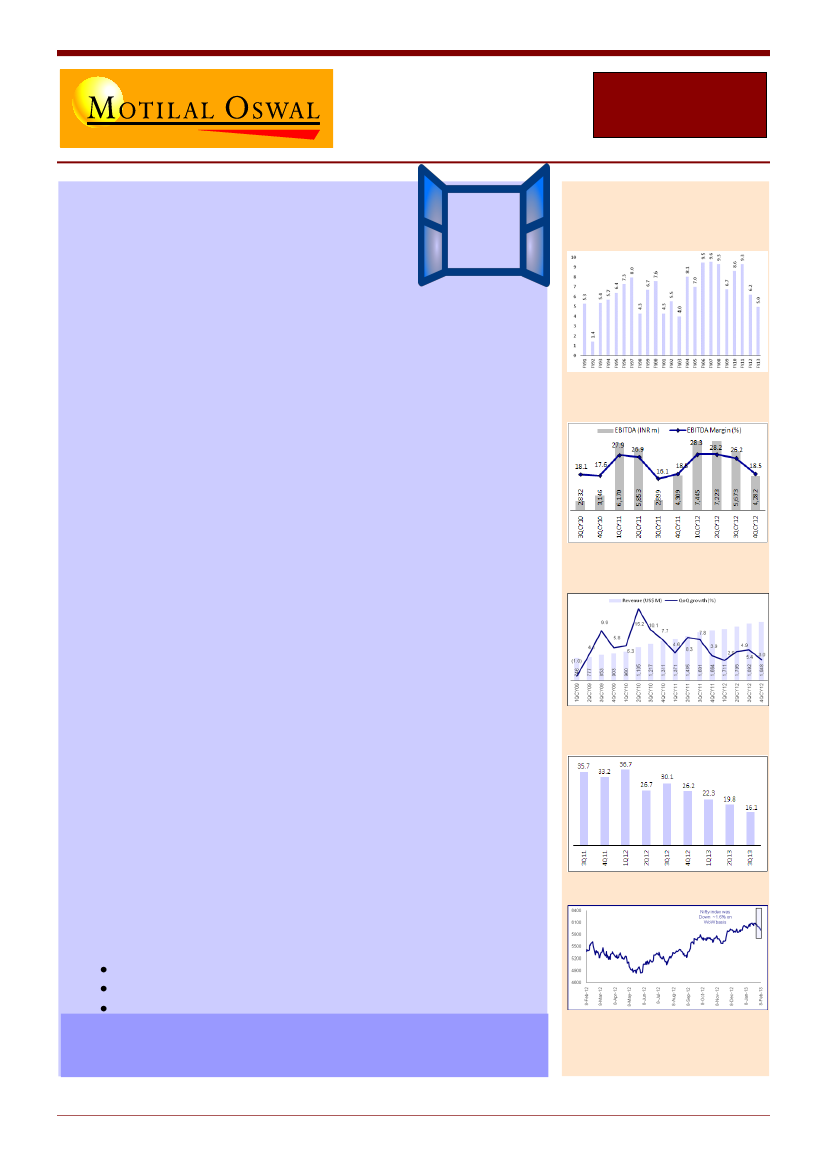
GDP growth is the lowest in a
decade
Another one came and went. One of the largest offerings in recent times
was lapped up in bigger proportions than expected. Subscription of 1.7x
for NTPC. The GoI has done a fantastic job in managing the last two
issuances – Oil India and NTPC. HOOK of extensive meetings, LINE of
reform announcements and SINKER of cheap valuations. All said and
done, finally kudos to the government.
Indian markets have seen issuance of a staggering USD 4.5 Bn this Calendar
Year. FII Inflows of USD 6 Bn and DII Outflows of USD 4.2 Bn. Will the retail
investor ever come back!
RBI released its final recommendation on gold import in India. The focus
was clearly on curbing gold import for non economic purpose.
The
possibility of linking import of metal to base rate can severely impact
working capital and margins for the jewellery companies in India. Gold
lending NBFCs’ existence was not questioned while the need for controls
and slowdown in growth was focussed on.
Coal Price Pooling
approval means Coal India is now liable to supply 68% of
total coal requirement for the identified projects below which they would
have to cough up penalties. This ensures safety net for the debt holders
while returns for equity holders is still a question mark
BHARTI
continued to disappoint with India business lagging Idea and Africa
profitability continuing to struggle. The only silver lightning was the net
debt declining from INR668b to INR643b
URBAN CONSUMPTION
continued to show signs of slow down with
Jubilant’s SSSG at a 14 quarter low and margin contraction of 120 bps YoY.
SPECIALITY restaurants faced the same issue with Q3 topline growth at 14%
and EBITDA de-growth.
HOLCIM major companies
reported the worst among the peer set with
both profitability and volume growth impacted. The possibility of increase
in royalty post 2014 can impact the long term multiples for the companies
Some of the highlights of this edition:
Coal Price Pooling:
Financials & Utilities impact
Financial Technologies:
Initiating Coverage
Result Notes
Ambuja Cement: Trend in
profitability
Cognizant: Revenue beat
guidance
Jubilant: SSS growth dips to 16.1%
(lowest in 14 quarters)
Nifty (-1.6%)
WWW – WIN Weekend Wisdom
In the stock market, luck never gives, it only lends
WIN – Week In a Nutshell
1
8
th
Feb
2013

WEEK IN A NUTSHELL
WEEK IN A NUTSHELL
[W]INside this week’s edition
WIN-teresting data points ................................................................................................................................... 4
Results expected this week ............................................................................................................................................. 5
Concall Details ................................................................................................................................................................. 5
WIN-ning charts & chats ..................................................................................................................................... 6
GDP forecasts - Economist .............................................................................................................................................. 6
WIN-conomics .................................................................................................................................................... 7
ECONOMICS: FY13 GDP growth slip to decadal low of 5%, slowdown across sectors; demand deficit ......................... 7
WIN-sights from management interaction ........................................................................................................... 8
Bajaj Auto - Rajiv Bajaj, MD ............................................................................................................................................. 8
Berger Paints - Abhijit Roy, CEO ...................................................................................................................................... 8
Ipca Laboratories - AK Jain, ED ........................................................................................................................................ 8
Onmobile Global - Mouli Raman, Co-Founder & MD ...................................................................................................... 8
Power Finance Corporation -Satnam Singh, CMD ........................................................................................................... 8
WIN Sector Updates............................................................................................................................................ 9
BANKING: Loan (16%) and Deposit (13.1%) gr. remain stable ........................................................................................ 9
FINANCIALS: Positive news flows for power financiers ................................................................................................... 9
METALS WEEKLY: Indian steel prices still weak; global iron ore and coking coal prices are up ..................................... 9
mPower (January 2013): Monthly round-up of power utilities....................................................................................... 9
UTILITIES: In-principle approval for coal price pooling, details hold key ...................................................................... 10
WIN Corporate Corner ...................................................................................................................................... 11
ACC 4QCY12: EBIDTA below est at INR530/ton; higher other inc, lower tax boosts PAT; Cutting EPS 5-9% ............... 11
AMBUJA 4QCY12: Below est. impacted by lower volumes, higher depn, tax and interest; Cutting EPS 7% ................ 11
ANANT RAJ 3QFY13: Beats est. due to revenue booking at Golf Course project; rental deteriorates ......................... 11
ASHOK LEYLAND: Jan-13 above est: MHCVs in-line at 6,863 units (-25% YoY); Dost above est at 3,698 ..................... 12
BAJAJ AUTO: Below est at 347,624 (+3% YoY v/s est 357,000), impacted by muted domestic 2Ws............................ 12
BANK OF BARODA: Below estimates; Asset quality under pressure; Growth and margins disappoints ...................... 12
BHEL 3QFY13: Operating performance below estimates; bidding pipeline improving; Maintain Neutral ................... 13
CIPLA 3QFY13: Operational performance driven by favourable product mix; EPS largely unchanged ........................ 13
COGNIZANT 4QCY12: Revenue in line; CY13 organic growth guidance of 15.8% ......................................................... 14
CORP BANK 3QFY13: Asset quality disappoints; NIM improves QoQ but still lowest amongst peers .......................... 14
DIVI'S LABS 3QFY13: Operational performance below estimates due to unfavorable product mix ............................ 14
FIN TECH: Initiating coverage - Incubating success; potential to create multiple MCXs; 27% Upside.......................... 14
HERO MOTO: Above est at 557,797 (+7% YoY); Highest ever volumes driven by new launches ................................. 15
IDFC 3QFY13: Inline; Growth moderates; Spread and asset quality stable QoQ; Significant cost control ................... 15
WIN – Week In a Nutshell
2
8
th
Feb
2013

WEEK IN A NUTSHELL
WEEK IN A NUTSHELL
INDIAN BANK 3QFY13: Below est.; Weak core performance; Sharp deterioration in asset quality ............................. 16
IRB INFRASTRUCTURE 3QFY13: Led by EPC business, Traffic growth remains muted .................................................. 16
JK LAKSHMI 3QFY13: EBITDA down INR149/ton QoQ led by decline in realn; cutting TP ............................................ 16
J&K BANK 3QFY13: Strong NIM performance; Slippages contained but high restructuring; PCR at 94% .................... 17
JK CEMENT 3QFY13: Robust white cement segment drove margin expansion; upgrading EPS by 3-10% ................... 17
Jubilant Foodworks 3QFY13: Below expectations; SSS at 14 quarter low; cut estimates; Neutral .............................. 17
MANAPPURAM FINANCE 3QFY12: Disappointing performance; NIM contraction, growth moderation ..................... 18
MARICO 3QFY13: Slight moderation in volume growth; impressive share gains; downgrade to NEUTRAL ................ 18
MCX 3QFY13: Operationally in line, PAT above estimate on higher other income; Market share inches up .............. 19
NHPC 3QFY13: Optg performance marginally better, Tax rate higher due to deferred tax ......................................... 19
NMDC: Near term pressure on prices of lumps, but fines are selling at premium; Valuations compelling ................. 20
NTPC: 5 Key Success Factors in place – Capacity, Fuel, Generation, Earnings, Valuation ............................................ 20
REC 3QFY13: Above estimates, NIMs surprise, Growth & asset quality healthy, Upgrade EPS 5-7%........................... 20
SHREE RENUKA 3QFY13: Higher refinery volume, cogen segment drove domestic revenue....................................... 21
SUN PHARMA: Taro Pharma continues to report strong operational performance on a high base ............................ 21
SUN PHARMA: Receives FDA approval for Doxil; incrementally positive ..................................................................... 21
TECH MAHINDRA 3QFY13: Above estimates; Deal wins to keep growth going ............................................................ 21
United Spirits 3QFY13: Results largely in-line; premiumization story working ............................................................ 22
WIN Collage ...................................................................................................................................................... 23
A tale of two Davoses .................................................................................................................................................... 23
Nifty Valuations at a glance............................................................................................................................... 25
WIN – Week In a Nutshell
3
8
th
Feb
2013

WEEK IN A NUTSHELL
WEEK IN A NUTSHELL
WIN-teresting data points
Global
Indices
Sensex
Nikkei
Hang Seng
Dow Jones
FTSE 100
Sectoral
Indices
Bank Nifty
CNX IT
BSE Oil
12606
6753
9375
12280
6853
9017
-2.59
1.48
-4
WoW
change
(%)
1.30
-0.76
13.91
15.01
10.55
Last
week
19781
11191
23722
14010
6347
Current
week
19485
11153
23215
13944
6258
WoW
change
(%)
-1.50
-0.34
-2.14
-0.47
-1.41
P/E Valuations
16.26
25.39
11.61
13.22
15.24
Inflows
FII (Rs B)
DII (Rs B)
Commodities
Oil(US$/Bbl)
Precious Metals
Gold ($/OZ)
Silver ($/OZ)
Metals
Copper(US$/MT)
Zinc(US$/MT)
Aluminum(US$/MT)
Bond yields-
India
1 Year
10 Year
Last
Friday
7.83
7.91
Spread Vs US
10 yrs
7.79
5.90
Currency
Rs Vs Dollar
Euro Vs Dollar
53.20
1.36
53.58
1.34
0.72
-1.74
8255
2156
2088
8165
2140
2061
-1.09
-0.75
-1.31
1667
32
1670
31
0.16
-1.03
MTD
98.15
-38.44
Last week
116.54
YTD
(Calendar)
320.44
-213.86
This week
117.3
WoW change
(%)
0.65
This week
7.93
7.85
BSE 500 – Key Movers
Top Gainers
Company Name
Zylog Systems
Arshiya International
Power Finance
Hexaware
Exide
TCS
% Change
26%
14%
7%
6%
6%
6%
Top Losers
Company Name
% Change
Opto Circuits
15%
SKS Microfinance
Tube Investments
Manappuram
Bombay Dyeing
JP Associates
14%
13%
13%
13%
12%
WIN – Week In a Nutshell
4
8
th
Feb
2013

WEEK IN A NUTSHELL
WEEK IN A NUTSHELL
Results expected this week
Company
JPASSOCIAT
ONGC
TATAPOWER
HINDPETRO
JINDALSTEL
POWERGRID
SAIL
BPCL
COALINDIA
IOC
JSWSTEEL
NMDC
TATASTEEL
UNITECH
DLF
DRREDDY
GAIL
HDIL
LICHSGFIN
SBIN
SUZLON
TATAMOTORS
BGRENERGY
Birla Corp
Date
11-Feb-13
11-Feb-13
11-Feb-13
12-Feb-13
12-Feb-13
12-Feb-13
12-Feb-13
13-Feb-13
13-Feb-13
13-Feb-13
13-Feb-13
13-Feb-13
13-Feb-13
13-Feb-13
14-Feb-13
14-Feb-13
14-Feb-13
14-Feb-13
14-Feb-13
14-Feb-13
14-Feb-13
14-Feb-13
8-Feb-13
8-Feb-13
Company
IGL
TATACOMM
Britannia
Dishman
Heidelberg
HEXAWARE
HMVL
INDHOTEL
PUNJLLOYD
VOLTAS
CESC
CHENNPETRO
Eichermot
HTMedia
IFCI
OIL
OPTOCIRCUI
PTC
Abirlanuvo
India Cem
IVRCLINFRA
Gskcons
BATAINDIA
MPHASIS
Date
9-Feb-13
9-Feb-13
11-Feb-13
11-Feb-13
11-Feb-13
11-Feb-13
11-Feb-13
11-Feb-13
11-Feb-13
11-Feb-13
12-Feb-13
12-Feb-13
12-Feb-13
12-Feb-13
12-Feb-13
12-Feb-13
12-Feb-13
13-Feb-13
14-Feb-13
14-Feb-13
14-Feb-13
15-Feb-13
26-Feb-13
28-Feb-13
Concall Details
Date
11-Feb-13
11-Feb-13
11-Feb-13
11-Feb-13
11-Feb-13
11-Feb-13
11-Feb-13
11-Feb-13
11-Feb-13
12-Feb-13
12-Feb-13
12-Feb-13
13-Feb-13
13-Feb-13
13-Feb-13
14-Feb-13
14-Feb-13
14-Feb-13
14-Feb-13
14-Feb-13
14-Feb-13
14-Feb-13
15-Feb-13
Company Name
Hathway Cable
Tata Communications
Shasun Pharmaceuticals
AIA Engineering Limited
City Union Bank
GMR Infra
VA Tech Wabag Ltd
Dishman Pharma
Tata Power
Punj Llyod
Motherson Sumi Systems
Novelis Inc
Sonata
LANCO INFRATECH LTD
Britannia Industries
PTC India Limited
Aditya Birla Nuvo Ltd
FSL
State Bank of India
Tata Motors
Dr. Reddy's Laboratories
Tata Motors (JLR)
State Bank of India
Time IST
11.00 am
2.00 pm
3.30 pm
4.00 pm
4.00 pm
4.00 pm
4.00 pm
5.15 pm
5.30 pm
12.00 pm
4.30 pm
7.30 pm
11.30 am
12.00
3.30 pm
12.30 pm
4.30 pm
5.00 pm
5.00 pm
5.45 pm
6.30 pm
7.00 pm
4.00 pm
Analyst Meet
/ Concall
Concall
Concall
Analyst Meet
Concall
Concall
Concall
Concall
Concall
Concall
Concall
Concall
Concall
Concall
Concall
Analyst Meet
Concall
Concall
Concall
Analyst Meet
Concall
Concall
Concall
Concall
5
Venue / Dial In No : Mumbai
+91 22 3065 0140 / 6629 0360
+91 22 61501761 / 61501507
Taj- President, Cuffe Parade, Mumbai
+91 22 67934400 / 67914400 / 99
+91 22 6629 0386 / 3065 0160
+91 22 66290301 / 3065122
+91 22 6629 5859 / 3065 2519
+91 22 44449999
+91 22 6629 0082 / 3065 0082
+91 22 66290091 / 3065 0091
+91 22 6629 0282 / 3065 2496
+0008001007108 (Toll Free)
+91 22 66290560 / 30652513
+91 22 3065 0020 / 6629 0048
Four Seasons Hotel, Worli, Mumbai
+91 22 6629 0308 / 3065 0108
+ 91 22 6629 0359 / 3065 0139
+91 22 66290335 / 30650124
State Bank Auditorium
+91 22 30650072 / 66290072
+91 22 3065 0136 / 6629 0356
+91 22 6629 0044 / 3065 0079
+91 22 6629 0302 / 3065 0102
8
th
Feb
2013
WIN – Week In a Nutshell

WEEK IN A NUTSHELL
WEEK IN A NUTSHELL
WIN-ning charts & chats
GDP forecasts - Economist
EACH month we poll a group of economic forecasters and then calculate their average predictions for GDP growth.
Our latest poll shows that our panellists have become generally more pessimistic over the last six months about
prospects for growth this year, (see this month's poll). Opinions always vary, and this month the Netherlands has
the biggest range of forecasts, the lowest being a contraction of 1.3% and the highest an expansion of 0.3%. This
week the Netherlands had the outlook on its AAA rating cut from stable to negative by Fitch, a ratings agency, on
the basis of falling house prices and concerns about the banking system. Together with Spain, the Netherlands has
suffered the biggest losses of confidence with average predictions almost one percentage point lower than they
were last August. Spain has had four consecutive quarters of contraction.
WIN – Week In a Nutshell
6
8
th
Feb
2013

WEEK IN A NUTSHELL
WEEK IN A NUTSHELL
WIN-conomics
ECONOMICS: FY13 GDP growth slip to decadal low of 5%, slowdown across sectors; demand deficit
FY13 advance estimate for GDP growth has been placed at 5.0% - the lowest in a decade and represent sharp
slowdown from 9.3% of FY11 and 6.2% in FY12.
All three components of GDP, viz., agriculture, industry and services displayed YoY slowdown. Industry in
particular registered their third lowest growth rate in two decades while services growth was the lowest in 12
years.
The two large high growing sub-sectors of GDP, viz., Construction (wt:8%) within the industry group and Trade,
Hotel, Transport and Communication (wt: 28%) within services slowed down to less than half the growth rate of
their boom period average during FY04-FY08.
Clearly establishing the demand deficiency as the reason behind slowdown, GDP measured from expenditure
side grew by a meagre 3.3% with consumption growth of both private and government sector nearly halving
from their FY12 levels. While fixed capital formation too displayed slower growth inventories shot up – a further
pointer to the slowdown.
The nominal GDP showed a weaker growth of 11.7% in FY13 vs. 15.1% of FY12 despite accounting for 8%+
inflation. This would lend an upward bias to key macro-economic ratios including fiscal deficit to GDP.
A 14% drop in exchange rate resulted in an actual decline in GDP in USD terms to 1,845b from 1,873b of FY12.
Again, this would lend an upward bias to the CAD/GDP ratio.
The latest data release point to the need for further policy stimulus to revive growth. Government has taken
various reform measures to revive investment climate and also re-prioritizing it expenditure towards
investment to kickstart private capex, critical growth revival. The latest growth estimate also fall short of RBI’s
estimate by a good 50bp and would create headroom for further monetary easing if inflation continues to ease.
We have placed our FY14 growth estimate at 6.5%.
WIN – Week In a Nutshell
7
8
th
Feb
2013

WEEK IN A NUTSHELL
WEEK IN A NUTSHELL
WIN-sights from management interaction
Bajaj Auto - Rajiv Bajaj, MD
No doubt the market is flat. Post-festive there is no pick up really. Most manufacturers had little elbowroom in
December to put some stock into the dealerships.
The billing is a little less than what we have retailed. So if we put the two months together we see that there is
5-7 percent growth
Discover 100 - Except to say that I have a good feedback from the market, I do not have much more in terms of
consumer response.
However, these two months will be very important. February will be a month when we will try to push volumes
up and we will rollout the communication.
If that works then based on the platform of the new Discover 100T we have a couple of big launches in the next
six months in the 100cc space. It is something that we have been working on for a long time.
If the Discover 100T is rightly valued, then we will push rapidly towards higher market share in the 100cc space.
That I hope in terms will take our weighted market share up closer to 30 percent
Berger Paints - Abhijit Roy, CEO
Margin expansion - one is of course the raw material prices which impacted us. The second part is to do with
more shift towards a decorative business because industrial business floored down a bit.
Volume growth was in double digits, we crossed the double digit mark
In decorative paints business line we are number two, we are almost double the size of AkzoNobel or Nerolac
Ipca Laboratories - AK Jain, ED
US Food and Drugs Administration (USFDA) inspection has been delayed - Some issue related to travel schedule
of the inspector. so it is going to be in the month of April now instead of February end.
On P&L, there is another additional cost which is on account of certain fees required to be paid to USFDA. We
have incurred additional Rs 10 crore on R&D because of certain special project which is going on right now
So overall, in domestic market we should be able to post around 17 percent growth for current financial year.
We have a policy of hedging our net foreign exposures to around 40-60 percent. Currently, for next one year
around 47 percent of our net exports are hedged and that hedge rate is almost around Rs 56
Onmobile Global - Mouli Raman, Co-Founder & MD
We expect de-growth in India business for next one quarter, after that it will be flat for a quarter. On
international front we are making pretty good progress on Latin America and Africa.
India business in FY14 - a year-to-year basis it will be lower single digits.
Overall, over the next year or so we expect to have a growth rate of anywhere between 17-20 per cent at the
company level
Margins likely to stabilize going forward - Overall the EBITDA level our expectation would be around 23-24
percent on an annual basis. Operating profit of abound 10-11 percent is where we are looking at.
Power Finance Corporation -Satnam Singh, CMD
I think the new banking licenses are going to be for the private sector and I have never said that we will be
applying for a new bank license. What I had said was that we will be exploring the possibility of taking a stake in
banks so as to ensure that our payment security mechanism is not dependent on third party banks.
Rather, we will have that payment security mechanism that is escrow as well as trust and retention account in a
bank in which we have stake.
We have a very high level of almost equivalent to 1 percent of our book as reserve for bad and doubtful debt.
Against that reserve, we have not written off even a single rupee.
We will have to make a provision for another Rs 30 crore in the last quarter, so as to match what we have
committed to RBI.
RBI has come out with guidelines that 'as and when power plants are commissioned and the ones which are
funded by us are commissioned, then the risk comes down from 100 percent to 50 percent
WIN – Week In a Nutshell
8
8
th
Feb
2013

WEEK IN A NUTSHELL
WEEK IN A NUTSHELL
WIN Sector Updates
BANKING: Loan (16%) and Deposit (13.1%) gr. remain stable
RBI released the banking sector business data for fortnight ended 25
th
January 2013. Key takeaways:
Loan growth remained largely stable at 16% YoY (down 30bp compared to a fortnight earlier). In absolute
terms, loans increased marginally by INR84b v/s increase of INR156b a fortnight ago and INR180b a year ago.
Deposits growth for the banking system stood at 13.1% YoY v/s 13.3% a fortnight earlier. In absolute terms,
deposits declined INR115b v/s increase of INR613b a fortnight ago.
On YTD (over March 2012) basis, loans in absolute terms increased ~INR3.5t to INR50.5t whereas, deposits grew
~INR4.2t to INR65.3t. In percentage terms loans grew 7.4% and deposit by 6.8%.
Banks continued to wind up their SLR deposits after a marginal increase in the previous fortnight. SLR
investments declined INR134b from the previous fortnight as a result of which SLR declined 13bp on a
fortnightly basis to 27.6%. It remains significantly higher from 26.1% reported at the end of FY2012. On a
fortnightly basis CD ratio improved marginally by 27bp to 77.4%.
FINANCIALS: Positive news flows for power financiers
Government of India (GOI) has tried address the problems at the Discom level by compelling them to increase
tariff rates. At the Genco level, coal price pooling is a positive development. To improve liquidity at the Discom
level, financiers came out with the facility of transitional finance. While issues related to Discoms in terms of
higher T&D losses, uncertainty of tariff increase (due to lack of political will) etc persists, the reforms announced
till date will surely abate concerns relating to growth and asset quality, in the medium term. Further,
transitional finance facility is positive for financiers as (a) it offers higher spreads (b) payments are guaranteed
by state government (c) higher growth and (d) lower risk weight-age. While the improving news flow in power
sector is positive in general for the financial sector (8% of overall loans), major beneficiaries are likely to be
mono-line financiers like POWF and RECL.
Sector & View: POWF/RECL trades at 1x/1.2x FY14E BV of INR207/INR208 with the healthy ROA and ROE of
3/3.2% and 20%/23%. Stocks also offers attractive dividend yield of 4.4%/4.6%. On back of relatively cheap
valuations and higher share of generating assets, between RECL and POWF, we prefer POWF. Reiterate Buy.
METALS WEEKLY: Indian steel prices still weak; global iron ore and coking coal prices are up
Indian long steel price (TMT Mumbai) and flat steel prices (Import parity) decreased by 1.6% and 0.6% WoW
respectively. Sponge iron prices were flat while pellet prices decreased by 5.1% WoW.
Steel prices increased in Europe, China, CIS and N. America by 2%, 1.2%, 2.1% and 1.6% WoW respectively.
Prices declined 2.7% WoW in Turkey.
Iron ore prices increased 4% WoW to USD155/ton DMT, while Coking coal prices increased by USD2.5WoW to
USD172.5/t. Coking coal prices have increased on the backdrop of floods in Queensland, Australia which have
affected the supply.
Base metals continued their uptrend with aluminum, copper, zinc and lead increasing 1%, 1%, 2% and 1% WoW.
Zhuzhou and Huludao, the top two zinc producers in China have warned about continuing losses in 2012 due to
slowdown in local and global economic growth, weak demand, increased competition and higher costs. China's
official PMI for January fell by 0.2 points MoM to 50.4.
NMDC has rollover January iron ore prices for both fines and lumps in February. SAIL has reportedly increased
prices of flat steel by 2-3% but market is unlikely to absorb the hike amid weak demand.
mPower (January 2013): Monthly round-up of power utilities
In Dec-12, commissioned 15MW of projects as compared to target of 3.7GW. YTDFY13 commissioned 9.8GW of
projects (9.5GW Thermal and 0.3GW Hydro projects), v/s target of 13.7GW, an achievement of 72%.
All India generating was 211GW comprising of 67% thermal (141GW), 19% hydro (39.3GW), 2% nuclear (5GW)
and 12% renewable energy (26).
All India power generation for Jan-13 stood at 78.3BUs (up 6.8% YoY). Substantial improvement in generation in
coal up 15% YoY on the back of increase in the coal based capacity. We note that coal based projects PLF
declined by 248bp YoY. The gas based generation declined by 34.4% and PLF declined to 33.6% (v/s 54.6% YoY)
WIN – Week In a Nutshell
9
8
th
Feb
2013

WEEK IN A NUTSHELL
WEEK IN A NUTSHELL
due to decline in gas production. hydro generation declined by 10.4% YoY due to poor monsoons, dense snow
formation.
UTILITIES: In-principle approval for coal price pooling, details hold key
CCEA granted in-principle approval for coal price pooling mechanism, which was on its agenda for the
discussion. approval calls for “modalities being finalized” by concerned ministry.
As per current FSAs, Coal India will supply coal upto 65% from domestic balance 15% from imports. Coal price
pooling would help bring accountability for Coal India to honor its full obligation (80% trigger level); cost is
expected to be rationed across the entire linkage quantity of coal being supplied to power sector.
Earlier framework proposed by CEA, the cost increase on this count was expected at INR87/ton (on full linkage
quantity supplied to power sector) or INR0.08/unit (average power cost increase). We understand that Coal
India was further working on the proposal and actual cost increase could be higher/lower under new/revised
framework, if any.
Sectoral impact: Approval of the framework provides confidence on the identified 60GW of projects by
CEA/MoP. Secondly, price pooling will enable projects operate to at minimum PLF of ~68% (80% trigger level of
85% availability), providing comfort on debt service coverage.
Key things to watch out for: 1) Signing of FSA was contingent on project capacity being tied-up under LTPPA.
Incumbents had requested to set aside the condition, as there are no fresh bids being called by DISCOMs in the
absence of finalization of new bidding document. 2) The treatment to projects which were not part of the list
but have already commissioned the capacity is important to watch out for. 3) Whether such approval from
Cabinet has over-riding effect and thus, State government would have limited/no say in adoption/execution.
Beneficiaries: 1) Of the 60GW of identified projects, NTPC had linkages approved for 11.6GW of capacity, Lanco
- 5GW, Indiabulls Power - 3.8GW, Sterlite Energy - 3.7GW and Adani Power - 2.6GW. This list was expected to be
revised to accommodate project that are commissioned and have PPAs, and defer/eliminate projects which are
yet to tie-up capacity under LT mechanism. We await further clarity on the same. 2) In our view, banking
sector/NBFCs like PFC & REC remain a key beneficiary of the move as threat of restructuring/bad loans recede.
Improved coal availability and demand growth by DISCOMs (owing to tariff hike, financial restructuring) could
be positive for players like NTPC as it will lead to higher generation while fuel cost increase is a pass through.
WIN – Week In a Nutshell
10
8
th
Feb
2013

WEEK IN A NUTSHELL
WEEK IN A NUTSHELL
WIN Corporate Corner
ACC 4QCY12: EBIDTA below est at INR530/ton; higher other inc, lower tax boosts PAT; Cutting EPS 5-9%
ACC’s operating performance is below estimate with EBITDA of ~INR3.17b (v/s est INR3.33b), impacted by lower
than estimated realizations. However, higher other income and lower tax boosted reported PAT to INR2.39b
(v/s est INR1.88b), a 15% YoY de-growth. Results are not comparable as merger for RMC business subsidiary is
fully done in 4QCY12 (for CY12).
Volumes were flat YoY (+10% QoQ) to 5.94MT (est 6mt). Grey cement realization declined 7.5% QoQ (-0.8%
YoY) to INR4,166/ton (est INR4,327/ton), as ACC was aggressive on pricing to achieve year end targets.
Net sales (ex RMC) declined by 1% YoY (-2% QoQ) to INR24.7b (v/s est INR26.1b). RMC business revenues in
4QCY12 de-grew by 18% YoY (-1.5% QoQ), reflecting weak activity in organized housing and infrastructure
projects.
Costs were lower than our estimates, driven by savings on energy side (due to higher contribution of linkage
coal). Total cost (ex-RMC) was down ~2.3% QoQ (+2.4%YoY).
EBITDA de-grew by 18% YoY (-25% QoQ) to INR3.17b (v/s est INR3.33b), translating into EBITDA margins of
10.2% (-520bp YoY, -710bp QoQ v/s est 12.8%). EBITDA/ton of INR530 (down ~INR120/ton YoY and INR250/ton
QoQ v/s est INR552/ton). Higher other income and lower tax (due to full absorption of carried forward losses of
RMC business) boosted PAT to INR2.39b( v/s est INR1.88b), a de-growth of 15% YoY (-4% QoQ).
The company indicated that royalty of 1% to Holcim would in-lieu of technical services fees (excl IT services
fees) paid to Holcim currently. Effectively net increase in royalty would be 0.6-0.7%.
The Board has recommended total dividend of INR30/share (incl interim dividend of INR11/share v/s CY11
INR28/share).
We cut our EPS for CY13/CY14 by 9%/5% to INR73.2/93.5, to factor (a) lower volumes (8% growth) & realization
(~INR9/12 per bag), (b) higher royalty (by 0.7%) and (c) merger of RMC subs.
The stock trades at 7.2x CY14E EV/EBITDA and USD110/ton. Maintain Neutral with target price of INR1,601 (~9x
CY14E EV/EBITDA).
AMBUJA 4QCY12: Below est. impacted by lower volumes, higher depn, tax and interest; Cutting EPS 7%
Net sales were flat (-0.7% YoY) at INR23.1b (+7% QoQ; est INR25.1b). Volumes de-grew 5.6% YoY (+13% QoQ) to
5.4MT (v/s est. 5.9mt), while realization declined by 5% QoQ (+5.2% YoY) in line with estimate at INR4,293/ton
(-INR227/ton QoQ) v/s est of INR4,283.
Cost per ton was moderately higher than estimates at INR3,499/ton (+INR163/ton QoQ; est INR3,452/ton) due
to negative operating leverage on weak volumes.
Adj EBITDA de-grew by 1% YoY (-25% QoQ) to INR4.3b (v/s est INR4.9b), translating into margin contraction of
7.7pp QoQ to 18.5% (flat YoY; est 19.4%). EBITDA/ton declined by ~INR390/ton QoQ to INR795 in 4QCY12
(+INR40 YoY; est INR831).
Adj PAT de-grew by 29% YoY (-32% QoQ) to INR2.3b (v/s est INR3.1b), impacted by higher depreciation, tax and
interest expense. Higher depreciation includes (a) ~INR310m depreciation pertaining assets write off and will
not recur (b) INR279m of prior period impact due to change in depreciation policy for captive power plants.
Higher interest expense is due to Provision of penal interest on certain litigations.
ACEM indicated that royalty of 1% to Holcim would be in-lieu of technical services fees (excl IT services fees)
paid to Holcim currently. Effectively net increase in royalty would be 0.6-0.7%.
The Board has recommended total dividend of INR3.6/share (incl interim dividend of INR1.4/share v/s CY11
INR2.8/share).
We are cutting EPS estimates for CY13/CY14 by 7% each to INR11.3/INR13.4 respectively, to factor in for a)
lower volumes, b) higher royalty, c) higher interest cost and tax. The stock trades at 7.9x CY14E EV/EBITDA and
US$164/ton. Maintain Buy with target price of INR222 (~9x CY14E EV/EBITDA).
ANANT RAJ 3QFY13: Beats est. due to revenue booking at Golf Course project; rental deteriorates
Revenues grew 97%YoY to INR1.8b (v/s est. of INR1.4b). Sequential scale up is attributable to (1)
commencement of revenue from plotted sales of Golf Course Road project (recognized INR612m in 3QFY13),
and (2) land monetization of INR126m (1 acre land at Jaipur).
WIN – Week In a Nutshell
11
8
th
Feb
2013

WEEK IN A NUTSHELL
WEEK IN A NUTSHELL
EBITDA grew 55%YoY to INR770m (v/s est of INR725m), while margin declined sharply by 10pp QoQ to 42%. The
drop in margin is largely owing to meaningful cost escalations in Sector 91 and Manesar project. PAT grew
74%YoY to INR548m (v/s est of INR501m).
Rental income from annuity assets decline sharply by ~INR50m to INR238m due to (1) cancellations in Manesar
IT Park and (2) end of contract at Hotel Exotica with Park Land which resulted in no income from the hotel in
3QFY13. We are downgrading our annuity income estimates of FY13/14/15 to INR1b (v/s INR1.3b
earlier)/INR1.4b/1.6b.
Ongoing projects witnessed QoQ de-growth in sales at 0.1msf (INR0.5b) as against 0.1msf (INR0.7b) due to
limited fresh sales at Golf Course Road project.
Customer collections continue to lag significantly, which stood at ~INR4.4b against pre-sales of ~INR17.8b and
revenue booking of INR8.1b.
ARCP’s net debt stood at INR13.8b, up by INR1b QoQ, implying net DER of 0.35x owing to negative cash surplus
in 3QFY13, led by (1) INR0.8b of collections (including annuity), (2) INR0.1b of land sales, (3) INR0.8b of
construction spending, (4) INR0.5b of interest expense, and (5) INR0.3b of overheads and tax.
ASHOK LEYLAND: Jan-13 above est: MHCVs in-line at 6,863 units (-25% YoY); Dost above est at 3,698
Ashok Leyland Jan-13 volumes grew by 2.5% YoY (+45% MoM) to 10,561 (v/s est 9,900 units).
MHCVs registered a decline of 25% YoY (+31% MoM) to 6,863 units (v/s est 6,700 units) as weak economic
growth impact freight availability and transporters profitability.
We estimate 15% de-growth in M&HCV volumes in FY13, implying residual run-rate of 7,758 units (20% residual
de-growth).
Dost (LCV) sales recovered to 3,698 units (v/s est 3,200 units), a growth of 79% MoM.
Ashok Leyland volumes have been relatively better than Tata Motor’s in last few quarters, driven by recovery in
its key southern market as well as its higher exposure to buses.
The stock trades at 25.3x/13.0x/9.3x FY13/FY14/FY15 earnings of INR1.0/1.9/2.7 respectively. Maintain
Buy.
BAJAJ AUTO: Below est at 347,624 (+3% YoY v/s est 357,000), impacted by muted domestic 2Ws
Bajaj Auto’s Jan-13 total volumes increased by 3% (+1% MoM) to 347,624 (v/s est of 357,000). Based on our
FY13 estimate of 1% de-growth, implied residual volume is ~350,750 units (~3% growth).
Domestic volumes de-grew 1% YoY (+0.6% MoM) to 219,142 (v/s est of 236,000), whereas exports increased by
10% YoY (+2% MoM) to 128,482 units (v/s est 121,000 units).
Domestic 2W volumes will remain sluggish due to weak demand environment, although Bajaj has done
reasonably well due to new launches (Pulsar 200 NS, Discover 125 ST & 100T).
Management indicated that overall demand scenario remains weak and expect growth to be flattish over next
few months.
Three-wheeler sales grew by 6.5% YoY (+1.5% MoM) to 46,263 units (v/s est 45,000 units). New permit issuance
in Delhi, Jaipur etc has helped in driving three-wheeler sales.
The stock trades at 15.5x FY14E EPS of INR132 and 13.7x FY15E EPS of INR150. Maintain
Buy.
BANK OF BARODA: Below estimates; Asset quality under pressure; Growth and margins disappoints
NII up +7% YoY & flat QoQ to INR28.4b (Est 30.4b)
provisions of INR10.3b (estimate of INR9.4b) on account of higher than expected slippages
PAT down 20% YoY to INR10.4b (Est 11.6b); cushion from lower tax rate of 16% (Est of 25%)
Global NIM decline of 6bp to 2.65%, Domestic NIMs down 15bp QoQ to 3.1%, International NIMs up 4bp QoQ
to 1.58%
Absolute GNPA up 25% QoQ; NNPA up 41% QoQ
Net slippages at INR17.9b v/s INR11-11.5b in last three quarters; of which slippages in restructured loans were
~INR10b); guides Pressure on asset quality to continue for next two-three quarters. –Negative Surprise
Restructured loan of INR22b
OSRL at INR205b (6.8% of overall loans), + 5% QoQ
Cut EPS by 5-7% for FY13/15 led by higher than expected stress on asset quality and lower margins and fees
Trades at 1x FY14E BV and 0.8x FY15E BV.
WIN – Week In a Nutshell
12
8
th
Feb
2013

WEEK IN A NUTSHELL
WEEK IN A NUTSHELL
BHEL 3QFY13: Operating performance below estimates; bidding pipeline improving; Maintain Neutral
BHEL’s 3QFY13 operational performance was below estimates: revenues at INR100b (down 5% YoY, inline),
EBITDA at INR16.3b (down 20% YoY) vs estimates of INR18b, down 12% YoY.
EBITDA margins stood at 16% vs our estimate of 17.4% and were impacted by poor fixed cost absorption and
higher provisions for bad debts / liquidated damages.
Net profit at INR11.8b, down 18% YoY was in-line with our estimate of INR12.3b. Profits were also aided by
better than expected other income, largely benefiting from forex gain on receivables.
Revenues were impacted by execution delays given the tight liquidity conditions, as BHEL has cut-down on
execution in instances of delayed payments.
The management stated that payment cycle is showing signs of visible improvement, and combined with the
likely initiatives of the Cabinet Committee on Investments to address the contentious issues; execution could
possibly show signs of improvement.
Order intake stood at INR19.5b, down 55% YoY (excluding the impact of cancellation of Videocon order last
year); and is impacted by fall in industrial as well as power sector orders.
Order book currently stands at INR1.13t with BTB(x) of 2.4x TTM (down from INR1.22t at 2QFY13 end), lowest
since past 4 years and is impacting revenues.
We currently model BHEL’s order intake to improve 10% YoY in FY13, supported by NTPC bulk tender orders.
Maintain Neutral, with price target of INR200/sh (15x PER FY15E).
BTB (x) at lowest level since past 3-7 years
CIPLA 3QFY13: Operational performance driven by favourable product mix; EPS largely unchanged
3QFY13:
performance was above estimates. Revenues grew 18% YoY to INR20.71b, EBITDA grew 26% YoY to
INR4.93band PAT grew 26% to INR3.39b. The growth was primarily led by 38% YoY growth in export
formulations business to INR9.69b while domestic formulations grew a modest 10% YoY to INR9.29b. Export
APIs stood at INR1.38b and declined by 16% YoY on a high base.
Domestic formulations records healthy 17% growth in 9MFY13 – unlikely to sustain in coming quarters:
we
are positively surprised by the strong growth in export formulations, driven by Lexapro supplies (now part of the
base business) and strong growth witnessed across key therapeutic areas. Also, there was a 6-7% benefit from
currency. However, the management has indicated that this high growth is not sustainable, going forward. The
muted domestic formulations growth of 10% is below our expectation of 15%.
Margin Expansion:
EBITDA margin increased 150bp YoY and stood at 23.8% (v/s our est. of 23.3%). Margin
improvement was driven by favourable product mix, with higher contribution from anti-depressants segment
(includes generic Lexapro supplies; now part of base business) and anti-allergics (includes Dymista; currently a
small contributor). PAT growth was aided by strong topline growth coupled with healthy operational
performance. There was a forex gain of INR190m for the quarter.
FY13 Guidance:
Domestic formulations are guided to grow over 15% YoY for the year and the management is
confident of sustaining this momentum in FY14. While the management did not specifically discuss the overall
topline growth guidance for FY13, it had earlier guided for 15% growth. EBITDA margins are expected to
improve on account of better product-mix and positive impact of a favourable currency. Management has
indicated that EBITDA margins at 22% can be expected, going forward. Tax rate guidance has been maintained
for FY13/14 at 23-24%.
Valuation and view:
we estimate core EPS of INR19.7 for FY14E (up 17% YoY) and INR22.6 for FY15E (up 16%
YoY). Based on our revised estimates, the stock trades at 20.6x FY14E and 17.9x FY15E earnings. We maintain
Neutral with target price of INR452 (20x FY15E EPS), 12% upside.
WIN – Week In a Nutshell
13
8
th
Feb
2013

WEEK IN A NUTSHELL
WEEK IN A NUTSHELL
COGNIZANT 4QCY12: Revenue in line; CY13 organic growth guidance of 15.8%
CTSH’s 4QCY12 revenue grew 3% QoQ to USD1.948b, above the company’s guidance of USD1.94b and in line
with consensus (USD1.949b) and our estimates (USD1.95b). Non-GAAP operating margin was 19.7%, within the
Company's targeted 19-20% range. Diluted non-GAAP EPS during the quarter was USD0.99, v/s guidance of
USD0.97.
For CY13, the company gave a revenue guidance of “at least” 17% to USD8.6b. The guidance includes
anticipated acquisition revenue of USD90m. Excluding anticipated acquisition revenues, organic growth
guidance for CY13 is 15.8%.
While 1QCY13 guidance of 2.7% QoQ revenue growth implies higher CQGR of 4.1% over 2Q-4Q, we note growth
over 2Q-4Q has outgrown 1Q sequential growth in all but 1 of the past 5 years.
While 15.8% organic revenue growth guidance in CY13 is at the lower end of expectations, growth deceleration
at CTSH implies some convergence with other leading Indian IT players rather than a red flag for further
deceleration of the industry. This is due to CTSH’s heavier dependence on Healthcare and Pharma vertical,
which is expected to witness a sluggish CY13 with Pharma in particular seeing contraction in IT budgets.
CORP BANK 3QFY13: Asset quality disappoints; NIM improves QoQ but still lowest amongst peers
Corporation Bank's 3QFY13 PAT declined 25% YoY to INR3b led by weak core operations and higher provisions
as pressure on asset quality (GNPA up 17% QoQ) continued to rise. NII grew just 3% YoY (+10%QoQ) to INR8.8b
and fee income grew 13% YoY (flat QoQ) to INR2.5b, as result core operating profit growth was just 3% YoY
(+2% QoQ)
Over past few quarters pressure on asset quality has increased significantly led by slippages in large corporate
and SME segment, as a result net slippages ratio for 9MFY13 have increased to 2.3% v/s 1.2% in FY12.
Further bank has lowered PCR which have declined from ~50% in FY11 to 25.7%. Thus, even if net slippages
decline, credit cost would remain at an elevated level due to ageing of the portfolio. We model credit cost of
~1% over FY13/15 as compared to 70bp in FY12
DIVI'S LABS 3QFY13: Operational performance below estimates due to unfavorable product mix
Divi’s Labs reported 29% YoY growth in revenues to INR5.33b (v/s est. of INR5.41b), EBITDA grew 22% to
INR1.81b (v/s est. of INR1.98b) and 18% growth in Adj PAT to INR1.44b (est. of INR1.47b). EBITDA margins at
34% (down 180bps YoY) were below est. of 36.7%. There was a forex gain of INR160m for the quarter (included
in other income) compared to a forex gain of similar amount in 3QFY12 (for 2QFY13, there was a forex loss of
INR208m included in other expenses).
Revenue growth was driven by 37% growth in CRAMS business, while generics grew 25%. Nutraceuticals
revenues declined 8% to INR185m. Management has indicated that there was 2-3% currency benefit in topline
for the quarter.
EBITDA margins are lower than estimates due to unfavorable product-mix, which pushed the raw material costs
up by 200bps YoY to 41.5% of sales. We expect margins to improve from 3Q levels.
We estimate 35-37% RoCE and 28-29% RoE over FY13-15, led by traction in high-margin CRAMS business,
sustained profitability in Generics business and increased contribution from the new SEZ.
The company is targeting a fresh capex of INR1.5-2b for FY13 despite the ~INR4.5b capex undertaken in the past
two years. This reflects confidence about the growth outlook.
The stock trades at 18.3x FY14E and 14.7x FY15E earnings. Buy with a price target of INR1,450 (20x FY15E EPS)
FIN TECH: Initiating coverage - Incubating success; potential to create multiple MCXs; 27% Upside
Unique play on end-to-end ecosystem of stock exchanges:
The company was incorporated as a provider of
technology solutions for the financial markets. It has forward integrated from being a trading technology
solutions provider to a creator and operator of financial markets (nine exchanges) as well as complementary
ecosystem ventures supporting these markets (Warehousing, Clearing, Info vending, Payment solutions etc.).
Strong economic moat - right business, right capabilities, right strategies:
An Economic Moat protects a
company's profits from being attacked by a combination of multiple business forces. Exchanges globally have
been winner-takes-all businesses, with minimal competition. Forward integration from trading platform to
8
th
Feb
2013
WIN – Week In a Nutshell
14

WEEK IN A NUTSHELL
WEEK IN A NUTSHELL
exchanges to complementary ecosystem ventures facilitates a distinctive value proposition to customers, non-
replicated in the market.
Potential to create multiple MCX's over a sustained period :
Supply of technology platform by its parent,
FTECH gives MCX a competitive edge. FTECH has been setting / scaling up multiple other exchanges that span
across asset classes and geographies, which can map MCX's success. Potential opportunities at MCX-SX and SMX
are even higher than that at MCX.
Resolving the value enigma; Buy with an SOTP target of INR1,370:
We value FTECH's businesses by dividing
them into: [1] Base value, coming from sizably scaled Technology business (INR543/share) and MCX
(INR500/share including value of warrants in MCX-SX held by MCX), and [2] Option value - from other ventures
such as MCX-SX, IEX, NSEL and SMX (applying a multiple to nascent base of current financials). We see three
potential upside triggers to the stock in the near term: [1] Passage of FCRA bill, [2] stake sale in IEX (to bring
holding down from 33% to 26%) and [3] Volumes performance at MCX-SX post launch on February 9th. We
recommend
Buy,
with SOTP based target price of INR1,370.
HERO MOTO: Above est at 557,797 (+7% YoY); Highest ever volumes driven by new launches
Hero MotoCorp’s Jan-13 volumes grew 7% YoY (+3% MoM) at 557,797 units (v/s est 535,000).
While retails are estimated to have grown 5-7% YoY, growth in wholesale dispatches is also reflection of
maintaining higher inventories over 30-35 days.
Based on Jan-13 wholesale volumes of top-4 players, HMCL’s market share is stable on YoY basis, whereas HMSI
has gain ~220bp YoY at expense of Bajaj Auto (~120bp) and TVS Motor (~100bp).
The stock trades at 15.4x FY14E EPS of INR117.8 and 11.4x FY15 of INR159.5. Maintain
Buy.
IDFC 3QFY13: Inline; Growth moderates; Spread and asset quality stable QoQ; Significant cost control
IDFC’s 3QFY13 reported PAT grew 20% YoY to INR4.6b (3% below est.). Adjusted for one off trading gain of
INR835m in 3QFY12, PAT growth was strong at 45% YoY.
Despite moderation in loan growth at 21% YoY, 9MFY13 adjusted (for NSE and MF stake sale in FY12) PAT grew
~40% YoY led by (a) stable spreads at 2.5% (b) strong fee income growth of ~50% and (c) sharp control over cost
(9MFY13 flat YoY) leading to TTM c/I ratio of 16% vs 20% a year ago.
NII for the quarter grew 2% QoQ and 22% YoY to INR6.6b (in line with est.). Spreads were stable both QoQ and
YoY. NII from infrastructure activities grew 3% QoQ and 29% YoY, while NII from treasury activities declined 4%
QoQ and 30% YoY.
Sanctions remain volatile and declined sharply by 44% YoY (+55% QoQ) to INR43.1b; Disbursements also
declined 56% YoY and QoQ to INR25.8b.
In 9MFY13, sanctions declined 13% YoY and disbursements grew 5% YoY. Loan pipeline increased 14% QoQ to
INR152b led by 40% QoQ rise in telecom segment
Asset quality remained stable QoQ with %GNPAs at 0.26% and PCR at ~54%. During the quarter IDFC made
accelerated provision (+50% of the current quarter provision) on media exposure and total provisioning on the
account stands at almost 2/3rd of the exposure.
Valuation and view
Barring one off investment going bad in the previous quarter, IDFC has delivered healthy performance on the
asset quality front. While the stance on asset quality remains cautious, IDFC has been prudently making
provisions for the same (loan loss provisions of 1.6% of assets).
Maintain Buy with a price target of INR210 (based on FY15E SOTP).
Loan growth remains strong
WIN – Week In a Nutshell
15
8
th
Feb
2013

WEEK IN A NUTSHELL
WEEK IN A NUTSHELL
INDIAN BANK 3QFY13: Below est.; Weak core performance; Sharp deterioration in asset quality
Indian Bank’s 3QFY13 reported PAT declined 37% YoY and 33% QoQ to INR3.5b (24% below estimate) led by
weak fee income (up 3% YoY; on a lower base) and higher provisions (INR4.1b; 50% above est.) due to sharp
deterioration in asset quality (GNPA up 61% QoQ to INR31.8b; NNPA up 70% QoQ).
Reported NIMs declined 5bp QoQ (though down 51bp YoY) to 3.1% – despite sharp increase in slippages, as a
result NII (declined 2% YoY) was in-line with estimate at INR11.4b.
Operating profit (declined 18% YoY; INR7.5b) and PBT (declined 50% YoY; INR 3.5b) are 16% and 46% below
estimate. Near nil tax rate provided some cushion to profitability.
Valuation and View:
We downgrade our earnings estimates by 12/13% for FY13/14 to factor higher provisions and muted fee income
performance. Healthy margin coupled with lower opex growth would drive core operating profit CAGR of 10%
over FY12-15, whereas PAT CAGR is expected to be ~7% over FY12/15. For FY14/15, we expect INBK to report
EPS of INR42/49, BV of INR276/314, RoA of 1%+ and RoE of ~16%. Largely stable margin performance despite
higher slippages in 3QFY13, healthy return ratios and capitalizations are key positives. The stock trades at 0.7x
FY14E BV and FY15E BV. Maintain
Buy.
We will review our earnings estimate post interaction with management.
IRB INFRASTRUCTURE 3QFY13: Led by EPC business, Traffic growth remains muted
In 3QFY13, IRB Infrastructure reported consolidated PAT of INR1.4b, up 9% YoY. The growth was led by higher
contribution from EPC division (PAT up 19.5%YoY at INR826m), while toll business PAT was impacted due to
maintenance cost at Bharuch-Surat project (PAT at INR512m, down 17.8% YoY) and muted traffic growth.
Toll revenues stood at INR3.6b after including Ommalur-Namakkal project (acquisition of MVR done by IRB).
Excluding this, toll revenues on comparable basis stood at INR3.4b, up mere by 6%. Of this, Thane-Ghodbunder
project continued to witness robust growth at 8%, while revenue growth has improved for Surat-Dahisar (+9%
YoY). Mumbai-Pune project revenue growth stood at 5% YoY, reflecting traffic growth. Management indicated
that traffic growth is expected to remain muted at 4-5% across projects.
EPC revenue grew by 27% YoY at INR6.7b (vs INR5.3b YoY), while EBIDTA for EPC division stood at INR2b,
entailing margin of 29.6%, up 170bps YoY. Management is confident of maintaining EBIDTA margin, as it is
supported by in-house execution. Order book for the EPC division stands at INR91b and EPC revenue is expected
at INR70b over the next 3 years (average execution of INR23b pa, INR23b in FY12, INR20b in YTDFY13). Thus,
EPC division contribution would remain flat over next 2-3 years.
We expect IRB to report consolidated PAT of INR5.6b in FY13E (flat YoY) and INR6b in FY15E (up 7% YoY). Stock
trades PER of 7x and P/BV of 1x on FY15E basis. Not Rated.
JK LAKSHMI 3QFY13: EBITDA down INR149/ton QoQ led by decline in realn; cutting TP
3QFY13 volumes grew by +2% YoY (+4% QoQ) to 1.25MT (including clinker of 0.125MT). Realization declined by
2.8% QoQ (+10.2% YoY) to INR3,949/ton, due to seasonal weakness in cement prices in North and West during
3QFY13. This led to net sales improvement by +12.5% YoY (+1% QoQ) to INR4.9b.
Cost/ton was broadly stable sequentially and was up by ~1% QoQ/+12%YoY (INR25/ton QoQ). Freight cost
witnessed QoQ increase owing to increase in both the railway and road freight on account of increase in the
diesel prices.
EBITDA stood at INR1b (+5.6%YoY, -12.1%QoQ), while margin contracted to 19.9% (-2.9pp QoQ, -1.3pp YoY).
Decline realization led to INR140/ton QoQ reduction in EBITDA/ton to INR785 (+INR27 YoY), on the back of
stable cost structure sequentially.
PAT de-grew -16.2%YoY to INR412m (-18.9%QoQ), led by lower other income, higher depreciation (YoY) and
higher tax rate on YoY basis.
We are upgrading our EPS for FY13/14/15 by +11%/+2.5%/0% to factor in for (1) higher realizations increase of
INR25/bag in FY13 (v/s earlier est. of INR23/bag), while maintained FY14/15 increase estimates of INR15/12.5
per bag, (2) lower volume growth assumption for FY14 to 8% (v/s 10% earlier), (3) higher freight cost over
FY13/14, and (4) lower interest expense and other income.
2% cut in FY15 EBITDA drives a 2% downgrade in our TP to INR243 (v/s INR249 earlier). JKLC trades at an FY15E
EV of USD49/ton and 3.1x FY15E EBITDA. Maintain Buy with TP of INR243 (5x FY15E EBITDA).
WIN – Week In a Nutshell
16
8
th
Feb
2013

WEEK IN A NUTSHELL
WEEK IN A NUTSHELL
J&K BANK 3QFY13: Strong NIM performance; Slippages contained but high restructuring; PCR at 94%
NII up 8% QoQ and 32% YoY INR5.9b
PAT up 36% YoY (+7% QoQ) to INR2.9b
NIM’s up +44bp YoY and 13bp QoQ to 4.1%; YoL down 11bp QoQ to 12.6%, CoF down 26bp QoQ; Strong
margins of 6% in state of J&K (forms 41% of overall loans) is driving overall NIMs higher. NIMs in states other
than J&K was at 2.5%.
Slippages at INR1.1b v/s INR984m QoQ;
restructuring of INR7.3b (2% of overall loans) – Sharp Increase
GNPA increased 5% QoQ; NNPA declined 11% QoQ
CASA ratio up 120 bps QoQ to 39.4%; CASA up 7% QoQ and 15% YoY; SA up 7% QoQ (+17% YoY); CA up 10%
QoQ (+9% YoY).
Trades at of 1.2x FY14 BV of INR1,200 and 1x FY15 BV of INR1,411; CASA ratio of ~40%, NIM of 4% with the
lowest CD ratio of 62%, PCR of 94%+ and ROA/ROE of 1.5%+/21%+ remains the best in the industry.
JK CEMENT 3QFY13: Robust white cement segment drove margin expansion; upgrading EPS by 3-10%
Net sales improves by 11.7%YoY (-3.6%QoQ) to INR6.7b. EBITDA stood at INR1.3b (+11.8%YoY, 3.2%QoQ), while
margin were 19.5% (+1.3pp QoQ, 0.1pp YoY).
PAT at INR544m (+25%YoY, 0.5%QoQ), moderated by higher interest expense which includes (1) forex loss of
~INR37m and interest on sales tax liability of ~INR20m.
Grey cement volumes grew marginally by 1.9% YoY (-8% QoQ) to 1.3MT, while White cement (including Putty)
continues healthy growth to 0.19mt (+40%YoY, 20%QoQ).
Grey cement realizations stood at INR3,782/ton (down INR189/ton QoQ), while blended white realization
(including Putty) was up by INR476/ton QoQ to INR11,099/ton.
Blended realization was up 7.1%YoY/2.9%QoQ – led by (1) uptick White cement realizations and (2) higher
revenue mix from White cement (31% v/s 24%in 2QFY13).
Grey cement EBITDA/ton deteriorated by INR49 YoY (-INR11 QoQ) to INR632. This is largely attributable to (1)
QoQ decline in realizations, (2) higher freight cost and (3) negative operating leverage. EBITDA/ton at North
plants stood at INR537, while South plant enjoyed profitability of INR861/ton. White cement (incl Putty)
EBITDA/ton improved INR182 QoQ to INR2,909.
Valuation and view
We estimate 26% revenue CAGR over FY13-15 and expect an uptick in grey cement profitability with (1)
increasing contribution from new plants, and (2) improving operating leverage.
JKCE currently trades at 4.2x FY15E EBITDA and USD74/ton. Our SOTP-based target price is INR580 which offers
80% upside. Maintain Buy
Jubilant Foodworks 3QFY13: Below expectations; SSS at 14 quarter low; cut estimates; Neutral
Jubilant 3QFY13 results were below estimates. Sales up 39% YoY to INR3.85b (est INR4.16b); EBITDA margin
down 120bp YoY at 17.4% (est 18%), while Adj PAT grew 28% to INR377m (est INR422m).
SSS growth at 16.1% (est 23%) is lowest in 14 quarters led by high base, cannibalization from new stores and
weak consumer sentiment which has impacted discretionary consumption.
Gross margin contracted 30bp YoY and came in at 74%, while expanded 40bp QoQ. On account of higher
overheads, EBITDA margin contracted 120bp YoY at 17.4% (est 18.0%).
Dunkin Donuts ramp up expenses impacted the margins by 70bps as per management.
It has added 37 stores during the quarter and expanded its city presence to 118 cities from 112 in 2Q13. It is on
track to meet the FY13 guidance of opening 110 stores.
Valuation and view:
Cut estimates 3-7%; maintain NEUTRAL with TP of INR1200 (27x FY15e)
While the long term opportunity in the QSR space is quite attractive given the favorable macros of youth
demographics, rising incomes and increasing frequency of dining out, at a P/E of 37.4x FY14E and 25.5x FY15E,
we believe valuations adequately capture the positives especially given the context of SSS growth slowdown
Maintain Neutral with unchanged TP of INR1200 (27x FY15e)
WIN – Week In a Nutshell
17
8
th
Feb
2013

WEEK IN A NUTSHELL
WEEK IN A NUTSHELL
MANAPPURAM FINANCE 3QFY12: Disappointing performance; NIM contraction, growth moderation
Manappuram Finance 3QFY13 PAT declined sharply by 47% YoY (down 22% QoQ) to INR840m led by margin
contraction of 145bp QoQ and 450bp YoY to 10.5%.
Rebalancing of portfolio post RBI guidelines continue to impact AUM growth (down 16% YoY and 3% QoQ).
Loss of interest on NPAs led to higher interest reversals and led to severe pressure on profitability.
NNPA (%) remains at less than 1%. CAR at 23.4% with Tier I ratio of 21%.
Moderation in expansion, funding constraints and regulatory changes (lower LTVs) impacted AUMs, which
declined 16% YoY and 3% QoQ; stood at INR103.7B. While disbursement increased by 11% QoQ to INR57Bn;
higher repayments of INR60b vs INR52b a quarter ago led to decline in AUM.
Sharp drop in NIMs due to (1) under recovery of interest of INR390mn (~150bp impact on NIM) on auction of
INR3.6bn of Gold and (2) Funding pressures leading to 15bp QoQ increase in cost of funds.
MGFL has made a reversal of interest income of INR 390Mn due to under recovery of INR390Mn on the gold
auction (due to NPA) worth INR3.6B during the quarter; it suffered a ~10% loss on the gold auctioned during the
quarter. Gold auctioned carried a higher LTV of 90%.
Management guidance: (a) A similar quantum of auction is expected in the next quarter as well; hence, the
pressure on yields and margins is likely to remain during next quarter (b) Mgmt expects to grow AUM by 5%
QoQ in 4QFY13 and end the year with 5% YoY decline. For FY14, it expects AUM growth to be 20%+. (c) NIM is
expected to be 12% from FY14 onwards leading to ROA of 4% and ROE of 20%.
Valuation and view: While valuation 1x FY14 P/B (Consensus estimated BV of INR38) are over 50% discount to
Muthoot Finance, uncertainties related to a) AUM growth b) funding constrains c) similar quantum of under
recoveries expected in next quarter remains a challenge. Not Rated.
MARICO 3QFY13: Slight moderation in volume growth; impressive share gains; downgrade to NEUTRAL
Marico’s 3QFY13 performance indicated a moderation in volume growth in its core categories but acceleration
in some categories.
Consol sales grew 11% to INR11.6b (est INR 12.2b) - domestic sales posted 16% growth (organic 10%, excluding
Paras Business) while International sales remained flat in reported terms but declined 3% in constant currency.
Domestic organic volume growth at 9% is a tad lower than recent trend of 12-13%, impacted by moderation in
Parachute and Saffola due to rising premium vs. competitor/unorganized segment.
Consolidated gross margins expanded 450bp to 52%, while EBITDA margin expansion was restricted to 210bp
YoY to 13.9% due to higher ad expenses (up 150bp) and other expenses (up 50bp).
Domestic volumes grew 15% - Parachute rigids up 6%, hair oils 30% and Saffola 4%. It has taken selective pricing
action to revive the volumes.
Paras business segment posted 18% and 21% sales growth for 3Q and YTDFY13.
Kaya: 4% SSS growth (5% revenue growth) lower than 2QFY13 due to slowdown in discretionary consumption.
However, it reported a PBIT of INR38m
Valuation and view: Revise earnings down by 3-5% to account for price cuts, muted international revenues and
expected higher ad-spends; downgrade to NEUTRAL
We continue to like Marico’s strategy of multiple growth driver model and sustained share gains in the core
categories. However, at 29.8x FY14 and 24.2 FY15 PE, given the context of moderating volumes and lack of
further margin levers, we find valuations demanding and look for better entry opportunities. Downgrade to
Neutral with a TP of INR250 (26x FY15; 10% premium to Dabur)
WIN – Week In a Nutshell
18
8
th
Feb
2013

WEEK IN A NUTSHELL
WEEK IN A NUTSHELL
Moderation in volume growth; Saffola impacts domestic volumes
MCX 3QFY13: Operationally in line, PAT above estimate on higher other income; Market share inches up
MCX’s 3QFY13 revenue at INR1.25b (-3.9% YoY, -4.9% QoQ) was in line with our estimate while EBITDA margin
were 58% (vs est of 58.9%). PAT at INR759m (+10% YoY and -6.8% QoQ) was higher than our estimate of
INR668m, on the back of other income (INR372m, v/s our estimate of INR271m).
Lower revenue YoY was on expected lines as total value of volumes declined to INR37t in 3QFY13, by 3.6% YoY
from INR38.4t in 3QFY12.
Although employee costs at 5.4% of revenues declined 50bp QoQ (110bp below our estimate), administration
and other expenses increased 230bp QoQ (+110bp v/s our estimate) to 19.6% and offset the impact from the
same.
Over 9MFY13, volumes stand at INR112.7t, down by 6% YoY. The decline is led by Silver (-31% YoY) and Gold (-
14.6% YoY), offset only partially by Crude oil (+29% YoY) and Copper (+8.7% YoY). Near-monopolistic market
share continued, with 9MFY13 market share at 87%, v/s 86% in FY12. Average Daily turnover at the exchange in
3QFY13 is INR481b, down from INR510b in 2QFY13 and INR503b in FY12.
Current CFO Mr. Mahesh Joshi resigned and Mr. Hemant Vastani, Head- Finance & Accounts, has been assigned
the role of the acting CFO of the Company.
We expect MCX to grow its transaction fees at a CAGR of 14% over FY13-15 and EPS at a CAGR 19% during this
period. We separately value MCX’s stake (including warrants) in MCX-SX. We currently value the standalone
exchange business at 20x FY15E earnings and attribute INR110 (under revision, likely to be revised upwards) as
value to its stake in MCX-SX. Maintain Buy.
Total traded value declined both YoY (3.6%) and QoQ (5.8%) Volumes at both the key commodities declined
NHPC 3QFY13: Optg performance marginally better, Tax rate higher due to deferred tax
3QFY13 adjusted PAT inline, interest income on water cess drives reported profit:
NHPC reported revenues of
INR10b (our est. INR9.5b), EBITDA at INR6.1b (our est. INR4.4b) and PAT at INR3.1b (our est. INR2.6b). Adjusted
PAT for the quarter was at ~ INR2.4b led by adjustment of prior period revenue, reversal of expenditure and
interest income on water cess recovery.
Generation de-grows on higher base:
During 3QFY13, generation for NHPC (Standalone) stood at 2.6BUs, down
18% YoY due to higher base as monsoon was good in previous year. Average PAF for the plants stood at 89% for
9MFY13 v/s 86% in 9MFY12. As on 3QFY13, NHPC outstanding debtors stood at INR20b (v/s INR26b in 2QFY13
and INR21b in FY12). Debtors above 60 days stood lower at INR12.6b. Key states with outstanding dues are J&K
(~ INR4.4b), UP (~3.7b), Delhi (~1.4b) and Bihar (~1.2b). Management is taking steps to realize the dues, as also
scheduling the power from defaulting states.
Capacity addition target at 545MW, commissioned 275MW in 9MFY13, 552MW expected in FY14E, no
capacity addition in FY15/16E:
Capacity addition for NHPC is expected at 820MW in FY13E (275MW in
YTDFY13) and 552MW in FY14E. Management indicated that capacity addition in FY15/16E would be NIL.
WIN – Week In a Nutshell
19
8
th
Feb
2013

WEEK IN A NUTSHELL
WEEK IN A NUTSHELL
Valuations and View:
We expect NHPC to report FY13-15E earnings CAGR of 8% led by capacity commissioning,
while RoE improvement possibility despite taking the benefit of 1% higher RoE for pondage based project
(management estimate of INR800m pa, from FY14E onwards) is limited. Stock has appreciated 26% over past 3
months. Maintain Neutral with TP of INR25/sh (1x FY14E P/BV).
NMDC: Near term pressure on prices of lumps, but fines are selling at premium; Valuations compelling
Weak steel demand in Indian market has put pressure on prices of sponge iron, pellet and thereby on lumps.
NMDC may need to correct its prices of lumps in March.
prices and demand of iron ore fines remains strong due to supply shortage. In recent E-auction, NMDC fetched
19% premium over base price for sale of fines from Karnataka mines.
Gap between prices of lumps and iron ore fines is narrowing, in line with our expectations. Average realization
of NMDC iron ore mix is likely to remain unchanged. Prices of iron ore have been kept unchanged in February by
NMDC.
We believe recent correction in stock has made the valuations of further attractive. Stock is now trading at
compelling FY14 EV/EBITDA of 4.2x, P/BV of 1.8 (RoE of 22.8%), dividend yield of 4.3%. Re-iterate BUY.
NTPC: 5 Key Success Factors in place – Capacity, Fuel, Generation, Earnings, Valuation
CAPACITY ADDITIONS: Catch-up on significant slippage in 11th Five Year Plan implies new growth orbit:
From
FY08 to FY12, NTPC added a mere 2 GW/Year. It has commercialised 3.8 GW in FY13 and should keep up this
run rate for the next 3 years at least. Though, most of the accelerated capacity addition is a result of significant
slippage in 11
th
5 year plan of 57%.
FUEL AVAILABILITY: Well placed; captive mines in close proximity:
Due to flat coal production from Coal India
in FY11 and FY12, NTPC’s PLF came off by 500bp, things have already started to improve with growth of 11%
YoY in coal dispatch from Coal India to power sector. More interestingly, 67% of coal shortage for NTPC was just
from one project – Kahalgaon. NTPC here has already embarked on a project to establish inland waterways to
transport coal, with restoration of captive blocks, 2 out of 5 blocks (70% of total reserves) have already seen
appointment of MDO and are expected to started production in FY15. We note that ~30GW of NTPC's capacity
is within ~400km of its five mines, which provides flexibility on fuel supply chain management.
POWER GENERATION: Low cost, high demand, capacity growth to propel generation growth:
Pre-2010,
NTPC’s power generation was assumed to be as much capacity they could put up. But things changed from FY10
on the back of two key factors: Gas based generaton dropped 30% in the period FY10-FY12 and Close to 7% of
generation loss was due to DISCOMs lower drawals. But, YTD FY13 is already looking up with 6% YoY growth in
generation led by – Better coal generation; and DISCOMs able to draw more power due to tariff hikes.
EARNINGS GROWTH: Earnings plateau to end, robust growth ahead:
NTPC’s earnings moves in a step function.
From FY02-FY05 they were in the range of INR5-INR5.5 EPS which moved to INR9 in FY08. It then remained in
the range of INR10 until FY12. We expect the next step up to kick in from FY13 onwards with earnings growth
CAGR from FY12 to FY15 to be 17% due to capacity addition growth of 8.5% from FY12 to FY15, PLF to increase
from 81% in FY13 to 85% in FY15 on back of better coal supply and marginal uptick in gas supply
REC 3QFY13: Above estimates, NIMs surprise, Growth & asset quality healthy, Upgrade EPS 5-7%
NII up 42% YoY & 12% QoQ to INR14.3b (Est 12.8b), PAT up 33% YoY & 8% QoQ to INR10.3b (Est 9.1b)
Margins sharply up +67bp YoY & +25bp QoQ to 5% (highest in the past 23 Qtr)- a positive surprise; YoL up
+70bp YoY & 28bp QoQ to 12.15%; CoF down 4bp both QoQ and YoY to 8.4%)
Loan up 25% YoY (+6% QoQ) to INR1.19t.
T&D up +10% QoQ and +30% YoY – 90% of incremental loans; Share of T&D segment up 51.4% vs ~49.2% QoQ
generation up 22% YoY (+4% QoQ) to INR522b
Disbursement up 39% YoY and 72% QoQ to INR249b; 9MFY13 39% YoY (INR249b).
T&D up 90% QoQ and 2x YoY to INR73.3b; we believe its on a/c of disbursements under financial restructuring
plan of SEBs
Sanctions down 52% QoQ (up 46% YoY) to INR128.7b; 9MFY13 50% YoY (INR612b)
Higher disbursements towards high yielding T&D segment and relatively cheaper cost of borrowings via tax free
and capital gains bonds led to positive surprise on margins
WIN – Week In a Nutshell
20
8
th
Feb
2013

WEEK IN A NUTSHELL
WEEK IN A NUTSHELL
Incremental cost of borrowings declined 78bp QoQ to 7.9% as ~40% of the incremental borrowing
Up EPS by 5-7% for FY13-15 to factor in better margins
Trades at valuations of 1.2x/1x FY14/15E BV; despite challenging macro environment post good growth;
Spreads will remain stable in a falling rate cycle (b) growth rates will be healthy and (c) Asset quality expected to
be stable
SHREE RENUKA 3QFY13: Higher refinery volume, cogen segment drove domestic revenue
Revenue up 165%YoY to INR18.5b – led by 225%YoY growth in sugar, (2) 1.55x growth in Cogen revenue, and (3)
strong trading revenue of INR2.9b (+48%YoY, +178%QoQ).
EBITDA up 74%YoY to INR1.8b, while margin contracted 5.2pp YoY, 1pp QoQ to 9.9%. PAT stood at INR430m
(loss of INR51m in 3QFY12).
Domestic sugar volume stood at 0.7mt (+147%YoY), which includes 4x increase in refinery volume of 0.4mt
(+253%QoQ) led by high capacity utilizations in Haldia and Kandla refineries. Average sugar realization stood
broadly stable QoQ, while PBIT margin contracted 6.4pp YoY to 3.4%.
Cogen revenue stood at INR1.8b (+155%YoY) led by +94%YoY increase in volume and uptick in realizations (on
account of higher cane crushing volumes and cogeneration from coal-fired boilers at the refineries).
Ethanol revenue stood at INR522m (+15%YoY) led by flattish YoY volume and uptick in realizations.
Brazilian subsidiaries have crushed 2.9mt in 3QFY13 (+139%YoY) and 9.4mt in 9MFY13 (+14% YoY). The
company has guided for higher ethanol production in coming quarters owing to better sugar equivalent prices.
The stock trades at 6.2x FY14 EV/EBITDA. Maintain buy with TP of INR38.
SUN PHARMA: Taro Pharma continues to report strong operational performance on a high base
Sales at USD185.7m up 25.4% YoY. Strong growth despite (1) slight decline in volumes this quarter and (2) a
high base in 3QFY12.
GP up 32% at USD140m, GP margins at 75.4% (up 375bp YoY). implies that Taro has managed to sustain the
price increases taken in its dermatology portfolio over the last 4-5 quarters.
Operating profit up 39.7% to USD104m, with operating profit margin at 56% (up 570bp YoY). Net income grew
42.3% to USD88.8m, driven by strong operational performance on account of price increases.
Sun Pharma’s management had earlier cautioned that this strong performance may not sustain.
SUN PHARMA: Receives FDA approval for Doxil; incrementally positive
Received FDA approval for its generic version of J&J’s Doxil, which is used in the treatment of ovarian cancer
and multiple myeloma.
Drug in shortage for 18 months & market potential of the drug. Management indicated that the drug generated
~USD200m in sales annually before it ran into shortage in November 2011.
patents for the drug have expired in 2009, it has orphan drug exclusivity till May 2014. Currently, there are no
other final approvals for the generic versions and ,currently, the management is not aware of any other ANDA
filers for the product.
We estimate one-time sales contribution of the ~USD125-130m over the next 12 months with one-off PAT of
~USD30-35m. This will increase our DCF estimate for such one-off upsides from INR3 to INR6 per share.
Trades at 25.7x FY14 and 22.6x FY15 earnings. Maintain Neutral with target price of INR835 (based 25x FY15
earnings + DCF estimate of INR6 per share for one-offs).
TECH MAHINDRA 3QFY13: Above estimates; Deal wins to keep growth going
3QFY13: Above estimates; Margin beat driven by decline in headcount:
TECHM’s 3QFY13 revenue at USD329m
grew 10% QoQ, above our estimate of USD323m (+7.9%). Organically, revenue was flat QoQ v/s our estimate of
2% sequential decline. EBITDA margin at 21% (+30bp QoQ) was a key positive surprise, v/s our estimate of
19.7%. PAT before share of Satyam’s profits was INR2.4b, above our estimate of INR2.08.
Revenues from BT declined:
to USD96m from USD99m in 2QFY13, in line with our expectation. Non-BT
revenues grew 2% QoQ organically, v/s our estimate of a slight decline during the quarter. Incremental revenue
from acquisition was USD30m (in line). The beat to margin estimate was largely on account of headcount
rationalization. Overall headcount declined by 1,420 employees, despite 1,546 employee additions from
WIN – Week In a Nutshell
21
8
th
Feb
2013

WEEK IN A NUTSHELL
WEEK IN A NUTSHELL
Comviva. BPO headcount declined by 2,438 employees. BT revenues are expected to decline for another two
quarters before stabilizing, on ongoing consolidation at the client’s end. However, ramp-ups in deal wins should
offset the impact and facilitate organic revenue growth.
Revenues from BPO have increased from 5.9% in 1QFY11 to 19.6% in 3QFY13. During this period, EBITDA margin
has expanded by 220bp to 21%.
Valuation & View:
The stock trades at 9.5x FY14E EPS and 8.4x FY15E EPS. We value TECHM at a 25% discount
to our target multiple for HCLT due to: [1] relatively smaller scale, [2] skew of revenues towards Telecom
vertical, and [3] Increasing proportion of BPO revenues. Our target price for TECHM is INR1,225, which
discounts FY15E EPS by 10.5x.
United Spirits 3QFY13: Results largely in-line; premiumization story working
Standalone sales grew by 11.3% to INR21.7b (est INR21.5b); Gross margins expanded 130bp YoY to 40.5%;
EBITDA margins expanded by 170bp YoY to 11.3% (est 12.2%); Reported PAT increased 70% to INR806m (est
853mn) while recurring PAT, after adjusting for forex gains in both the quarters, is up 64%.
Volume growth of 7%, aided by low base (3Q12 volumes were flat) was low due to trade pressure in Tamil Nadu
as the government continues to favor local brands over organized players.
Premiumization story of UNSP is continuing, as reflected in the strong 29% growth in the prestige plus brands –
contribution of prestige plus brands expanded 420bps YoY to 25% for 3Q and 300bps for 9M to 23%. This led
the gross margin expansion despite 5% YoY increase in ENA costs per case. Glass prices declined mid-single
digits (5-7% YoY).
9MFY13 consolidated net sales increased by 18% to INR81.3b. EBITDA increased 21% to INR11.2b. Despite 29%
increase in interest cost, reported PAT grew 64% led by positive swing of ~INR1bn in forex items (gain of 581mn
in 9MFY13 vs. loss of INR 415mn in 9MFY12).
Consolidated net debt for UNSP marginally increased from INR 78.4b in September’12 to INR79.5b in Dec 12.
Valuation and View
We remain confident of structural margin improvement in the business though accelerated brand investments
will restrict margin improvement in the initial years. Given the timeframe involved in deal completion and the
regulatory formalities (deal is awaiting nod from Sebi and CCI), we expect most of the benefits to start accruing
in 2HFY14.
Stock trades at FY14 and FY15 P/E of 31.7x and 22.9x, respectively. BUY with TP of INR2490. Spike in input costs,
regulatory overhang on the deal are key monitorables.
WIN – Week In a Nutshell
22
8
th
Feb
2013

WEEK IN A NUTSHELL
WEEK IN A NUTSHELL
WIN Collage
A tale of two Davoses
THE brainstorming, deal making and schmoozing is over for another year. Davos Man and Woman have come down
from their Swiss mountain high and headed home, including this correspondent. What were the main memories
and insights they took away from this year's World Economic Forum?
Glass half full.
The general mood was at its most upbeat since January 2007, when the financial system was as
frozen as the Davos streets. Relief that most experts judged the financial crisis to be over at last outweighed
concern that economic growth and job creation seems likely to remain sub-par for the foreseeable future. (Christine
Lagarde, boss of the International Monetary Fund, spoke of a "fragile and timid recovery".) Angela Merkel was
among several European leaders to express optimism about the continent's economic and political prospects. Even
the finding of the Edelman Trust barometer that less than one in five people trust political and business leaders to
tell the truth seems to have been shrugged off. Bankers instead took comfort in the finding that trust in banks has
actually risen in the past year.
Leadership vacuum.
There was hardly anyone from the Obama administration, though a few Republicans turned
up, including Eric Cantor, the House majority leader. Bill Clinton, a Davos regular, also stayed at home, apparently
looking after Hillary. The ongoing power transition in Beijing may have explained the light Chinese presence. The
Russians were out in force, making sure everyone knows they are leading the G20 this year. Dmitry Medvedev, the
prime minister, showed up, but President Vladimir Putin stayed at home.
Euphemism of the week:
Translator. When any of the army of beautiful, lightly clad young ladies flown in for the
"Russian party" were asked what they did, they answered "l'm translator".
French foreign legion.
Business people from France were this year's tragic heroes, embraced and encouraged to
persevere by their fellow capitalists from abroad, whilst their government's assault on wealth creators was widely
condemned. Groups of French business men huddled together, sharing tales of adjusting to life in Belgium.
Stand-up comedy.
Boris Johnson, the mayor of London, enhanced his reputation as the world's favourite comedy
politician with his French bashing Franglais routine; catchphrase: "Donnez-Moi un break—as we used to say in
Brussels.” He also called Davos a "cyclotron of egos". Mr Johnson generally overshadowed David Cameron, Britain's
prime minister, who perhaps picked the wrong audience for his earnest lecture on the evils of tax evasion.
Happiest hedge-funder.
Dan Loeb, of Third Point, who in the past year has shaken up Yahoo! and defended
Herbalife, was over the moon at he and his hedge fund brethren being described as a "stabilising force" in the world
economy by Mark Carney, the new Governor of the Bank of England.
Young global leader.
Whilst the official WEF Young Global Leaders were exiled to Klosters to contemplate our
Schumpeter columnist's sage advice to be humble, the stage was left to an 11-year-old Pakistani, Khadia Niatzi, who
explained how Massive Open Online Courses, such as those provided by Udacity and Coursera, could usher in world
peace. She had got her degree in physics through online learning. When asked to leave the stage in order to make
room for Bill Gates, she rightly seemed unimpressed.
Celebrity corner.
No Bono. No Mick Jagger. No Brangelina. This year's top celebrity was Charlize Theron, a South
African film star, who turned up to support the Global Fund for Aids, Tuberculosis and Malaria. Second, in absen
tia, was Justin Timberlake, who, it was widely noted, no longer looks anything like the now 30-something Sean
Parker, famous Silicon Valley investor and co-founder of Napster, who did show up for a few headline-grabbing
hours.
Party central.
The official WEF theme this year was "dynamism and resilience". That was an apt description of the
partygoing. Mr Parker allegedly blew $1m throwing an exclusive bash, co-hosted with Mark Benioff, the founder of
Salesforce.com, and Ian Osborne, a youthful British PR svengali. A faded Davos night club was tarted up with stuffed
WIN – Week In a Nutshell
23
8
th
Feb
2013

WEEK IN A NUTSHELL
WEEK IN A NUTSHELL
animals sporting laser-beam eyes, drinks were free, and John Legend and Mark Ronson, a DJ, supplied the music.
The party was billed as a celebration of "the future of philanthropy", presumably ironically. Elsewhere, Google not
only lost Marissa Meyer to Yahoo!, where she is now chief executive; it let her steal its traditional Friday night party
slot. The McKinsey Party, with the same fabulous band for the umpteenth year, once again supplied the most
reliable fun and packed, sweaty dance floor.
Shadow Davos.
Over the years, a vast "fringe" of events and parties has grown up in Davos independent of the
official WEF agenda. This "shadow Davos" was bigger than ever this year, with a growing number of people
following Mr Parker's lead and not even bothering with the official event and its huge fees. As with the world of
banking, at Davos increasingly the real action—from doing deals to having fun—is happening in the unregulated
shadow system. The WEF seems in two minds about how to respond to this, with some hosts of unofficial events
grumbling about WEF officials telling them to tone things down. That is the instinct of the monopolist. Yet the WEF
exists in an increasingly competitive marketplace for providing opportunities for the global movers and shakers to
get together. A better strategy would be to deliver an even better official Davos in 2014.
WIN – Week In a Nutshell
24
8
th
Feb
2013

WEEK IN A NUTSHELL
WEEK IN A NUTSHELL
Nifty Valuations at a glance
WIN – Week In a Nutshell
25
8
th
Feb
2013