11 February 2013
3QFY13 Results Update | Sector: Financials
Canara Bank
BSE Sensex
S&P CNX
19,485
5,904
Bloomberg
CBK IN
Equity Shares (m)
443.0
M. Cap. (INR b)/(USD b)
198/3.7
52-Week Range (INR)
566/306
1,6,12 Rel.Perf.(%)
-12/17/-25
CMP: INR446
TP: INR600
Buy
Financials & Valuation (INR b)
Y/E March
2013E 2014E 2015E
98.0
70.9
35.7
2.4
80.7
23.1
585.9
475.2
14.6
0.8
17.4
5.5
0.8
0.9
2.7
115.0
83.2
42.0
2.4
94.7
17.4
664.7
535.6
15.1
0.8
17.4
4.7
0.7
0.8
3.2
NII
79.1
OP
57.0
NP
29.0
NIM (%)
2.2
EPS (INR)
65.5
EPS Gr. (%)
-11.6
BV/Sh. (INR) 518.6
ABV/Sh. (INR) 431.2
ROE (%)
13.3
ROA (%)
0.7
Payout (%)
17.4
Valuations
P/E(X)
6.8
P/BV (X)
0.9
P/ABV (X)
1.0
Div. Yield (%)
2.2
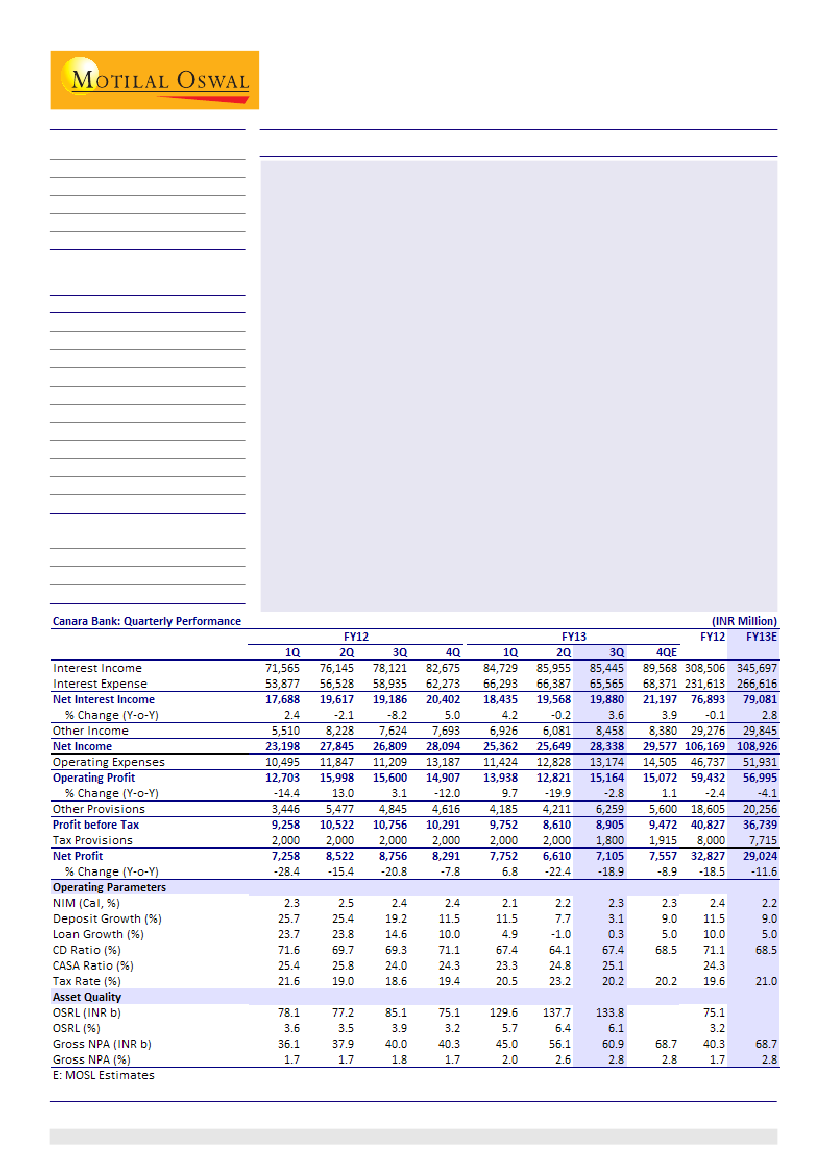
Canara Bank's 3QFY13 PAT of ~INR7.1b (-19% YoY and +7% QoQ) was 6% above our
estimate of INR6.7b. Higher non-interest income (27% above estimate)
compensated for higher than expected provisions and tax rate. NII was 3% below
estimate (+4% YoY and +2% QoQ to INR19.9b) led by lower-than-expected loan
growth (flat both QoQ and YoY). NIMs calculated improved 4bp QoQ to 2.27% (in-
line est).
Key highlights:
Net slippages remained high at INR11b v/s INR12.8b in 2QFY13. GNPAs/NNPAs
grew 9%/12% QoQ and PCR, including write-offs stood at 61%.
CBK restructured loan of INR8.7b during the quarter. However, repayment of
INR12.5b, took cumulative restructured loans (facility-wise) to INR145b v/s
INR149b a quarter ago. OSRL stood at INR134b (6.1% of loans facility-wise).
Non core income (forex + trading + recoveries + MTM on investment) stood
at INR4.2b (v/s INR3.3b) in 3QFY13 and INR9.3b (v/s INR8b) in 9MFY13.
CASA deposits grew 8% YoY (down 3% QoQ) led by 8% YoY growth in SA
deposits (down 3% QoQ). CASA ratio improved marginally to 25%.
Valuation and view:
CBK has aggressively built up investment portfolio, leading
to higher share of trading (including AFS gains) in the profitability. With expected
revival of growth from FY14 onwards, asset reallocation will be positive for
margins, further, benefit on cost of funds (due to fall in above card rate deposits)
will aid margin improvement in FY14. RoA and RoE will be healthy at 0.8%/16%
over FY14-15E. Maintain
Buy.
Alpesh Mehta
(Alpesh.Mehta@MotilalOswal.com) + 91 22 3982 5415
Sohail Halai
(Sohail.Halai@motilaloswal.com)+ 91 22 3982 5430
Investors are advised to refer through disclosures made at the end of the Research Report.
1

Canara Bank
Quarterly performance: Above estimates (INR m)
Y/E March
Net Interest Income
% Change (YoY)
Other Income
Net Income
Operating Expenses
Operating Profit
% Change (YoY)
Other Provisions
Profit before Tax
Tax Provisions
Net Profit
% Change (YoY)
3QFY13A
19,880
4
8,458
28,338
13,174
15,164
-3
6,259
8,905
1,800
7,105
-19
3QFY13E
20,579
7
6,664
27,243
13,630
13,613
-14
5,471
8,142
1,465
6,676
-24
Var. (%)
-3
27
4
-3
11
14
9
23
6
Comments
Lower than estimated loan growth; NIM inline with estimate
Strong non core income
Higher write offs in the quarter
Tax rate higher than expected
Source: Company, MOSL
Net slippages remain elevated
Asset quality pressure continued with net slippages remaining elevated at INR11b vs
INR8.4b in 1QFY13 to INR12.8b in 2QFY13. Gross slippages in 3QFY13 were INR13b
(annualized slippage ratio of 2.4%; v/s INR34b in 1HFY13, annualized slippage ratio of
3.2%) and up-gradation and recoveries stood at INR2.1b v/s INR13b in 1HFY13. None
of the slippage during the quarter had a ticket size of more than INR750m. GNPA/
NNPA grew 9%/12% QoQ and PCR incl write offs declined to 61% vs 63% QoQ.
Restructured INR8.7b in 3QFY13 taking cumulative to INR145b
During the quarter, while CBK restructured INR8.7b, repayments from restructured
loans stood at INR12.5b taking cumulative restructured loans (facility-wise) to INR145b
vs INR149b a quarter ago. As NPAs from restructured loans are at INR11.2b, OSRL
stood at INR134b (6.1% of loans). Of the overall restructured loans, INR54b belongs to
SEBs and INR15b to AI. Thus, OSRL (ex SEB and AI) stood at INR65b (2.5% of loans,
facility wise). Of the incremental restructuring of INR8.7b during the quarter, one
large exposure accounted for INR3.1b and two other accounts accounted for INR1.3b.
Balance sheet consolidation continues; Margins improve QoQ
CBK continued with its strategy of consolidating and de-bulking its balance sheet in
an uncertain environment which is a welcome move considering weak liability
structure and higher share of power sector loans. As a consequence, loans remained
flat QoQ and YoY. Deposits growth also remains moderate with a growth of 3% YoY and
decline of QoQ 3% QoQ. NIMs calculated improved 4bp QoQ to 2.27% in-line with
estimates. This was held by 330bp improvement in CD ratio (67.4% vs 64.1% a quarter
ago) after decline in last three quarters.
Other highlights
Excess liquidity in the balance sheet is parked into G-Sec and as a result SLR (%)
has increased to 34% (stable QOQ).
Calculated CASA ratio improved to 25.1% v/s 24.8% a quarter ago. CASA deposits
grew 8% YoY (down 3% QoQ) led by 8% YoY (down 3% QoQ) growth in SA deposits.
Investments grew ~27% YoY (down ~2% QoQ), within which share of AFS portfolio
increased to 37% v/s 30.5% as of FY12 and 28% as of 3QFY12. Further, AFS duration
also increased to 3.9 years v/s 3.8 years a quarter ago.
11 February 2013
2

Canara Bank
While core operating profits declined 10% YoY for 3Q and 9MFY13, higher share of
non-core income led to relatively lower fall in operating profits to 3% and 5% YoY
for 3Q and 9MFY13. Non Core Income (forex+trading+recoveries+MTM on invt)
income stood at INR4.2b (vs INR3.3b) in 3QFY13 and INR9.3b (vs INR8b) in 9MFY13.
Higher share of non-core income (INR m)
2Q
FY13
Reported Net Income
Less:
Forex Income
Trading Gains
Rec. from written off a/c
Core Net Income
Less: Opex
Core Operating Profits
Provisions
PBT (Pre MTM)
MTM (gains)/losses
Core PBT
Reported PBT
Core PBT/PBT (%)
25,649
920
740
640
23,349
12,828
10,521
4,211
6,310
-1,203
5,107
8,610
59.3
3Q
FY13
28,338
1,080
2,510
590
24,158
13,174
10,984
6,259
4,725
-1,290
3,435
8,905
38.6
QoQ
Gr. %
10
17
239
-8
3
3
4
49
-25
7
-33
3
3Q
FY12
26,809
1,010
1,570
730
23,499
11,209
12,290
4,845
7,446
1,690
9,136
10,756
84.9
YoY
Gr. %
6
7
60
-19
3
18
-11
29
-37
-176
-62
-17
9M
FY13
79,349
9M
FY12
77,852
YoY
Gr. %
2
3,299
3,040
9
4,238
2,290
85
1,698
2,697
-37
70,113 69,825
0
37,426 33,551
12
32,688 36,275
-10
14,656 13,767
6
18,032 22,508
-20
-4,543
2,394
-290
13,489 24,902
-46
27,267 30,535
-11
49.5
81.6
Source: Company, MOSL
Valuation and view
Led by de-bulking of balance sheet and higher risk aversion, business growth remained
weak and in turn impacted the fee and NIM performance, translating to weak core
operating performance. On the balance sheet front, over the last 7 quarters, CBK
reduced the reliance on short term loans on asset side and focused on increasing the
share of below or card rate deposits. Above card deposits (including CDs) proportion
has come down from 44% to 27% now and management expects to bring it down
further in the coming quarter.
CBK aggressively built up investment portfolio, leading to higher share of trading
(incl AFS gains) in the profitability. SLR (%) stands at 33% with the attractive AFS share
of 37% and higher duration of 3.9 years, making it a strong play for monetary easing.
With the expected revival of growth from FY14 onwards, asset reallocation will be
positive for margins, further, benefit on cost of funds (due to fall in above card rate
deposits) will aid margin improvement in FY14.
The stock trades at PBV of 0.8/0.7x FY14/15E BV of INR585/665 and PE of 5.5/4.7x FY14/
15E EPS of INR81/95. ROA and ROE will be healthy at 0.8%/16% over FY14-15E.
Buy
with
a target price of INR600. Key risk (a) High share of Infrastructure portfolio (20% of
which 13% is Power (10% SEB and 3% Private genco) (b) Weak liability profile (Low
CASA ratio of ~25% and higher share of bulk deposits of ~27%), (c) Any negative
surprise on asset quality as new management has just joined in.
11 February 2013
3

Canara Bank
Higher non int income to compensate for higher provision in FY13 (INR b)
Old Estimates
FY13
FY14
FY15
80.6
99.5 116.3
27.9
32.3
36.8
108.6 131.7 153.1
53.2
60.5
68.2
55.4
71.2
84.9
19.3
26.7
31.3
36.0
44.6
53.5
7.2
8.9
10.7
28.8
35.7
42.8
2.2
2.4
2.4
0.8
0.8
0.8
0.7
0.8
0.8
13.3
14.6
15.5
Revised Estimates
FY13
FY14
FY15
79.1
98.0 115.0
29.8
32.5
36.0
108.9 130.5 151.0
51.9
59.6
67.8
57.0
70.9
83.2
20.3
26.2
30.8
36.7
44.7
52.5
7.7
8.9
10.5
29.0
35.7
42.0
2.2
2.4
2.4
0.9
0.8
0.8
0.7
0.8
0.8
13.3
14.6
15.1
FY13
-1.9
6.8
0.3
-2.4
2.9
4.7
1.9
7.0
0.7
Change (%)
FY14
FY15
-1.5
-1.1
0.7
-2.2
-1.0
-1.4
-1.5
-0.6
-0.5
-1.9
-1.7
-1.7
0.2
-2.0
0.2
-2.0
0.2
-2.0
Net Interest Income
Other Income
Total Income
Operating Expenses
Operating Profits
Provisions
PBT
Tax
PAT
Margins (%)
Credit Cost (%)
RoA (%)
RoE (%)
Source: MOSL
DUPONT Analysis: Core operating profits expected to improve, led by better margins (%)
Y/E March
Net Interest Income
Fee income
Fee to core Income
Core Income
Operating Expenses
Cost to Core Income
Employee cost
Other operating expenses
Core Operating Profits
Trading and others
Operating Profits
Provisions
NPA provisions
Other Provisions
PBT
Tax
Tax Rate
RoA
Leverage (x)
RoE
FY05
3.0
0.6
15.7
3.6
2.0
56.5
1.3
0.7
1.6
0.9
2.5
1.2
0.8
0.5
1.2
0.2
13.3
1.1
18.9
20.0
FY06
2.9
0.7
18.8
3.6
1.9
53.2
1.2
0.7
1.7
0.4
2.1
0.8
0.5
0.3
1.3
0.2
13.0
1.1
18.7
20.7
FY07
2.7
0.6
18.5
3.3
1.7
51.9
1.1
0.6
1.6
0.4
1.9
0.8
0.3
0.5
1.1
0.2
15.0
1.0
19.7
18.8
FY08
2.0
0.8
28.4
2.9
1.6
56.5
1.0
0.7
1.2
0.5
1.7
0.6
0.5
0.1
1.1
0.2
17.8
0.9
21.1
19.1
FY09
2.4
0.6
21.1
3.0
1.5
51.3
0.9
0.6
1.5
0.5
2.0
0.7
0.4
0.2
1.3
0.2
19.4
1.0
21.9
22.7
FY10
2.3
0.6
19.4
2.9
1.4
49.4
0.9
0.5
1.5
0.6
2.1
0.5
0.6
-0.1
1.6
0.3
20.9
1.2
21.5
26.8
FY11
2.6
0.5
17.5
3.1
1.5
47.3
1.0
0.5
1.6
0.4
2.0
0.4
0.3
0.0
1.7
0.3
19.9
1.3
19.7
26.4
FY12
2.2
0.5
19.0
2.7
1.3
49.2
0.8
0.5
1.4
0.3
1.7
0.5
0.4
0.2
1.1
0.2
19.6
0.9
18.5
17.1
FY13E
2.0
0.4
17.5
2.4
1.3
54.2
0.8
0.5
1.1
0.3
1.5
0.5
0.5
0.0
0.9
0.2
21.0
0.7
18.0
13.3
Source:
FY14E
FY15E
2.2
2.2
0.4
0.4
15.9
15.5
2.6
2.7
1.3
1.3
51.1
49.8
0.8
0.8
0.5
0.5
1.3
1.3
0.3
0.3
1.6
1.6
0.6
0.6
0.5
0.5
0.1
0.1
1.0
1.0
0.2
0.2
20.0
20.0
0.8
0.8
18.0
18.5
14.6
15.1
Company, MOSL
Canara Bank: One year forward P/E
Canara Bank:One year forward P/BV
11 February 2013
4

Canara Bank
Quarterly trends
Loan growth moderates further…
…so does deposit growth
Focus on consolidating and de-bulking balance sheet
Above card deposits (including CDs) proportion has come
down from 44% to 27% now
Continue to maintain excess liquidity in the balance sheet (%)
CASA ratio improves marginally QoQ
Though CD ratio has improved to 67.4% v/s 64.1% a quarter
ago it remains sub-optimal
Focus on core deposits and reducing proportion of bulk
deposits is yielding results; SA deposits grew by 6% QoQ
Fee income remains under pressure
Trading gains improves QoQ (INR m)
Decline in loan portfolio and challenging macro-
environment has led to sharp moderation in fee income
in last three quarters
Helped by higher gains from CARE (Credit Analysis and
Research Limited) stake sale trading gains improved
11 February 2013
5

Canara Bank
Quarterly trends (continue...)
Cost to core income ratio stable QoQ (%)
Credit cost increased to 1.1%
Despite weak core income, containment of opex led to
stable cost to income ratio
Credit cost remains elevated on back of higher slippages
and write-offs
Slippages (INR b) decline QoQ (INR b)
In absoulte term GNPA increased 9% QoQ
None of the slippage during the quarter had a ticket size
of more than INR750m
Higher write-offs of INR6.2b v/s INR5.4b in 1HFY13 helped
CBK, contain GNPA
GNPA break-up (%)
Fresh addition of INR8.7b during the quarter (INR b)
PSL forms 50% of overall GNPA
Adjusted for restructuring of SEB and Air India O/S standard
restructured loans are 2.5% of overall loans as compared
to reported of 6.1%
11 February 2013
6

Canara Bank
Quarterly Snapshot
FY12
1Q
2Q
3Q
4Q
FY13
1Q
2Q
3Q
Variation (%)
Cumulative Numbers
QoQ
YoY 9MFY12 9MFY13 YoY Gr (%)
4
11
60
7
-19
-1
6
18
17
19
-3
29
318
-176
-7
-17
-10
-19
52
57
96
86
-265
-690
56,491
21,362
2,290
3,040
2,697
13,335
77,852
33,551
21,472
12,079
44,302
13,767
9,038
2,394
2,335
30,535
6,000
24,535
57,884
21,465
4,238
3,299
1,698
12,230
79,349
37,426
23,651
13,775
41,923
14,656
15,154
-4,543
4,044
27,267
5,800
21,467
2
0
85
9
-37
-8
2
12
10
14
-5
6
68
N.A.
N.A.
-11
-3
-13
Profit and Loss
Net Interest Income
17,688 19,617 19,186 20,402 18,435 19,568 19,880
2
Other Income
5,510
8,228
7,624
7,693
6,926
6,081
8,458
39
Trading profits
-770
1,490
1,570
950
988
740
2,510
239
Forex Income
960
1,070
1,010
1,310
1,299
920
1,080
17
Recoveries
617
1,350
730
980
468
640
590
-8
Core Fees
4,703
4,318
4,314
4,453
4,171
3,781
4,278
13
Total Income
23,198 27,845 26,809 28,094 25,362 25,649 28,338
10
Operating Expenses
10,495 11,847 11,209 13,187 11,424 12,828 13,174
3
Employee
6,677
7,670
7,125
8,259
7,430
7,911
8,311
5
Others
3,818
4,177
4,084
4,928
3,994
4,917
4,864
-1
Operating Profits
12,703 15,998 15,600 14,907 13,938 12,821 15,164
18
Provisions
3,446
5,477
4,845
4,616
4,185
4,211
6,259
49
NPA provisions
2,850
4,768
1,420
3,900
4,770
4,444
5,940
34
Provisions on Invst.
95
609
1,690 -1,070 -2,050 -1,203 -1,290
7
Others
500
100
1,735
1,786
1,465
970
1,609
66
PBT
9,258 10,522 10,756 10,291
9,752
8,610
8,905
3
Taxes
2,000
2,000
2,000
2,000
2,000
2,000
1,800
-10
PAT
7,258
8,522
8,756
8,291
7,752
6,610
7,105
7
Asset Quality
GNPA
36,063 37,933 39,986 40,318 44,966 56,095 60,901
9
NNPA
28,711 31,170 32,654 33,863 37,556 45,686 51,347
12
GNPA (%)
1.7
1.7
1.8
1.7
2.0
2.6
2.8
19
NNPA (%)
1.3
1.4
1.5
1.5
1.7
2.1
2.4
23
PCR (Calculated, %)
20.4
17.8
18.3
16.0
16.5
18.6
15.7
-287
PCR (Reported, %)
69.5
68.6
67.9
67.6
66.5
63.0
61.0
-202
Slippages
13,730 12,360
8,620 11,210 14,970 19,220 13,140
Slippage Ratio
3.2
2.8
1.8
2.1
2.8
3.5
2.4
Credit Cost
0.5
0.9
0.3
0.7
0.8
0.8
1.1
29
Restructured loans* (INR b) 39.7
39.9
47.3
78.9
141.0
149.0
145.0
-3
% of Loans
1.8
1.8
2.2
3.4
6.2
6.9
6.6
-26
Ratios (%)
Fees to Total Income
20.3
15.5
16.1
15.8
16.4
14.7
15.1
Cost to Core Income
46.9
49.5
47.7
53.1
50.5
54.9
54.5
Tax Rate
21.6
19.0
18.6
19.4
20.5
23.2
20.2
CASA (cal)
25.4
25.8
24.0
24.3
23.3
24.8
25.1
Loan/Deposit
71.6
69.7
69.3
71.1
67.4
64.1
67.4
CAR
13.4
12.8
13.2
13.8
13.2
13.1
12.6
Tier I
9.6
9.2
9.5
10.4
10.1
10.1
9.8
Margins - Cumulative (%)
Yield on loans
10.5
10.7
10.9
10.9
11.1
11.2
11.1
-8
Yield On Investments
7.9
7.9
7.9
8.0
8.1
8.1
8.1
0
Cost of Deposits
7.1
7.1
7.3
7.4
7.9
7.8
7.8
-2
Margins
2.4
2.5
2.5
2.5
2.4
2.4
2.4
1
Balance sheet (INR b)
Loans
2,150
2,179
2,176
2,325
2,256
2,158
2,182
1
Deposits
3,002
3,126
3,141
3,271
3,346
3,368
3,240
-4
CASA Deposits
761
808
754
796
779
836
812
-3
Savings Deposits
609
640
634
648
665
705
687
-3
Current Deposits
152
167
121
148
114
131
125
-5
* Bank changed its accounting treatment from borrower-wise classification to facility wise and
undisbursement amount which was taken earlier
11 February 2013
83
207
447
17.1
48.0
19.6
15.4
53.4
21.3
27
20
54
-16
0
3
8
8
3
also excluded
Source: Company/MOSL
7

Canara Bank
Stock Info
EPS: MOSL forecast v/s consensus (INR)
MOSL
Forecast
65.5
80.7
Consensus
Forecast
71.8
85.5
Variation
(%)
-8.7
-5.6
1-year Sensex rebased
FY13
FY14
Shareholding pattern (%)
Dec-12
Promoter
67.7
Domestic Inst
Foreign
Others
12.4
13.3
6.6
Sep-12
67.7
11.1
14.8
6.4
Dec-11
67.7
10.9
14.6
6.7
11 February 2013
8

Canara Bank
Financials and Valuation
11 February 2013
9

Canara Bank
Financials and Valuation
11 February 2013
10

Canara Bank
NOTES
11 February 2013
11

Disclosures
This report is for personal information of the authorized recipient and does not construe to be any investment, legal or taxation advice to you. This research report does not constitute an offer, invitation or inducement
to invest in securities or other investments and Motilal Oswal Securities Limited (hereinafter referred as MOSt) is not soliciting any action based upon it. This report is not for public distribution and has been
furnished to you solely for your information and should not be reproduced or redistributed to any other person in any form.
Unauthorized disclosure, use, dissemination or copying (either whole or partial) of this information, is prohibited. The person accessing this information specifically agrees to exempt MOSt or any of its affiliates
or employees from, any and all responsibility/liability arising from such misuse and agrees not to hold MOSt or any of its affiliates or employees responsible for any such misuse and further agrees to hold MOSt
or any of its affiliates or employees free and harmless from all losses, costs, damages, expenses that may be suffered by the person accessing this information due to any errors and delays.
The information contained herein is based on publicly available data or other sources believed to be reliable. While we would endeavour to update the information herein on reasonable basis, MOSt and/or its
affiliates are under no obligation to update the information. Also there may be regulatory, compliance, or other reasons that may prevent MOSt and/or its affiliates from doing so. MOSt or any of its affiliates or
employees shall not be in any way responsible and liable for any loss or damage that may arise to any person from any inadvertent error in the information contained in this report . MOSt or any of its affiliates
or employees do not provide, at any time, any express or implied warranty of any kind, regarding any matter pertaining to this report, including without limitation the implied warranties of merchantability, fitness
for a particular purpose, and non-infringement. The recipients of this report should rely on their own investigations.
This report is intended for distribution to institutional investors. Recipients who are not institutional investors should seek advice of their independent financial advisor prior to taking any investment decision
based on this report or for any necessary explanation of its contents.
MOSt and/or its affiliates and/or employees may have interests/positions, financial or otherwise in the securities mentioned in this report. To enhance transparency, MOSt has incorporated a Disclosure of Interest
Statement in this document. This should, however, not be treated as endorsement of the views expressed in the report.
Disclosure of Interest Statement
1. Analyst ownership of the stock
2. Group/Directors ownership of the stock
3. Broking relationship with company covered
4. Investment Banking relationship with company covered
Canara Bank
No
No
No
No
Analyst Certification
The views expressed in this research report accurately reflect the personal views of the analyst(s) about the subject securities or issues, and no part of the compensation of the research analyst(s) was, is, or
will be directly or indirectly related to the specific recommendations and views expressed by research analyst(s) in this report. The research analysts, strategists, or research associates principally responsible
for preparation of MOSt research receive compensation based upon various factors, including quality of research, investor client feedback, stock picking, competitive factors and firm revenues.
Regional Disclosures (outside India)
This report is not directed or intended for distribution to or use by any person or entity resident in a state, country or any jurisdiction, where such distribution, publication, availability or use would be contrary to
law, regulation or which would subject MOSt & its group companies to registration or licensing requirements within such jurisdictions.
For U.K.
This report is intended for distribution only to persons having professional experience in matters relating to investments as described in Article 19 of the Financial Services and Markets Act 2000 (Financial
Promotion) Order 2005 (referred to as "investment professionals"). This document must not be acted on or relied on by persons who are not investment professionals. Any investment or investment activity to
which this document relates is only available to investment professionals and will be engaged in only with such persons.
For U.S.
Motilal Oswal Securities Limited (MOSL) is not a registered broker - dealer under the U.S. Securities Exchange Act of 1934, as amended (the"1934 act") and under applicable state laws in the United States.
In addition MOSL is not a registered investment adviser under the U.S. Investment Advisers Act of 1940, as amended (the "Advisers Act" and together with the 1934 Act, the "Acts), and under applicable state
laws in the United States. Accordingly, in the absence of specific exemption under the Acts, any brokerage and investment services provided by MOSL, including the products and services described herein
are not available to or intended for U.S. persons.
This report is intended for distribution only to "Major Institutional Investors" as defined by Rule 15a-6(b)(4) of the Exchange Act and interpretations thereof by SEC (henceforth referred to as "major institutional
investors"). This document must not be acted on or relied on by persons who are not major institutional investors. Any investment or investment activity to which this document relates is only available to major
institutional investors and will be engaged in only with major institutional investors. In reliance on the exemption from registration provided by Rule 15a-6 of the U.S. Securities Exchange Act of 1934, as amended
(the "Exchange Act") and interpretations thereof by the U.S. Securities and Exchange Commission ("SEC") in order to conduct business with Institutional Investors based in the U.S., MOSL has entered into
a chaperoning agreement with a U.S. registered broker-dealer, Marco Polo Securities Inc. ("Marco Polo"). Any business interaction pursuant to this report will have to be executed within the provisions of this
chaperoning agreement.
This website and its respective contents does not constitute an offer or invitation to purchase or subscribe for any securities or solicitation of any investments or investment services and/or shall not be considered
as an advertisement tool. "U.S. Persons" are generally defined as a natural person, residing in the United States or any entity organized or incorporated under the laws of the United States. US Citizens living
abroad may also be deemed "U.S. Persons " under certain rules.
The Research Analysts contributing to the report may not be registered /qualified as research analyst with FINRA. Such research analyst may not be associated persons of the U.S. registered broker-dealer, Marco
Polo, and therefore, may not be subject to NASD rule 2711 and NYSE Rule 472 restrictions on communication with a subject company, public appearances and trading securities held by a research analyst account.
For Singapore
Motilal Oswal Capital Markets Singapore Pte Limited is acting as an exempt financial advisor under section 23(1)(f) of the Financial Advisers Act(FAA) read with regulation 17(1)(d) of the Financial Advisors
Regulations and is a subsidiary of Motilal Oswal Securities Limited in India. This research is distributed in Singapore by Motilal Oswal Capital Markets Singapore Pte Limited and it is only directed in Singapore
to accredited investors, as defined in the Financial Advisers Regulations and the Securities and Futures Act (Chapter 289), as amended from time to time.
In respect of any matter arising from or in connection with the research you could contact the following representatives of Motilal Oswal Capital Markets Singapore Pte Limited:
Nihar Oza
Kadambari Balachandran
Email: niharoza.sg@motilaloswal.com
Email : kadambari.balachandran@motilaloswal.com
Contact: (+65) 68189232
Contact: (+65) 68189233 / 65249115
Office address: 21 (Suite 31), 16 Collyer Quay, Singapore 049318
Motilal Oswal Securities Ltd
Motilal Oswal Tower, Level 9, Sayani Road, Prabhadevi, Mumbai 400 025
Phone: +91 22 3982 5500 E-mail: reports@motilaloswal.com