Metals Weekly
15 April 2013
Metals Weekly
Valuations: Indian companies
Price
EV/EBITDA P/BV
(INR) FY14E FY15E FY14E
Steel
Tata Steel
SAIL
JSW Steel
JSPL
NMDC
Sesa Goa
Non-ferrous
Sterlite Inds.
HZL
Nalco
Hindalco
299
60
679
328
125
148
89
117
34
92
6.0
5.9
7.1
7.8
3.2
10.2
3.0
3.2
4.0
5.9
6.2
5.8
6.3
6.2
2.7
5.0
2.6
2.5
3.0
5.4
1.2
0.6
0.9
1.4
1.5
0.9
0.6
1.3
0.7
0.8
TMT- Mumbai (INR/ton)
HRC- Mumbai (INR/ton)
HRC (USD/ton) fob CIS
Metal Prices
CMP
15-Apr
34,900
36,565
565
%
1
0
0
1
1
4
-2
-2
0
0
-3
-1
0
-3
1
2
-1
-5
-4
0
0
Week
8-Apr
34,600
36,565
565
19,950
24,200
138
265
384
5,203
1,845
102
1,142
1,848
102
588
7,376
405
29,310
51,270
2,042
1.02
Quarter
% 1-Apr
0 34,900
0 36,565
0
565
2 19,800
1 24,200
4
138
-2
265
-2
385
-1
-2
-3
-3
-1
-3
4
-1
-1
5,228
1,881
102
1,171
1,870
102
571
7,582
408
YTD CY13
% 1-Jan
-3 35,900
2 35,676
5
538
-5
1
1
-21
-1
0
-10
-11
-7
-9
-11
85
-5
-9
-9
-14
-13
4
21,150
24,200
141
330
378
5,210
2,040
112
1,221
2,034
111
321
7,915
441
30,631
57,172
2,340
0.98
Sponge iron - Raipur (INR/ton)
20,150
Pig iron - Raipur (INR/ton)
24,500
Iron ore spot (USD/ton) cfr China
143
Coke (USD/ton) fob
260
Shred. scrap (USD/ton) Rotterdam
376
LME inventories (‘000 ton)
LME Spot (USD/ton)
Indian prices (INR ‘000/ton)
LME inventories (‘000 ton)
LME Spot (USD/ton)
Indian prices (INR ‘000/ton)
LME inventories (‘000 ton)
LME Spot (USD/ton)
Indian prices (INR ‘000/ton)
5,195
1,841
99
1,136
1,843
99
594
7,509
402
Note: Detailed table on pg 23
Source: MOSL
Valuations: Global companies
Price
EV/EBITDA
CY13 CY14
P/BV
CY13
Mining
BHP
AUD 33.4
6.9
5.9
2.4
FMG
AUD 4.0
7.2
5.1
2.3
Rio Tinto AUD 56.9
5.6
5.2
1.8
Vale
USD 17.5
5.3
5.3
1.1
Teck Res. USD 27.8
6.3
5.3
0.9
Xstrata
GBp 1043
7.0
6.2
1.0
Steel
A. Mittal
EUR 9.3
6.0
5.0
0.4
Posco
k KRW 321
5.1
4.7
0.7
US Steel USD 17.5
5.3
4.2
0.7
Nucor
USD 44.3
8.6
6.2
1.8
JFE
JPY 2030 11.4
7.3
0.8
Gerdau
BRL 14.5
7.3
6.0
1.1
Bao Steel CNY 4.9
5.9
5.6
0.8
Non-ferrous
Alcoa
USD 8.2
7.0
6.0
0.7
Norsk HydroNOK 25.7 7.5
5.6
0.7
Rusal
HKD 4.3 15.2 13.5
0.7
Detailed on pg 23
Source: Bloomberg
Gold (INR/10gms)
27,748
Sliver (INR/1kg)
49,313
Lead Spot LME (USD/ton)
2,046
FC 6-8% C basis 60% Cr (USD/lb Cr) 1.02
INR/USD
BDI
-6 29,526
-6 52,621
-2 2,094
-1
1.03
54.7
0
54.6
0
54.5
0
54.7
875
2
858 -4
910
25
699
Source: Metal Bulletin, Bloomberg, Steel Mint, MOSL
Steel prices remain subdued; Iron ore up 4% WoW on Chinese
restocking
Steel prices continue to remain weak and declined 1.5% , 0.5% and 1.7%
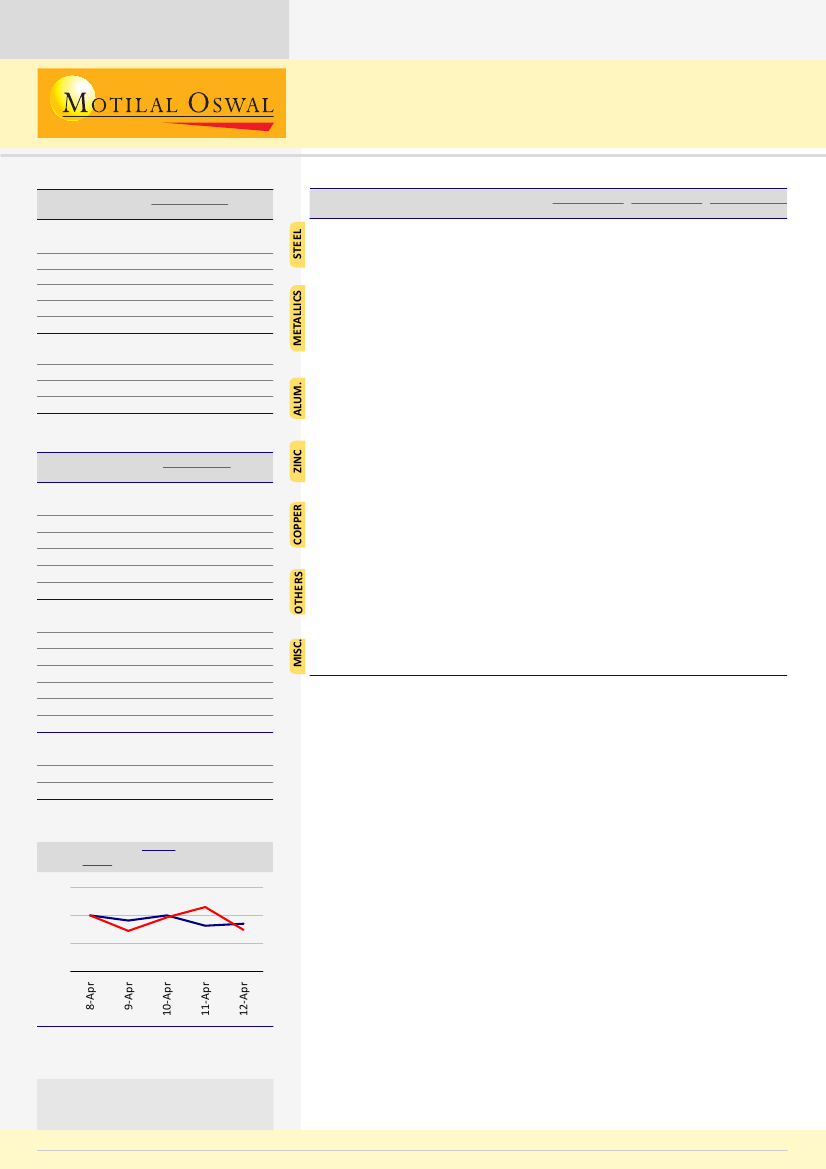
BSE Metals Index v/s Sensex
BSE Metals Index
Sensex
102
100
98
96
Source: Bloomberg
Note: Indexed to 100 on 8 April 2013
Stock performance table on pg 24
Investors are advised to refer through
disclosures made at the end of the
Research Report.
WoW respectively in Europe, Turkey and North America. Prices were
mixed in China while they were flat WoW in CIS. Baoshan Iron and Steel,
had rolled over May prices after lifting them for five months in a row
due to uncertain demand conditions in China.
Indian steel prices showed marginal uptrend. TMT Mumbai prices
increased 0.9% WoW while Sponge iron prices increased 1% WoW. Pellet
prices were flat WoW.
Iron ore prices(63.5% Fe CFR China) increased 4% WoW to USD143/t due
to restocking by China . Coking coal prices (Premium Low vol, Fob
Australia) declined by USD2WoW to USD151/t.
Base metals price were stable, after witnessing significant downtrend
in past couple of weeks. Aluminium, Lead and Zinc prices were flat
WoW while Copper prices increased 2% WoW.
World steel association (WSA) has cut steel demand growth estimate by
90bps to 1.2% for CY12 and by 30bps to 2.9% for CY13 because EU27, CIS,
NAFTA and Middle East are now expected to grow slower.
Sanjay Jain
(SanjayJain@MotilalOswal.com); Tel:+91 22 3982 5412
15 April 2013
Pavas Pethia
(Pavas.Pethia@MotilalOswal.com); Tel:+91 22 3982 5413
1

Metals Weekly
Contents
Page No.
Ferrous
..................................................................................
3-10
India ...................................................................................................... 3 & 4
European Union .......................................................................................... 5
China ............................................................................................................ 6
Other regions ........................................................................................ 7 & 8
Steel raw material ............................................................................... 9 & 10
Ferro alloys ................................................................................................ 11
Non ferrous
..........................................................................
12-18
Aluminum ................................................................................................. 12
Copper ....................................................................................................... 14
Zinc ............................................................................................................ 15
Lead ........................................................................................................... 16
Commodity curve analysis ................. ...................................................17
China non-ferrous trade data ................ ...............................................18
Key indicators
......................................................................
19-20
Industrial production growth across the globe
........................
21
BSE Exchange announcements
................................................
22
Metals valuation matrix
...........................................................
23
Metals stock performance
.......................................................
24
15 April 2013
2

Metals Weekly
Ferrous
Ferrous
INDIA
Indian flat steel prices import parity (INR/T, exl. ED & VAT)
HRC Mumbai
39,000
37,000
35,000
33,000
31,000
Indian long steel price (INR/T, exl. ED & VAT)
42,000
40,000
TMT (Mumbai)
TMT Mumbai prices increased
0.9% WoW to INR 34,900/t
38,000
36,000
34,000
32,000
Steel intermediates prices (INR/T, exl. ED & VAT)
25,500
Sponge (Raipur)
Sponge iron prices increased 1%
WoW to INR 20,150/t
23,500
21,500
19,500
India: Monthly crude steel production
India
YoY(%
)
7.0
6.5
6.0
5.5
5.0
30
20
10
0
-10
Source: SteelMint, WSA, MOSL
15 April 2013
3

Metals Weekly
Ferrous
INDIA
Scrap Mandi (INR/t)
33,000
Scrap (Ma ndi )
Scrap (Mandi) prices decreased 0.2%
WoW to INR29,400/t
31,000
29,000
27,000
Iron ore lumps (INR/t)
NMDC 6- 20mm ( CG)
Lumps 5- 18 ( Odisha)
9,000
8,000
7,000
6,000
5,000
4,000
Iron ore fines (INR/t)
Fines 63%( Odisha)
NMDC Fines
3,500
3,100
2,700
2,300
1,900
1,500
Pellet (Barbil) INR/t
Pellet ( Bar bil)
9,500
9,000
Pellet prices were flat
WoW at INR7,500/t
8,500
8,000
7,500
7,000
Source: SteelMint, WSA, MOSL
15 April 2013
4

Metals Weekly
European Union
European HRC prices (EUR/ton)
Europe
650
600
European HRC prices declined
1.5% WoW to Euro485/t
550
500
450
400
Rotterdam: shredded scrap prices (USD/t)
480
450
Rotterdam export Shredded scrap
prices decreased 2% WoW to
USD376/t
420
390
360
330
European wire rods prices (USD/ton)
Wir e Rods ( Export s)
800
Wire rods exports prices increased
1.6% WoW to USD618/t
750
700
650
600
European Union: Monthly crude steel production
EU
YoY ( %)
17
15
13
11
20
10
0
-10
Source: Metal Bulletin, Bloomberg, WSA, MOSL
15 April 2013
5

Metals Weekly
China
China domestic prices (USD/ton)
740
HRC
Rebar
China HRC increased 0.8%
WoW while Rebar prices
decreased 0.3% WoW
680
620
560
500
Steel trade (m ton)
Expor t s
Impor t s
6
4
2
0
Steel inventories (m tons)
9
8
7
6
5
Monthly crude steel production
China
YoY ( %)
70
62
54
46
38
30
20
15
10
5
0
-5
-10
Source: Metal Bulletin, Bloomberg, WSA, MOSL
15 April 2013
6

Metals Weekly
Other regions
CIS HRC export prices (USD/ton)
CIS Expor t s (HRC)
660
620
CIS export HRC prices were flat WoW
at USD565/t
580
540
500
Turkish export billets (USD/ton)
650
600
Tur kish Exp Billet s
Turkish export billet prices declined
0.5% WoW to USD548/t
550
500
North America HRC prices (USD/ton)
700
North America domestic HRC prices
decreased 1.7% WoW to USD590/t
650
600
550
CIS: Monthly crude steel production
CIS
YoY ( %)
10
9
8
7
11
4
-3
-10
Source: Metal Bulletin, WSA, Bloomberg, MOSL
15 April 2013
7

Metals Weekly
Other regions
North America: Monthly crude steel production
Nor t h America
YoY (%)
11
10
9
8
20
10
0
-10
-20
Global: Monthly crude steel production
Global
YoY ( %)
140
130
20
0
120
110
-20
Global: Monthly crude steel capacity utilization
Capacit y Ut ilizat ion
84
81
78
75
72
69
Source: Bloomberg, WSA, MOSL
15 April 2013
8

Metals Weekly
Steel raw materials
Indian 63.5% grade iron-ore fines in China (USD/ton)
CIF
FOB
160
China spot CFR iron
ore prices increased 4% WoW to
USD143/ton DMT
140
120
100
80
OTC iron-ore swaps (USD/ton)
3Q13
4Q13
2014
150
130
110
90
China iron-ore production and imports (m tons)
Ore Import s
Ore Pr od
Pig iron prod (RHS)
150
120
90
60
55
50
45
60
30
40
35
China iron-ore inventories (m tons)
110
100
Iron ore stock piles in China continue
to remain close to two year low
levels
90
80
70
60
Source: Metal Bulletin, Bloomberg, MOSL
15 April 2013
9

Metals Weekly
Steel raw materials
Freight rates to China (USD/ton)
Br azil
Aust r alia
India
42
28
14
0
Coal price index
Richards Bay Steam Coal
135
Richards Bay Steam Coal prices
increased 1.3% WoW to USD81/ton
115
95
75
Coke price index
China coke expor t spot ( LHS)
China 1st gr ade met allur gical coke
450
400
350
300
250
2,200
2,175
2,150
2,125
2,100
Coking coal (USD/t)
Spot coking coal ( f ob Aust r alia)
270
240
Spot coking coal FOB Australia
declined by USD2WoW to USD151/t
210
180
150
120
Source: Metal Bulletin, Bloomberg, MOSL
15 April 2013
10

Metals Weekly
Ferro alloys
China’s imports of manganese ore and conc
Impor t s
Pr ices ( RHS)
1,400
1,100
800
500
200
280
220
160
100
Manganese and chrome ore FOB spot prices
Mn 48%Eur ope spot
40%Chrome Af rica ( RHS)
8.3
7.0
5.8
4.5
300
250
200
150
100
Ferro chrome CIF prices (CNY/t)
Fe Chr ome 50%Cr China
Fe Chr ome 63%Cr Pit t ur sburgh
13,000
11,500
10,000
8,500
7,000
5,500
Source: Metal Bulletin, Bloomberg, MOSL
15 April 2013
11

Metals Weekly
Non-ferrous
Non-ferrous
Aluminum
LME inventories and prices
Invent ories
Spot
2,300
5.6
5.2
4.8
Aluminum spot prices were
flat WoW at 1,841/ton
2,100
1,900
1,700
4.4
4.0
Global primary aluminum monthly production and YoY growth
Pr oduct ion
YoY
4,250
4,000
3,750
3,500
3,250
20
8
-4
-16
China primary aluminum monthly production and YoY growth
Pr oduct ion
YoY
1.8
1.6
1.4
1.2
1.0
40
20
0
-20
India: Company-wise primary aluminum monthly production
Hindalco
Balco
Nalco
VAL
Source: Metal Bulletin, Bloomberg, MOSL
15 April 2013
12

Metals Weekly
Non-ferrous
Aluminum
Aluminum raw material and power cost for marginal producer in US
CPC
Alumina
Power
LME
4,000
3,000
2,000
1,000
0
CPC US
700
575
450
325
200
Alumina
480
400
320
240
160
Industrial power US (Lousiana)
10.0
8.5
7.0
5.5
4.0
Source: Metal Bulletin, Bloomberg, Industry, MOSL
15 April 2013
13

Metals Weekly
Non-ferrous
Copper
LME inventories and prices
Invent or ies
Spot
9,000
0.6
0.5
0.4
0.3
0.2
Copper spot prices increased
2% WoW to 7,509/ton
8,500
8,000
7,500
7,000
Global refined copper monthly production and YoY growth
Pr oduct ion
YoY - RHS
1.9
1.8
1.7
1.6
1.6
1.5
1.4
7.5
5.0
2.5
0.0
-2.5
-5.0
China: Refined copper monthly production and YoY growth
Product ion
YoY - RHS
0.60
0.54
0.48
0.42
0.36
0.30
36
25
14
3
-8
India: Company-wise refined copper monthly production
80
60
40
20
0
Hindalco
HCL
St er lit e
Source: Metal Bulletin, Bloomberg, MOSL
15 April 2013
14

Metals Weekly
Non-ferrous
Zinc
LME inventories and prices
Invent or ies
Spot
2,300
1.3
1.2
Zinc spot prices were flat
WoW at 1,843/ton
2,100
1.1
1.0
1,900
0.9
0.8
1,700
0.7
Global refined zinc monthly production and YoY growth
Pr oduct ion
YoY - RHS
1.2
1.1
1.1
1.0
0.9
22
14
6
-2
-10
China: Refined zinc monthly production and YoY growth
Pr oduct ion
YoY - RHS
0.5
0.4
0.3
0.3
0.2
60
40
19
-2
-22
India: Company-wise refined zinc monthly production
HZL
BZL
4 3
2
3
2 2
2 2 2 2 2 2
2
0
2
2
2
2 2
3 3 2 2
3 3
Source: Metal Bulletin, Bloomberg, MOSL
15 April 2013
15

Metals Weekly
Non-ferrous
Lead
LME inventories and prices
Invent or ies
Spot
2,600
2,400
0.40
0.37
0.34
0.31
Lead spot prices were flat
WoW at 2,046/ton
2,200
2,000
1,800
1,600
0.28
0.25
0.22
Global refined lead monthly production and YoY growth
Product ion
YoY - RHS
1.0
0.9
0.8
0.7
0.6
25
15
5
-5
-15
China: Refined lead monthly production and YoY growth
Pr oduct ion
YoY - RHS
0.5
0.4
0.3
0.2
40
20
0
-20
-40
India: Company-wise refined lead monthly production
HZL
Source: Metal Bulletin, Bloomberg, MOSL
15 April 2013
16

Metals Weekly
Commodity forward curves
LME aluminum (USD/ton)
Cur rent
1-week ago
3- mont h ago
2,600
2,400
2,200
2,000
1,800
LME copper (USD/ton)
Cur rent
1- week ago
3- mont h ago
8,300
8,100
7,900
7,700
7,500
7,300
LME zinc futures (USD/ton)
Cur r ent
1- week ago
3-mont h ago
2,300
2,200
2,100
2,000
1,900
1,800
Base metals US spot premium (USD/ton)
Aluminium
Zinc
Copper
300
235
170
105
40
Source: Metal Bulletin, Bloomberg, MOSL
15 April 2013
17

Metals Weekly
China non-ferrous trade data
China’s aluminum trade ('000 tons)
Import s
Expor t s
400
300
200
100
0
China’s refined copper trade ('000 tons)
Impor t s
Export s
500
400
300
200
100
0
China’s refined zinc trade ('000 tons)
Expor t
Impor t
75
50
25
0
China’s alumina imports ('000 tons) and prices (USD/ton)
Impor t s
Pr ices ( RHS)
800
600
400
200
0
600
450
300
150
0
Source: Metal Bulletin, Bloomberg, MOSL
15 April 2013
18

Metals Weekly
Key indicators
China new loan growth
1,200
900
600
300
China PMI
54
52
50
48
China: Fixed asset investment
27
24
21
18
Currency movement with respect to the rupee
USD (LHS)
GBP
EURO
60
90
82
74
The rupee depreciated
0.1% WoW against the US dollar and
was trading at INR54.66/USD
56
52
48
44
40
66
58
Source: Bloomberg, MOSL
15 April 2013
19

Metals Weekly
Key indicators
(Contd..)
China Energy Production Electricity (b kwh)
450
400
350
300
250
200
Elect r icit y
YoY ( %, RHS)
50
40
30
20
10
0
-10
China Monthly Trade YoY (%)
60
Impor t
Expor t
40
20
0
-20
China Price Index YoY (%)
PPI
CPI
9
6
3
0
-3
-6
China GDP YoY (%)
10
9
8
7
GDP
Source: Bloomberg, MOSL
15 April 2013
20

Metals Weekly
Industrial production growth
The UK and the US
UK
USA
6
3
0
-3
-6
Japan
20
10
0
-10
-20
European Union
Fr ance
Ger many
It aly
20
8
-4
-16
BRIC
Russia
Br azil
India
China
18
12
6
0
-6
Source: Bloomberg, MOSL
15 April 2013
21

Metals Weekly
Stock Exchange announcements
The committee of Directors of
Tata Steel(TSL)
and Board of Directors of
Tata Metaliks (TML) has approved the merger of Tata Steel, Tata Metaliks
and Tata Metaliks Kubota Pipes. Shareholders of TML shall be issued 4
shares of TSL for every 29 shares of TSL. Kalimati Investment Company
Limited (KICL), 100% subsidiary of TSL is also set to be merged with TSL
after meeting of respective directors approved the merger. TSL
completed 4QFY13 with an 26% YoY and 29% YoY increase in steel
production and sales volumes.
Sesa
announced its consolidated production release for 4QFY13 and FY13.
Iron ore operations continue to be affected by suspension of mining in
Goa and Karnataka. Production of pig iron and metallurgical coke were
up 75% YoY and 48% YoY to 104kt and 94kt in 4QFY13. At Liberia iron ore
project, exploration activities are progressing well, and it remain on
track to deliver the first shipment by end FY2014
Sterlite
announced its consolidated production release for 4QFY13 and
FY13. Zinc International reported 4% YoY drop in production in 4QFY13
to 102kt. Indian copper business reported 7% YoY increase in production
to 86kt in 4QFY13. Balco's Aluminium production was flat YoY at 62kt
while power production at SEL improved 24% YoY to 2,073mu in 4QFY13.
Hindustan Zinc
announced its production release for 4QFY13 and FY13.
Mined metal production at HZL increased 16% YoY to 260kit in 4QFY13. It
sold 61kt of surplus Zinc concentrate in 4QFY13.
Forthcoming Results
Tata Sponge-
April 22, 2013
15 April 2013
22

Metals Weekly
Metals
Valuation Matrix
Valuations: Indian companies
Rating
Steel
Tata Steel
SAIL
JSW Steel
JSPL
NMDC
Sesa Goa
Non-Ferrous
Sterlite Inds.
Hindustan Zinc
Nalco
Hindalco
Price Mkt Cap
(INR) (USD M)
299
60
679
328
125
148
89
117
34
92
5,408
4,563
3,045
5,692
9,202
2,391
5,582
8,997
1,622
3,379
EPS (INR)
FY13E
FY14E
-5.6
7.6
37.7
37.6
17.2
29.3
17.4
15.7
2.0
16.5
31.8
7.5
25.5
38.2
17.8
24.5
17.0
15.7
3.2
21.0
FY15E
28.0
6.9
66.7
42.0
19.9
26.7
16.3
15.6
3.5
19.9
P/E (X)
FY14E FY15E
9.4
7.9
26.6
8.6
7.0
6.0
5.2
7.4
10.6
4.4
10.7
8.6
10.2
7.8
6.3
5.5
5.5
7.5
9.7
4.6
EV/EBITDA (X)
FY14E FY15E
6.0
5.9
7.1
7.8
3.2
10.2
3.0
3.2
4.0
5.9
6.2
5.8
6.3
6.2
2.7
5.0
2.6
2.5
3.0
5.4
P/B (X)
FY14E FY15E
1.2
0.6
0.9
1.4
1.5
0.9
1.1
0.5
0.8
1.2
1.3
0.9
Sell
Sell
Sell
Sell
Buy
Buy
Buy
Buy
Neutral
Buy
0.6
0.5
1.3
1.2
0.7
0.7
0.8
0.7
Source: MOSL
Valuations: Global companies
BBG
Code
Mining
BHP-Billiton
FMG
Rio Tinto
Vale
Teck Resources
Xstrata
Steel
Arcelor Mittal
Posco
US Steel
Nucor
JFE
Gerdau
Bao Steel
Non-Ferrous
Alcoa
Norsk Hydro
Rusal
BHP AU
FMG AU
RIO AU
Vale US
TCK US
XTA LN
MT NA
005490 KS
X US
NUE US
5411 JT
GGBR4 BZ
600019 CH
AA US
NHY NO
486 HK
Currency
Price
Mkt Cap
(USD M)
167,904
12,072
91,116
91,982
16,107
47,965
20,314
25,059
2,518
14,080
12,220
12,260
13,365
8,790
9,275
8,025
P/E (X)
CY13
13.1
7.8
9.5
7.5
12.8
12.8
18.1
11.1
17.6
20.4
29.4
13.2
11.5
17.1
26.7
9.0
CY14
10.9
5.6
8.5
7.8
10.1
10.7
9.1
10.2
8.9
11.9
9.1
9.2
9.9
10.9
14.3
7.0
EV/EBITDA(X)
CY13
CY14
6.9
7.2
5.6
5.3
6.3
7.0
6.0
5.1
5.3
8.6
11.4
7.3
5.9
7.0
7.5
15.2
5.9
5.1
5.2
5.3
5.3
6.2
5.0
4.7
4.2
6.2
7.3
6.0
5.6
P/BV
CY13
2.4
2.3
1.8
1.1
0.9
1.0
0.4
0.7
0.7
1.8
0.8
1.1
0.8
AUD
AUD
AUD
USD
USD
GBp
EUR
k KRW
USD
USD
JPY
BRL
CNY
USD
NOK
HKD
33.4
4.0
56.9
17.5
27.8
1,043.0
9.3
320.5
17.5
44.3
2,030.0
14.5
4.9
8.2
25.7
4.3
6.0
0.7
5.6
0.7
13.5
0.7
Source: Bloomberg
15 April 2013
23

Metals Weekly
Metals Stock
Performance
Among large-cap companies,
Hindustan Zinc has outperformed
and Nalco has underperformed over
the last one month
Metals stock performance on absolute and relative basis (%)
Months
Steel
Tata Steel
SAIL
JSW Steel
JSPL
NMDC
Sesa Goa
Non-ferrous
Sterlite Inds.
Hindustan Zinc
Nalco
Hindalco
Mid Caps
Monnet Ispat
Godawari
Sarda Energy
Tata Sponge
Adhunik Metaliks
Bhushan Steel
Jai Balaji
Rain Commodities
Prakash Industries
SENSEX
Best performer
Absolute Perf (%)
1
3
6
-15.5
-13.4
-3.0
-8.1
-13.2
-10.2
-10.7
-2.1
-16.7
-4.4
-10.8
-8.0
-10.6
-5.8
-16.7
-0.7
-8.5
8.9
-1.8
-6.1
-28.2
-35.2
-18.3
-24.2
-22.4
-24.0
-24.4
-13.4
-31.8
-28.0
-22.9
-29.6
-22.7
-4.9
-32.9
5.2
-25.0
27.1
-27.4
-7.2
-28.8
-30.7
-11.4
-21.5
-33.5
-15.0
-14.0
-14.3
-32.8
-22.3
-31.0
-31.8
-23.7
-10.9
-11.1
-7.9
-29.4
13.6
-30.2
-2.3
12
-33.4
-36.3
-7.9
-34.2
-23.8
-20.7
-16.9
-5.5
-42.2
-26.6
-55.8
-28.0
-28.6
-11.5
-32.1
16.6
-39.0
19.3
-24.1
6.7
Relative Perf to Sensex (%)
1
3
6
12
-9.4
-7.3
3.1
-2.0
-7.1
-4.1
-4.6
4.0
-10.6
1.7
-21.0
-28.0
-11.1
-16.9
-15.2
-16.7
-17.1
-6.2
-24.5
-20.7
-26.5
-28.4
-9.1
-19.2
-31.1
-12.7
-11.6
-12.0
-30.5
-20.0
-40.2
-43.0
-14.6
-40.9
-30.5
-27.4
-23.6
-12.2
-48.9
-33.3
Among mid-cap companies, Rain
Commodities outperformed and
Adhunik Metaliks has
underperformed over the last one
month
Worst performer
-4.7 -15.6 -28.7 -62.6
-1.9 -22.4 -29.5 -34.7
-4.5 -15.5 -21.4 -35.3
0.3
2.3
-8.6 -18.3
-10.6 -25.6
-8.8 -38.8
5.4
12.4
-5.6
9.8
-2.4 -17.8 -27.1 -45.7
15.0
34.3
15.9
12.6
4.3 -20.2 -27.9 -30.9
-
-
-
-
Source: MOSL, Bloomberg
Global metals stock performance on absolute basis (%)
1week
Mining
Rio Tinto
BHP Billiton
Vale
FMG
Xstrata
Anglo American
Vedanta
Steel
US Steel
Nucor
Arcelor Mittal
Bao Steel
Posco
JFE Holdings
Nippon
Thyssen Krupp
Voest Alpine
Gerdau
Aluminium
Alcoa
Rusal
Chalco
Best performer
3.0
-2.4
0.4
4.1
0.9
-0.2
8.6
1.3
0.8
0.4
-0.4
3.7
4.4
8.6
-2.4
2.0
0.0
1month
-7.0
-10.3
-0.5
-8.3
-10.4
-13.2
-0.8
-13.7
-4.9
-18.3
-1.0
-1.8
0.0
-1.6
-23.8
-10.0
-3.4
Absolute Perf (%)
3 months
6 months
-11.2
-13.1
-14.0
-21.2
-11.3
-19.6
-4.9
-29.9
-2.5
-28.6
-3.6
-10.2
16.3
13.5
-25.3
-12.0
-17.5
-8.1
-19.0
-26.8
1.9
-4.9
-4.0
-3.2
9.4
-10.0
6.1
-17.6
14.9
-18.4
4.6
-8.1
94.6
57.1
-21.1
-0.7
-20.1
12 months
-10.6
-7.5
-26.8
-37.1
-5.4
-27.4
-3.0
-38.1
6.6
-29.3
-0.2
-16.0
20.7
23.4
-20.5
-1.3
-21.8
Among global mining companies,
Vale was the best performer while
Anglo American was the worst
performing stock over the
last one month
Among global steel majors,
JFE Holdings was the best performer
while Thyssen Krupp was the
worst performing stock over
the last one month
-2.0
-4.8
-0.2
-1.0
2.1
-7.7
Worst performer
-5.4
-16.5
-6.0
-28.8
-13.5
-23.7
Source: MOSL, Bloomberg
15 April 2013
24

Motilal Oswal
Product Gallery
weekly
Motilal Oswal
Sector
Periodicals
power utilities monthly

Metals Weekly
Disclosures
This report is for personal information of the authorized recipient and does not construe to be any investment, legal or taxation advice to you. This research report does not constitute an offer, invitation or inducement
to invest in securities or other investments and Motilal Oswal Securities Limited (hereinafter referred as MOSt) is not soliciting any action based upon it. This report is not for public distribution and has been
furnished to you solely for your information and should not be reproduced or redistributed to any other person in any form.
Unauthorized disclosure, use, dissemination or copying (either whole or partial) of this information, is prohibited. The person accessing this information specifically agrees to exempt MOSt or any of its affiliates
or employees from, any and all responsibility/liability arising from such misuse and agrees not to hold MOSt or any of its affiliates or employees responsible for any such misuse and further agrees to hold MOSt
or any of its affiliates or employees free and harmless from all losses, costs, damages, expenses that may be suffered by the person accessing this information due to any errors and delays.
The information contained herein is based on publicly available data or other sources believed to be reliable. While we would endeavour to update the information herein on reasonable basis, MOSt and/or its
affiliates are under no obligation to update the information. Also there may be regulatory, compliance, or other reasons that may prevent MOSt and/or its affiliates from doing so. MOSt or any of its affiliates or
employees shall not be in any way responsible and liable for any loss or damage that may arise to any person from any inadvertent error in the information contained in this report . MOSt or any of its affiliates
or employees do not provide, at any time, any express or implied warranty of any kind, regarding any matter pertaining to this report, including without limitation the implied warranties of merchantability, fitness
for a particular purpose, and non-infringement. The recipients of this report should rely on their own investigations.
This report is intended for distribution to institutional investors. Recipients who are not institutional investors should seek advice of their independent financial advisor prior to taking any investment decision
based on this report or for any necessary explanation of its contents.
MOSt and/or its affiliates and/or employees may have interests/positions, financial or otherwise in the securities mentioned in this report. To enhance transparency, MOSt has incorporated a Disclosure of Interest
Statement in this document. This should, however, not be treated as endorsement of the views expressed in the report.
Disclosure of Interest Statement
1. Analyst ownership of the stock
2. Group/Directors ownership of the stock
3. Broking relationship with company covered
4. Investment Banking relationship with company covered
Companies where there is interest
Rain Commodities, Sesa Goa
None
None
None
Analyst Certification
The views expressed in this research report accurately reflect the personal views of the analyst(s) about the subject securities or issues, and no part of the compensation of the research analyst(s) was, is, or
will be directly or indirectly related to the specific recommendations and views expressed by research analyst(s) in this report. The research analysts, strategists, or research associates principally responsible
for preparation of MOSt research receive compensation based upon various factors, including quality of research, investor client feedback, stock picking, competitive factors and firm revenues.
Regional Disclosures (outside India)
This report is not directed or intended for distribution to or use by any person or entity resident in a state, country or any jurisdiction, where such distribution, publication, availability or use would be contrary to
law, regulation or which would subject MOSt & its group companies to registration or licensing requirements within such jurisdictions.
For U.K.
This report is intended for distribution only to persons having professional experience in matters relating to investments as described in Article 19 of the Financial Services and Markets Act 2000 (Financial
Promotion) Order 2005 (referred to as "investment professionals"). This document must not be acted on or relied on by persons who are not investment professionals. Any investment or investment activity to
which this document relates is only available to investment professionals and will be engaged in only with such persons.
For U.S.
Motilal Oswal Securities Limited (MOSL) is not a registered broker - dealer under the U.S. Securities Exchange Act of 1934, as amended (the"1934 act") and under applicable state laws in the United States.
In addition MOSL is not a registered investment adviser under the U.S. Investment Advisers Act of 1940, as amended (the "Advisers Act" and together with the 1934 Act, the "Acts), and under applicable state
laws in the United States. Accordingly, in the absence of specific exemption under the Acts, any brokerage and investment services provided by MOSL, including the products and services described herein
are not available to or intended for U.S. persons.
This report is intended for distribution only to "Major Institutional Investors" as defined by Rule 15a-6(b)(4) of the Exchange Act and interpretations thereof by SEC (henceforth referred to as "major institutional
investors"). This document must not be acted on or relied on by persons who are not major institutional investors. Any investment or investment activity to which this document relates is only available to major
institutional investors and will be engaged in only with major institutional investors. In reliance on the exemption from registration provided by Rule 15a-6 of the U.S. Securities Exchange Act of 1934, as amended
(the "Exchange Act") and interpretations thereof by the U.S. Securities and Exchange Commission ("SEC") in order to conduct business with Institutional Investors based in the U.S., MOSL has entered into
a chaperoning agreement with a U.S. registered broker-dealer, Motilal Oswal Securities International Private Limited. ("MOSIPL"). Any business interaction pursuant to this report will have to be executed within
the provisions of this chaperoning agreement.
The Research Analysts contributing to the report may not be registered /qualified as research analyst with FINRA. Such research analyst may not be associated persons of the U.S. registered broker-dealer,
MOSIPL, and therefore, may not be subject to NASD rule 2711 and NYSE Rule 472 restrictions on communication with a subject company, public appearances and trading securities held by a research analyst
account.
For Singapore
Motilal Oswal Capital Markets Singapore Pte Limited is acting as an exempt financial advisor under section 23(1)(f) of the Financial Advisers Act(FAA) read with regulation 17(1)(d) of the Financial Advisors
Regulations and is a subsidiary of Motilal Oswal Securities Limited in India. This research is distributed in Singapore by Motilal Oswal Capital Markets Singapore Pte Limited and it is only directed in Singapore
to accredited investors, as defined in the Financial Advisers Regulations and the Securities and Futures Act (Chapter 289), as amended from time to time.
In respect of any matter arising from or in connection with the research you could contact the following representatives of Motilal Oswal Capital Markets Singapore Pte Limited:
Nihar Oza
Kadambari Balachandran
Email: niharoza.sg@motilaloswal.com
Email : kadambari.balachandran@motilaloswal.com
Contact: (+65) 68189232
Contact: (+65) 68189233 / 65249115
Office address: 21 (Suite 31), 16 Collyer Quay, Singapore 049318
Motilal Oswal Securities Ltd
Motilal Oswal Tower, Level 9, Sayani Road, Prabhadevi, Mumbai 400 025
Phone: +91 22 3982 5500 E-mail: reports@motilaloswal.com