22 April 2013
Update |
Sector: Consumer
Britannia Industries
BSE SENSEX
S&P CNX
19,016
5,783
CMP: INR546
TP: INR605
Upgrade to Neutral
Volume growth bottoms out; Upgrade to Neutral
Premiumization strategy yielding benefits; non-Biscuits margins improving
Bloomberg
Equity Shares (m)
M.Cap. (INR b)/(USD b)
52-Week Range (INR)
1,6,12 Rel. Perf. (%)
BRIT IN
119.5
65.2/1.2
595/400
3/10/-13
Volume growth has bottomed out and should benefit from a favorable base ahead.
Benefits of premiumization are reflecting in the margins despite higher input costs.
See scope for re-rating as volume improves and margins expand 80bp over FY13E-15E.
Upgrade to Neutral with a target price of INR605, a potential upside of 11%.
Biscuits volume growth has likely bottomed out
We believe Britannia's (BRIT) volume growth in its core biscuits category has
bottomed out and will benefit from the favorable base effect, going forward.
Though the processed foods segment is undergoing a slowdown, BRIT's consistent
investments in the category should stand it in good stead, in our view. We expect
it to post 8% volume growth in biscuits in FY14E, driven by premium portfolio.
Financials & Valuation (INR b)
Y/E March
Sales
EBITDA
Adj. PAT
Adj. EPS (INR)
EPS Gr. (%)
BV/Sh.(INR)
RoE (%)
RoCE (%)
Payout (%)
Valuations
P/E (x)
P/BV (x)
EV/EBITDA (x)
Div. Yield (%)
30.3
10.1
21.5
1.5
24.5
8.6
16.3
2.0
20.6
7.3
13.3
2.4
2013E 2014E 2015E
55.4
2.8
2.1
17.2
9.8
51.3
33.5
54.3
45.6
64.7
3.6
2.5
21.3
23.8
60.2
35.3
53.9
50.0
75.5
4.4
3.0
25.2
18.5
70.8
35.6
50.8
50.0
Premiumization strategy yields dividend; Glucose salience declines
BRIT has focused to drive the premiumization strategy, given the business' low
margin nature and inflationary trend in its RM basket. Company consistently
innovated its portfolio and expanded the offerings in Health, Cookies and Creams
segment, where the realization is 2-4x base variants. Thus, it managed to expand
the gross margin by 150bp in 9MFY13, despite sharp input cost inflation. We
expect BRIT to continue to expand its premium portfolio, in line with the broader
category trend where contribution of Glucose is declining. We note the Glucose
category has declined 4.5%, while Creams and Cookies segment has grown 21.8%
and 5.5% respectively over CY10-12, as per industry data.
Non-biscuits portfolio gains strength; Subsidiaries turning profitable
BRIT's non-biscuits portfolio (Bread, Cake, Rusk, Dairy and International) is gaining
size and is now an INR15b business on an annualized basis. Pertinently,
profitability of international subsidiary and dairy subsidiary has been improving
consistently since FY09. As these businesses gain size, operating leverage can
provide margin upside, in our view.
Shareholding pattern (%)
As on
Mar-13 Dec-12 Mar-12
Promoter
50.9
50.9
51.0
Dom. Inst 11.3
13.0
16.2
Foreign
17.9
15.7
13.6
Others
19.9
20.3
19.2
Underperformance discounts negatives; Worst is over; Upgrade to
Neutral
BRIT has underperformed the BSE FMCG index by 32%/20% in last 12/24 months
due to deceleration in Biscuits volume and subdued profit growth. Going forward,
we expect a volume recovery; with higher input costs in the base, margins should
expand given the premiumization led by mix improvement. We estimate 21%
earnings CAGR for FY13E-15E led by 16.5% sales growth and 80bp operating margin
expansion to 5.8%. Given our expected improvement in operational performance,
we believe valuations at 24.5x FY14E and 20.6x FY15E have a scope for re-rating,
albeit modest. We value BRIT at 24x FY15E, peg the target price at INR605, an
upside of 11%, and upgrade to
Neutral.
Spike in input costs and any adverse
changes in premiumization trend are the key risks.
1
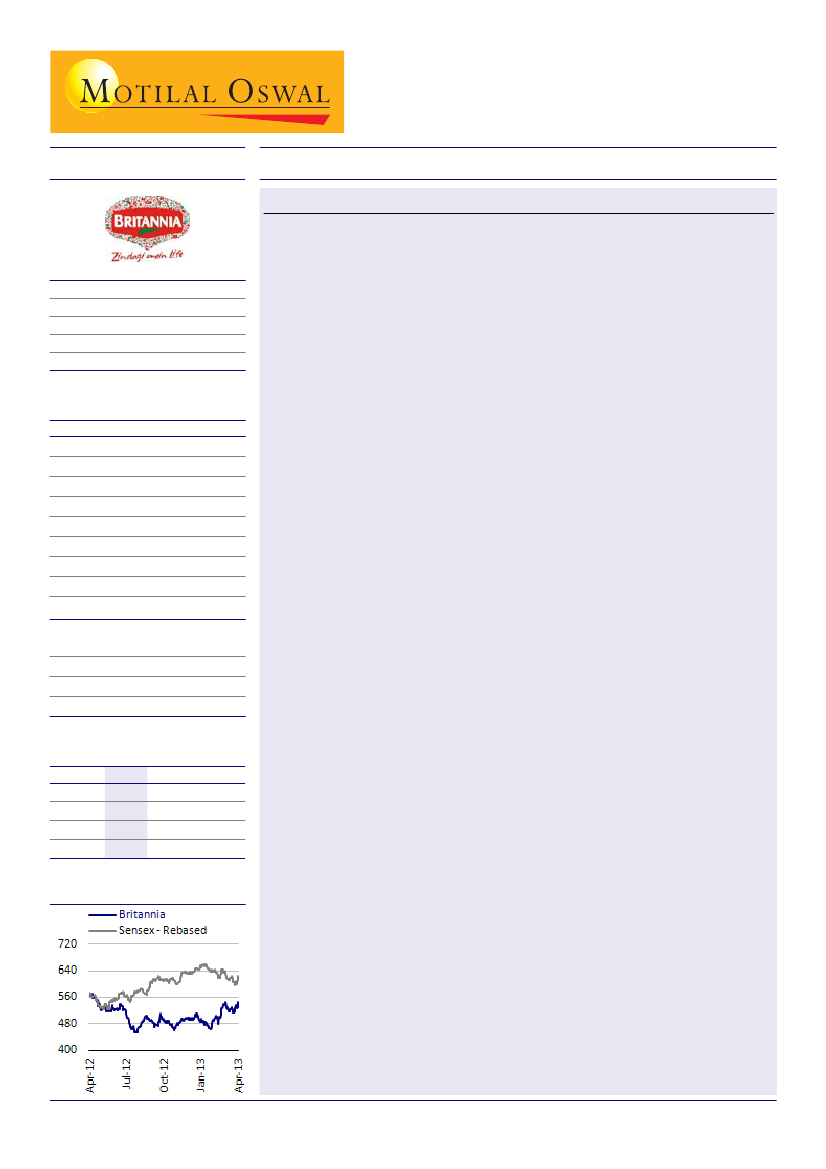
Stock performance (1 year)
22 April 2013

Britannia Industries
Biscuits volume growth bottoms out
...disproportionate investments to drive premium portfolio mix
Biscuits volume growth has decelerated for last six-seven quarters.
Expect favorable base to aid volume growth ahead despite processed foods slowdown.
Britannia's consistent investments to drive premiumization in portfolio.
After decelerating for six to seven successive quarters, Biscuits volume growth
recovered in 3QFY13 at ~5.5%. We expect this recovery to sustain partially aided by a
favorable base effect. Notwithstanding the overall slowdown in processed foods
segment, we believe BRIT's consistent and disproportionate focus to drive innovation
and premiumization will cushion the volume.
Volume growth to benefit from favorable base...
...and aggressive investments to drive premiumization
Source: Company, MOSL
Given that less than 9% of the Foods category is branded, management believes
there is significant room for growth. Biscuits, despite being one of the largest
processed foods category at USD2.2b and well penetrated, offer good opportunity as
per capita consumption at 2kg in India is half of a Sri Lanka.
Biscuits is the largest category in processed foods…
…has posted 8% volume CAGR over CY10-12
Source: Industry, MOSL
22 April 2013
2

Britannia Industries
Realization rose due to RM inflation
Key category growth indicators
Source: Industry, MOSL
22 April 2013
3

Britannia Industries
Premiumization strategy yields dividend
...industry data validates the underlying trend
Britannia has focussed on driving premiumization given the RM inflation trends.
Industry data confirms the underlying premiumization trend in the category.
Glucose category salience for the industry has been declining consistently.
BRIT has focused on the premiumization strategy given the low margin nature of
business and inflationary trend in its RM basket. It consistently innovated the portfolio
and expanded offerings in the Health, Cookies and Creams segment, where the
realization is 2-4x base variants. We believe the Biscuits industry data for CY10-12
vindicates the underlying premiumization trend in the category. Following section
explains the story in charts:
While the Biscuits industry posted 8% volume CAGR…
…Glucose category declined 4.5% in volumes
Contribution of Glucose category declines
BRIT has lost share in Glucose category…
Source: Industry, MOSL
22 April 2013
4

Britannia Industries
…so has ITC
…while Parle has gained
Even in CY12 Glucose underperformed other categories in volume and value terms
Source: Industry, MOSL
22 April 2013
5

Britannia Industries
BRIT's premium portfolio has done well
…aiding gross profitability
Premium portfolio has outperformed for Britannia
Innovation sales index has gone up 2.5x since FY11.
Britannia has expanded its health based offerings in the last 18 months.
BRIT's premium portfolio (Marie
Gold, 50-50, Nutrichoice, Treat
etc) has outperformed
the category growth and provided support to profitability. We note the innovation
sales index has risen ~2.5x since FY11.
BRIT's premium portfolio has done well...
…Innovation sales index up ~2.5x
Source: Company, MOSL
BRIT's premiumization efforts: moving up the value chain
Good-Day Regular
Good-Day Chocochip
Good-Day Fresh Bake
50-50 Regular
50-50 Maska Chaska
50-50 Snackuits
Nutrichoice Digestive
22 April 2013
Nutrichoice Oats
Nutrichoice Multigrain Thins
6

Britannia Industries
Company kept the innovation engine running and consistently unveiled new variants.
According to management, BRIT enjoys 4x relative market share of its next competitor
in health-focused biscuits (Nutrichoice) and is neck to neck with ITC in the premium
cream segment. BRIT has clearly targeted the health and wellness plank with several
launches in the space across categories -
Nutrichoice Biscuits, Multigrain Breads, Slimz
Milk
and
Cheese Slices
(extra calcium).
BRIT's recent innovations in Biscuits and other categories; Leveraging the health platform
Premiumization strategy yields results; Gross margin up 150bp in 9MFY13
Company's premiumization strategy has started bearing fruits and is reflected in
margins. Gross margin for 9MFY13 improved 150bp YoY to 36.7% after having already
expanded 150bp in FY12 v/s FY11. For the quarter-ended December 2012, 18% sales
growth was driven by a combination of 5.5% pricing, 6% volume and ~6% mix gains.
Expect operating margin expansion of 80bps over FY13-15e
...lead by improved gross margins due to lower RM inflation
Source: Company, MOSL
22 April 2013
7

Britannia Industries
Margin expansion despite sharp input cost inflation
Gross margin expanded despite the sharp inflation in key raw materials - average
wheat and sugar costs were up 21.7% and 13.8% respectively in FY13. The adverse
impact of higher input costs was mitigated by a combination of price hikes, grammage
change and mix improvement, in our view. Wheat and sugar price inflation resulted
in incremental INR1.8b impact during 9MFY13. Rising diesel prices will lead to
incremental cost of INR15m per month. However, prices of vegetable oil and skimmed
milk powder have corrected. In our view, being a category with low operating margin
and high competitive intensity, the only option to maintain profitability in the long
term is through mix improvement in favor of niche offerings, which allows certain
pricing power to the brand manufacturer. As mentioned earlier, the industry is moving
towards premium segments in both urban and rural markets. Despite the gross margin
expansion, operating margin declined 50bp YoY in 9MFY13 due to higher advertising
spends to support new launches. Conversion costs rose 70bp. BRIT has undertaken
several cost rationalization initiatives in the back-end to drive margin savings. It is
setting up a new plant in Gujarat at Jhagadia to reduce the freight cost and is also
undertaking process improvement in production through various measures - TQM,
TPM, Kaizen etc.
Wheat prices adversely impacted in FY13; down 12% from peak...
...Sugar prices down 15% from peak
Source: Bloomberg, MOSL
SMP prices have remained flat
Palm oil is down 30% YoY but up 10% from the low
Source: Bloomberg, MOSL
22 April 2013
8

Britannia Industries
Non-Biscuits portfolio gains in size and accretive to
bottom line...
…International subsidiaries profitability improves
Non-Biscuits is now tracking annual INR15b revenue.
Profiability is consistently improving for all international subsidiaries.
Expect operating leverage to play out.
BRIT's non-Biscuits portfolio — Dairy, Cake, Rusk, Bakery is gaining in size led by
portfolio expansion and differentiated offerings. Non-Biscuits coupled with
International business is now an INR15b business on an annualized basis.
Profitability in these businesses is on an improving trend and we expect the operating
leverage to materialize, going forward.
Robust sales growth in FY12 for non-Biscuits portfolio
PAT margin improves consistently
PAT margin improves across subsidiaries…
…even in International business (Al-Sallan + Strategic Foods Int)
*We have considered four key subsidiaries - Dairy Products, Daily Bread, Strategic Foods, Al-Sallan.
Source: Company, MOSL
22 April 2013
9

Britannia Industries
Underperformance discounts negatives
Worst is over; Upgrade to Neutral
BRIT has underperformed the FMCG index by 32% in 12 months - second worst performing
stock in our FMCG universe.
Expect valuations to undergo modest re-rating as operational performance improves in
FY14E and FY15E.
Ugrading to Neutral with INR605 target price, 11% upside.
BRIT has underperformed the BSE FMCG index by 32%/20% in last 12/24 months due to
deceleration in Biscuits volume and subdued profit growth. On a 12-month basis, it
has been the second worst performing stock in our FMCG universe relative to the BSE
FMCG index. Going forward, we expect a volume recovery; with higher input costs in
the base, margins should expand given the premiumization led by mix improvement.
We estimate 21% earnings CAGR for FY13E-15E led by 16.5% sales growth and 80bp
operating margin expansion to 5.8%. Given our expected improvement in operational
performance, we believe valuations at 24.5x FY14E and 20.6x FY15E have a scope for
re-rating, albeit modest. We value BRIT at 24x FY15E, peg the target price at INR605, an
upside of 11%, and upgrade to
Neutral.
Spike in input costs and any adverse changes
in premiumization trend are the key risks.
Underperformed BSE FMCG index by 40% in a year…
…and Sensex by 13% over 1 year (outperformed over 2 years)
P/E chart
P/B chart
Source: Bloomberg, MOSL
22 April 2013
10

Britannia Industries
BRIT is the worst performing stock in our FMCG universe in 12-month period
Company
Asian Paints
Britannia Inds.
Colgate-Palm.
Nestle India
GlaxoSmith C H L
Hind. Unilever
ITC
Dabur India
Marico
Godrej Consumer
BSE FMCG
Absolute Performance (%)
3M
6M
1 Yr
2 Yr
7.9
18.5
40.4
80.4
12.2
11.3
-4.1
44.8
-7.4
11.3
22.1
56.9
-2.9
-1.4
-6.0
24.9
2.9
29.6
37.7
71.7
-1.4
-16.1
14.2
72.3
9.8
8.2
30.4
66.0
9.8
7.3
27.5
37.2
-4.8
3.5
18.4
55.9
7.6
13.9
51.4
102.7
5.9
4.2
28.3
64.9
Relative Performance to BSE FMCG(%)
3M
6M
1 Yr
2 Yr
1.9
14.3
12.1
15.5
6.3
7.1
-32.4
-20.1
-13.3
7.1
-6.2
-8.0
-8.8
-5.6
-34.3
-40.1
-3.0
25.4
9.4
6.8
-7.4
-20.3
-14.1
7.4
3.9
4.0
2.2
1.1
3.9
3.1
-0.7
-27.7
-10.8
-0.7
-9.9
-9.0
1.7
9.7
23.2
37.8
22 April 2013
11

Britannia Industries
Financials and Valuation
Income Statement
Y/E March
Net Revenues
Change (%)
Raw Material Cost
Gross Profit
Margin (%)
Advertising
% of Sales
Other Expenditure
EBITDA
Change (%)
Margin (%)
Depreciation
Int. and Fin. Charges
Financial Other Income
Operating Other Income
PBT
Change (%)
Margin (%)
Tax
Deferred Tax
Tax Rate (%)
PAT
Change (%)
Margin (%)
Reported PAT
2011
41,983
23.4
27,643
14,340
34.2
3,042
7.2
9,236
2,063
35.4
4.9
446
378
489
252
1,981
15.4
4.7
528
0
26.6
1,453
-13.2
3.5
1,453
2012
49,470
17.8
31,798
17,673
35.7
3,810
7.7
11,343
2,521
33.2
5.1
473
381
585
272
2,524
27.4
5.1
656
0
26.0
1,867
28.5
3.8
1,867
2013E
55,396
12.0
35,017
20,379
36.8
4,819
8.7
12,769
2,790
10.7
5.0
547
366
587
350
2,814
11.5
5.1
790
-26
27.1
2,051
9.8
3.7
2,051
2014E
64,691
16.8
40,598
24,093
37.2
5,628
8.7
14,823
3,642
30.5
5.6
636
113
580
174
3,646
29.6
5.6
1,146
-38
30.4
2,538
23.8
3.9
2,538
(INR Million)
2015E
75,451
16.6
47,066
28,385
37.6
6,564
8.7
17,422
4,399
20.8
5.8
723
142
600
189
4,323
18.6
5.7
1,357
-43
30.4
3,009
18.5
4.0
3,008
Balance Sheet
Y/E March
Share Capital
Reserves
Networth
Loans
Capital Employed
Gross Block
Less: Accum. Depn.
Net Fixed Assets
Capital WIP
Investments
Deferred Liability
Currents Assets
Inventory
Account Receivables
Cash and Bank Balance
Others
Curr. Liab. & Prov.
Account Payables
Other Liabilities
Provisions
Net Current Assets
Net Assets
E: MOSL Estimates
22 April 2013
2011
239
4,274
4,513
4,607
9,120
5,936
-2,899
3,037
117
5,450
-62
6,254
3,112
573
287
2,282
5,676
3,329
1,073
1,274
578
9,120
2012
239
5,108
5,347
4,326
9,674
6,386
-3,379
3,007
1,000
5,264
10
7,387
3,741
690
614
2,343
6,995
4,560
1,073
1,362
393
9,674
2013E
239
5,892
6,131
811
6,942
7,636
-3,926
3,710
250
1,960
37
8,469
4,155
794
1,062
2,459
7,484
5,026
1,175
1,283
985
6,942
2014E
239
6,955
7,194
851
8,045
8,886
-4,562
4,324
250
2,309
75
9,978
5,175
958
1,219
2,626
8,890
5,840
1,288
1,761
1,088
8,045
(INR Million)
2015E
239
8,215
8,454
1,509
9,963
10,136
-5,285
4,851
250
3,721
118
11,500
6,036
1,116
1,557
2,791
10,477
6,978
1,412
2,087
1,023
9,963
12

Britannia Industries
Financials and Valuation
Ratios
Y/E March
Basic (INR)
EPS
BV/Share
DPS
Payout (%)
Valuation (x)
P/E
EV/Sales
EV/EBITDA
P/BV
Dividend Yield
Return Ratios (%)
RoE
RoCE
Working Capital Ratios
Debtor (Days)
Asset Turnover (x)
Leverage Ratio
Debt/Equity (x)
2011
12.2
37.8
6.5
53.4
2012
15.6
44.8
8.5
54.4
2013E
17.2
51.3
7.8
45.6
2014E
21.3
60.2
10.6
50.0
2015E
25.2
70.8
12.6
50.0
33.3
1.2
24.0
11.6
1.6
30.3
1.1
21.5
10.1
1.5
24.5
0.9
16.3
8.6
2.0
20.6
0.8
13.3
7.3
2.4
32.2
31.2
34.9
36.1
33.5
54.3
35.3
53.9
35.6
50.8
5
4.6
5
5.1
5
8.0
5
8.0
5
7.6
1.0
0.8
0.1
0.1
0.2
Cash Flow Statement
Y/E March
OP Profit
Financial Other Income
Interest Paid
Direct Taxes Paid
Inc in WC
CF from Operations
Extraordinary Items
(Inc)/Dec in FA
(Pur.)/Sale of Investments
Other Non Rec Exp
CF from Investments
Inc in Debt
Dividend Paid
Other Item
CF from Fin. Activity
Inc/Dec of Cash
Add: Beginning Balance
Closing Balance
E: MOSL Estimates
2011
2,063
489
378
528
121
1,526
2012
2,521
585
381
656
-512
2,581
2013E
2,790
587
366
790
144
2,077
2014E
3,642
580
113
1,146
-53
3,016
(INR Million)
2015E
4,399
600
142
1,357
-403
3,903
475
544
0
1,018
279
696
36
-454
54
234
288
1,333
-186
0
1,147
-281
902
-76
-1,107
327
287
614
500
-3,304
0
-2,804
-3,515
1,157
-233
-4,439
442
614
1,056
1,250
348
0
1,598
40
1,086
215
-1,261
157
1,062
1,219
1,250
1,413
1
2,664
658
1,475
84
-901
338
1,219
1,557
22 April 2013
13

Disclosures
This report is for personal information of the authorized recipient and does not construe to be any investment, legal or taxation advice to you. This research report does not constitute an offer, invitation or inducement
to invest in securities or other investments and Motilal Oswal Securities Limited (hereinafter referred as MOSt) is not soliciting any action based upon it. This report is not for public distribution and has been
furnished to you solely for your information and should not be reproduced or redistributed to any other person in any form.
Unauthorized disclosure, use, dissemination or copying (either whole or partial) of this information, is prohibited. The person accessing this information specifically agrees to exempt MOSt or any of its affiliates
or employees from, any and all responsibility/liability arising from such misuse and agrees not to hold MOSt or any of its affiliates or employees responsible for any such misuse and further agrees to hold MOSt
or any of its affiliates or employees free and harmless from all losses, costs, damages, expenses that may be suffered by the person accessing this information due to any errors and delays.
The information contained herein is based on publicly available data or other sources believed to be reliable. While we would endeavour to update the information herein on reasonable basis, MOSt and/or its
affiliates are under no obligation to update the information. Also there may be regulatory, compliance, or other reasons that may prevent MOSt and/or its affiliates from doing so. MOSt or any of its affiliates or
employees shall not be in any way responsible and liable for any loss or damage that may arise to any person from any inadvertent error in the information contained in this report . MOSt or any of its affiliates
or employees do not provide, at any time, any express or implied warranty of any kind, regarding any matter pertaining to this report, including without limitation the implied warranties of merchantability, fitness
for a particular purpose, and non-infringement. The recipients of this report should rely on their own investigations.
This report is intended for distribution to institutional investors. Recipients who are not institutional investors should seek advice of their independent financial advisor prior to taking any investment decision
based on this report or for any necessary explanation of its contents.
MOSt and/or its affiliates and/or employees may have interests/positions, financial or otherwise in the securities mentioned in this report. To enhance transparency, MOSt has incorporated a Disclosure of Interest
Statement in this document. This should, however, not be treated as endorsement of the views expressed in the report.
Disclosure of Interest Statement
1. Analyst ownership of the stock
2. Group/Directors ownership of the stock
3. Broking relationship with company covered
4. Investment Banking relationship with company covered
Britannia Industries
No
No
No
No
Analyst Certification
The views expressed in this research report accurately reflect the personal views of the analyst(s) about the subject securities or issues, and no part of the compensation of the research analyst(s) was, is, or
will be directly or indirectly related to the specific recommendations and views expressed by research analyst(s) in this report. The research analysts, strategists, or research associates principally responsible
for preparation of MOSt research receive compensation based upon various factors, including quality of research, investor client feedback, stock picking, competitive factors and firm revenues.
Regional Disclosures (outside India)
This report is not directed or intended for distribution to or use by any person or entity resident in a state, country or any jurisdiction, where such distribution, publication, availability or use would be contrary to
law, regulation or which would subject MOSt & its group companies to registration or licensing requirements within such jurisdictions.
For U.K.
This report is intended for distribution only to persons having professional experience in matters relating to investments as described in Article 19 of the Financial Services and Markets Act 2000 (Financial
Promotion) Order 2005 (referred to as "investment professionals"). This document must not be acted on or relied on by persons who are not investment professionals. Any investment or investment activity to
which this document relates is only available to investment professionals and will be engaged in only with such persons.
For U.S.
Motilal Oswal Securities Limited (MOSL) is not a registered broker - dealer under the U.S. Securities Exchange Act of 1934, as amended (the"1934 act") and under applicable state laws in the United States.
In addition MOSL is not a registered investment adviser under the U.S. Investment Advisers Act of 1940, as amended (the "Advisers Act" and together with the 1934 Act, the "Acts), and under applicable state
laws in the United States. Accordingly, in the absence of specific exemption under the Acts, any brokerage and investment services provided by MOSL, including the products and services described herein
are not available to or intended for U.S. persons.
This report is intended for distribution only to "Major Institutional Investors" as defined by Rule 15a-6(b)(4) of the Exchange Act and interpretations thereof by SEC (henceforth referred to as "major institutional
investors"). This document must not be acted on or relied on by persons who are not major institutional investors. Any investment or investment activity to which this document relates is only available to major
institutional investors and will be engaged in only with major institutional investors. In reliance on the exemption from registration provided by Rule 15a-6 of the U.S. Securities Exchange Act of 1934, as amended
(the "Exchange Act") and interpretations thereof by the U.S. Securities and Exchange Commission ("SEC") in order to conduct business with Institutional Investors based in the U.S., MOSL has entered into
a chaperoning agreement with a U.S. registered broker-dealer, Motilal Oswal Securities International Private Limited. ("MOSIPL"). Any business interaction pursuant to this report will have to be executed within
the provisions of this chaperoning agreement.
The Research Analysts contributing to the report may not be registered /qualified as research analyst with FINRA. Such research analyst may not be associated persons of the U.S. registered broker-dealer,
MOSIPL, and therefore, may not be subject to NASD rule 2711 and NYSE Rule 472 restrictions on communication with a subject company, public appearances and trading securities held by a research analyst
account.
For Singapore
Motilal Oswal Capital Markets Singapore Pte Limited is acting as an exempt financial advisor under section 23(1)(f) of the Financial Advisers Act(FAA) read with regulation 17(1)(d) of the Financial Advisors
Regulations and is a subsidiary of Motilal Oswal Securities Limited in India. This research is distributed in Singapore by Motilal Oswal Capital Markets Singapore Pte Limited and it is only directed in Singapore
to accredited investors, as defined in the Financial Advisers Regulations and the Securities and Futures Act (Chapter 289), as amended from time to time.
In respect of any matter arising from or in connection with the research you could contact the following representatives of Motilal Oswal Capital Markets Singapore Pte Limited:
Nihar Oza
Kadambari Balachandran
Email: niharoza.sg@motilaloswal.com
Email : kadambari.balachandran@motilaloswal.com
Contact: (+65) 68189232
Contact: (+65) 68189233 / 65249115
Office address: 21 (Suite 31), 16 Collyer Quay, Singapore 049318
Motilal Oswal Securities Ltd
Motilal Oswal Tower, Level 9, Sayani Road, Prabhadevi, Mumbai 400 025
Phone: +91 22 3982 5500 E-mail: reports@motilaloswal.com