23 April 2013
4QFY13 Results Update | Sector:
Technology
Persistent Systems
BSE Sensex
19,170
Bloomberg
Equity Shares (m)
M.Cap. (INR b)/(USD b)
52-Week Range (INR)
1,6,12 Rel.Perf.(%)
S&P CNX
5,834
PSYS IN
40.0
21.8/0.4
590/326
3/14/52
CMP: INR545
TP: INR554
Neutral
Financials & Valuation (INR b)
Y/E March
Sales
EBITDA
Adj. PAT
Adj. EPS (INR)
EPS Gr. (%)
BV/Sh.(INR)
RoE (%)
RoCE (%)
Payout (%)
Valuations
P/E (x)
P/BV (x)
EV/EBITDA (x)
Div. Yield (%)
2013 2014E 2015E
12.9
3.4
1.9
46.9
32.4
262.1
20.2
15.2
19.2
11.6
2.1
5.2
1.7
15.0
3.6
2.2
54.2
15.5
310.9
19.5
16.7
22.2
10.1
1.8
4.5
2.2
17.0
3.9
2.5
61.6
13.7
365.0
18.8
16.4
22.7
8.8
1.5
3.7
2.6
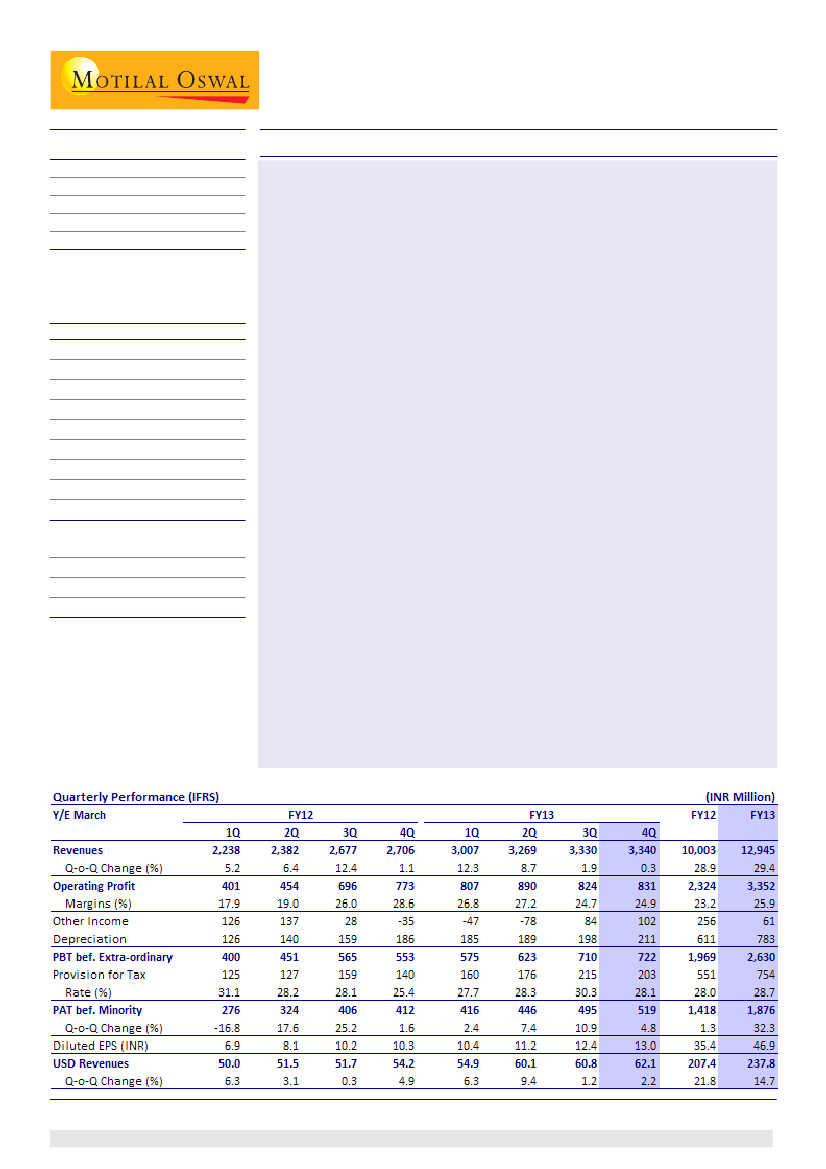
Persistent Systems' (PSYS) 4QFY13 revenue at USD62.1m grew 2.2% QoQ,
below our estimate of USD63.3m (4.1% QoQ growth). EBITDA margin for the
quarter was 24.9%, +20bp QoQ, and marginally above our estimate of 24.5%,
on account of lower SGA and some reversal in bad debt provisioning. PAT
was INR519m, +4.8% QoQ, higher than our estimate of INR477m, driven by a
forex gain of INR41.5m, v/s our estimate of a loss of INR36.5m.
Linear revenue at USD51.2m was in line with our estimate, while the
disappointment was driven by IP-led revenue, which declined 1.7% QoQ to
USD10.9m, v/s our estimate of USD12m (growth of 8.7% QoQ).
Performance in IP-led revenue was even more disappointing considering
the fact that 4Q is a seasonally strong one for the connectors PSYS writes for
its top client, and that inclusion of NovaQuest added ~10% revenue on 3QFY13
base (~USD1.1m of USD1.8m from NovaQuest was IP-led).
While deal sizes have reduced, number of opportunities in the market place
has considerably increased. Commentary on pricing remains positive, with
expectation of continued gradual improvement from a change in business
mix and better rates in new deals.
On the back of lackluster IP-led revenue performance in 4Q and expectation
of revenue uptick from HPCA licensing agreement only in 2HFY14, we have
lowered FY14E revenue estimate by 1.6%. We expect USD revenue growth of
16.7%/15.5% in FY14E/FY15E. Our profitability expectations are largely similar
post results. A lower revenue estimate drives 5.1%/4.1% downward revision
in our EPS estimates for FY14E/FY15E.
PSYS' operations in the fast growing segments like Cloud, Mobility, Big Data
and Analytics keep us sanguine on its growth prospects. However, the
performance in IP-led revenue remains volatile, and on an organic basis,
growth remained tepid in both Linear and IP-driven revenue. Given the weak
growth in organic revenue and continued volatility in IP segment, we value
PSYS at 9x FY15E EPS, implying a target price of INR554. Maintain
Neutral.
Ashish Chopra
(Ashish.Chopra@MotilalOswal.com); +91 22 3982 5424
Investors are advised to refer through disclosures made at the end of the Research Report.
1

Persistent Systems
4QFY13: Revenue below estimate, while lower SGA drives marginal beat
to margins; PAT above estimate on forex gains
PSYS' 4QFY13 revenue was USD62.1m, +2.2% QoQ, below our estimate of USD63.3m
(growth of 4.1% QoQ). However, Linear revenue at USD51.2m was in line with our
estimate, while the disappointment was driven by IP-led revenue, which declined
1.7% QoQ to USD10.9m, v/s our estimate of USD12m (growth of 8.7% QoQ).
Performance in IP-led revenue was even more disappointing considering the fact
that 4Q is a seasonally strong one for the connectors PSYS writes for its top client,
and that inclusion of NovaQuest added ~10% revenue on 3QFY13 base (~USD1.1m
of USD1.8m from NovaQuest was IP-led).
USD revenue in 4QFY13 was below estimate on weakness in IP-led segment
Source: Company, MOSL
Revenue at onsite grew 12.7% QoQ, driven by volume growth of 2.7% QoQ and
pricing improvement of 9.7% QoQ (led by inclusion of NovaQuest). Offshore
revenue grew 0.5% QoQ, with pricing improvement of +2.8% QoQ and volume
decline of 2.1% QoQ.
Telecom vertical declined 10.7% QoQ, while Infrastructure segment grew 7%,
followed by Life Sciences and Healthcare at 4% QoQ.
Revenue in Telecom segment declines for the second consecutive quarter, as was the case with
Europe
Contribution to Rev. (%)
Verticals
Telecom & Wireless
Infrastructure and Systems
Life Sciences and Healthcare
Geographies
North America
Europe
India, APAC
22.8
66.5
10.7
85.1
5.7
9.2
Growth - QoQ (%)
(10.7)
7.2
4.2
2.1
(4.5)
6.9
Contr to incr. rev (%)
(124.6)
205.0
19.6
84.4
(12.7)
28.3
Source: Company, MOSL
EBITDA margin for the quarter was 24.9%, +20bp QoQ (marginally above our
estimate of 24.5%). Margin was driven by below estimate SGA, at 18.1%, +90bp
QoQ (v/s estimate of 18.5%, +130bp QoQ) and INR12.15m reversal in bad debt
provisioning. Gross margin was 42.6%, -90bp QoQ, v/s estimate of 43%, -50bp
QoQ.
2
23 April 2013

Persistent Systems
EBITDA margin was above estimate on lower SGA and reversal in bad debt provisions
Source: Company, MOSL
PAT was INR519m, +4.8% QoQ, higher than our estimate of INR477m (-3.6% QoQ).
Above estimate PAT was driven by a forex gain of INR41.5m, v/s our estimate of a
loss of INR36.5m.
Takeaways from management commentary: Strong deal pipeline; Positive
outlook on realization rates
Deal pipeline in Product Engineering strong:
As the cost of developing a product
continues to decrease, deal sizes in the market are much smaller than those in the
past. However, lower cost of development is encouraging more players to develop
products, which is throwing up a larger number of such deals on the table.
Positive commentary on realization rates:
While inclusion of NovaQuest revenue
facilitated the improvement in realization rates during the quarter, company also
cited the improvement in realization on the back of changing business mix and better
rates in new deals.
IP-led share to increase:
Decline in IP-led revenue during the quarter reflected the
volatile nature of the segment. PSYS' licensing pact with HP and a strong pipeline of IP
products that are under consideration should drive the proportion of revenue from
IP-led segment to 25% in the next two years.
Second consecutive quarter of decline in IP revenue after two quarters of acquisition-driven
growth
Source: Company, MOSL
23 April 2013
3

Persistent Systems
Other result highlights
Revenue mix shifted in favor of onsite by 180bp QoQ to 18.8%.
Attrition rate fell to 14.4% in 4QFY13 from 16% in 3QFY13.
Receivables improved to 65 days during the quarter, from 67 in the previous
quarter.
PSYS closed the quarter with 279 (v/s 264 in 3Q) active clients in the Product
Engineering and Platform business and 418 clients (v/s 394 in 3Q) in the IP-driven
business.
Number of USD3m+ clients increased to 15 from 14 in the previous quarter.
Cash and cash equivalents at the quarter-end were INR3.7b.
Repeat business accounted for 78.2% of revenue, v/s 81.4% in the previous quarter.
Change in estimates: Revising downwards FY14 estimates on anticipation
of back-ended revenue from HPCA licensing agreement
On the back of a lackluster IP-led revenue performance in 4Q and expectation of
revenue uptick from HPCA licensing agreement only in 2HFY14, we lower FY14E
revenue estimate by 1.6%. We now expect USD revenue growth of 16.7%/15.5% in
FY14E/FY15E.
Our profitability expectations are largely similar post results. Company expects
wage hikes in FY14 to be in the range of 8-9%. We expect EBITDA margin of 23.7%
in FY14E and 22.8% in FY15E (25.9% in FY13, 24.9% in 4QFY13).
Lower revenue estimate drives 5.1%/4.1% downward revision in our EPS estimates
for FY14E/FY15E. We now model an EPS growth of 15.5% in FY14E and 13.5% in
FY15E.
Change in Estimates
Revised
FY14E
FY15E
54.0
53.0
277.5
320.4
16.7
15.5
23.7
22.8
54.2
61.6
15.5
13.7
Earlier
FY14E
FY15E
54.0
53.0
282.2
325.1
18.1
15.2
24.1
23.0
57.1
64.2
24.5
12.5
Change (%)
FY14E
FY15E
0.0
0.0
-1.6
-1.4
-140bp
20bp
-40bp
-20bp
-5.1
-4.1
-900bp
120bp
Source: MOSL
INR/USD
USD Revenue (m)
USD revenue growth (%)
EBITDA Margin (%)
EPS (INR)
EPS Growth (%)
Valuation and view
We expect PSYS to post USD revenue at a CAGR of 16% over FY13-15E and EPS at a
CAGR of 14.6% during this period. The stock trades 10.1x FY14E and 8.8x FY15E EPS.
PSYS' operations in the fast growing segments like Cloud, Mobility, Big Data and
Analytics keeps us sanguine on its growth prospects. Also, our concern on margins
is partly alleviated by the increasing share of higher margin IP-led segment in the
overall business.
However, the performance of IP-led revenue remains volatile, and on an organic
basis, growth has remained tepid in both Linear and IP-driven revenue. Given
weak growth in organic revenue and continued volatility in IP segment, we value
PSYS at 9x FY15E EPS, implying a target price of INR554. Maintain
Neutral.
23 April 2013
4

Persistent Systems
Persistent Systems: an investment profile
Company description
Persistent Systems (PSYS) is a global company
specializing in software product and technology
innovation, partnering with pioneering start-ups,
innovative enterprises and the world's largest
technology brands. Company staffs over 6,900
employees and clocked revenue of USD238m (LTM). It
has a clear focus on new initiatives witnessing greater
demand and driving the next wave of technology growth
- Cloud, Mobility, Data Analytics and Collaboration.
Sensitivity of margins to currency fluctuations is
higher.
Recent developments
Announced licensing agreement with Hewlett
Packard for HP Client Automation (HPCA) software.
Launched Persistent Ventures, a division of
Persistent Systems Ltd, to focus on innovations and
new technologies and invest in early stage ventures
by building intellectual property related to platform
solutions.
Key investment arguments
PSYS is an early entrant and has marquee clientele
in cutting-edge technologies around cloud,
mobility, collaboration and analytics, witnessing
faster growth.
Company's foray into IP-driven businesses by
acquiring assets has helped improve its margin
profile (17.5% of revenue in 4QFY13).
Valuation and view
We expect PSYS to clock USD revenue at a CAGR of
16% over FY13-15E and EPS CAGR of 14.6% during
this period.
The stock trades at 10.1x FY14E and 8.8x FY15E EPS.
Maintain Neutral with a target price of INR554, which
discounts our FY15E EPS by 9x.
Sector view
Early commentary on CY13 IT budgets indicates that
growth in FY14 is likely to be better than that in FY13.
However, concerns are emanating on pricing in the
commoditized Business IT Services space amid
increasing competition and minimal differentiation.
We believe companies with a greater focus on
services in higher end of value chain will benefit
going forward, once discretionary spending
improves.
Key investment risks
Margin sustainability is a risk due to: [1] high
proportion of offshoring (63.7% of 4QFY13 revenue
ex-IP was from offshore) - implying offshore wage
hikes hurt margins more than peers (440bp impact
on 10% hike) and [2] high attrition levels, resulting
in frequent wage hikes.
Increasing thrust on expanding IP-led revenue share
introduces greater volatility and higher risk in the
business model.
Comparative valuations
P/E (x)
P/BV(x)
EV/Sales (x)
EV/EBITDA (x)
FY14E
FY15E
FY14E
FY15E
FY14E
FY15E
FY14E
FY15E
Persistent
10.1
8.8
1.8
1.5
1.1
0.8
4.5
3.7
Mindtree Hexaware
9.7
10.1
8.7
11.4
2.2
2.1
1.8
1.8
1.1
1.0
0.9
0.8
5.6
5.2
4.6
5.5
EPS: MOSL forecast v/s consensus (INR)
MOSL
Forecast
54.2
61.6
Consensus
Forecast
54.4
60.6
Variation
(%)
-0.4
1.7
FY14
FY15
Target price and recommendation
Current
Price (INR)
545
Target
Price (INR)
554
Upside
(%)
1.7
Reco.
Neutral
Stock performance (1 year)
Shareholding pattern (%)
Mar-13
Promoter
Domestic Inst
Foreign
Others
23 April 2013
39.0
16.7
18.1
26.2
Dec-12
39.0
17.3
17.4
26.3
Mar-12
39.0
11.9
22.0
27.1
5

Persistent Systems
Financials and Valuations
23 April 2013
6

Persistent Systems
N O T E S
23 April 2013
7

Disclosures
This report is for personal information of the authorized recipient and does not construe to be any investment, legal or taxation advice to you. This research report does not constitute an offer, invitation or inducement
to invest in securities or other investments and Motilal Oswal Securities Limited (hereinafter referred as MOSt) is not soliciting any action based upon it. This report is not for public distribution and has been
furnished to you solely for your information and should not be reproduced or redistributed to any other person in any form.
Unauthorized disclosure, use, dissemination or copying (either whole or partial) of this information, is prohibited. The person accessing this information specifically agrees to exempt MOSt or any of its affiliates
or employees from, any and all responsibility/liability arising from such misuse and agrees not to hold MOSt or any of its affiliates or employees responsible for any such misuse and further agrees to hold MOSt
or any of its affiliates or employees free and harmless from all losses, costs, damages, expenses that may be suffered by the person accessing this information due to any errors and delays.
The information contained herein is based on publicly available data or other sources believed to be reliable. While we would endeavour to update the information herein on reasonable basis, MOSt and/or its
affiliates are under no obligation to update the information. Also there may be regulatory, compliance, or other reasons that may prevent MOSt and/or its affiliates from doing so. MOSt or any of its affiliates or
employees shall not be in any way responsible and liable for any loss or damage that may arise to any person from any inadvertent error in the information contained in this report . MOSt or any of its affiliates
or employees do not provide, at any time, any express or implied warranty of any kind, regarding any matter pertaining to this report, including without limitation the implied warranties of merchantability, fitness
for a particular purpose, and non-infringement. The recipients of this report should rely on their own investigations.
This report is intended for distribution to institutional investors. Recipients who are not institutional investors should seek advice of their independent financial advisor prior to taking any investment decision
based on this report or for any necessary explanation of its contents.
MOSt and/or its affiliates and/or employees may have interests/positions, financial or otherwise in the securities mentioned in this report. To enhance transparency, MOSt has incorporated a Disclosure of Interest
Statement in this document. This should, however, not be treated as endorsement of the views expressed in the report.
Disclosure of Interest Statement
1. Analyst ownership of the stock
2. Group/Directors ownership of the stock
3. Broking relationship with company covered
4. Investment Banking relationship with company covered
Persistent Systems
No
No
No
No
Analyst Certification
The views expressed in this research report accurately reflect the personal views of the analyst(s) about the subject securities or issues, and no part of the compensation of the research analyst(s) was, is, or
will be directly or indirectly related to the specific recommendations and views expressed by research analyst(s) in this report. The research analysts, strategists, or research associates principally responsible
for preparation of MOSt research receive compensation based upon various factors, including quality of research, investor client feedback, stock picking, competitive factors and firm revenues.
Regional Disclosures (outside India)
This report is not directed or intended for distribution to or use by any person or entity resident in a state, country or any jurisdiction, where such distribution, publication, availability or use would be contrary to
law, regulation or which would subject MOSt & its group companies to registration or licensing requirements within such jurisdictions.
For U.K.
This report is intended for distribution only to persons having professional experience in matters relating to investments as described in Article 19 of the Financial Services and Markets Act 2000 (Financial
Promotion) Order 2005 (referred to as "investment professionals"). This document must not be acted on or relied on by persons who are not investment professionals. Any investment or investment activity to
which this document relates is only available to investment professionals and will be engaged in only with such persons.
For U.S.
Motilal Oswal Securities Limited (MOSL) is not a registered broker - dealer under the U.S. Securities Exchange Act of 1934, as amended (the"1934 act") and under applicable state laws in the United States.
In addition MOSL is not a registered investment adviser under the U.S. Investment Advisers Act of 1940, as amended (the "Advisers Act" and together with the 1934 Act, the "Acts), and under applicable state
laws in the United States. Accordingly, in the absence of specific exemption under the Acts, any brokerage and investment services provided by MOSL, including the products and services described herein
are not available to or intended for U.S. persons.
This report is intended for distribution only to "Major Institutional Investors" as defined by Rule 15a-6(b)(4) of the Exchange Act and interpretations thereof by SEC (henceforth referred to as "major institutional
investors"). This document must not be acted on or relied on by persons who are not major institutional investors. Any investment or investment activity to which this document relates is only available to major
institutional investors and will be engaged in only with major institutional investors. In reliance on the exemption from registration provided by Rule 15a-6 of the U.S. Securities Exchange Act of 1934, as amended
(the "Exchange Act") and interpretations thereof by the U.S. Securities and Exchange Commission ("SEC") in order to conduct business with Institutional Investors based in the U.S., MOSL has entered into
a chaperoning agreement with a U.S. registered broker-dealer, Motilal Oswal Securities International Private Limited. ("MOSIPL"). Any business interaction pursuant to this report will have to be executed within
the provisions of this chaperoning agreement.
The Research Analysts contributing to the report may not be registered /qualified as research analyst with FINRA. Such research analyst may not be associated persons of the U.S. registered broker-dealer,
MOSIPL, and therefore, may not be subject to NASD rule 2711 and NYSE Rule 472 restrictions on communication with a subject company, public appearances and trading securities held by a research analyst
account.
For Singapore
Motilal Oswal Capital Markets Singapore Pte Limited is acting as an exempt financial advisor under section 23(1)(f) of the Financial Advisers Act(FAA) read with regulation 17(1)(d) of the Financial Advisors
Regulations and is a subsidiary of Motilal Oswal Securities Limited in India. This research is distributed in Singapore by Motilal Oswal Capital Markets Singapore Pte Limited and it is only directed in Singapore
to accredited investors, as defined in the Financial Advisers Regulations and the Securities and Futures Act (Chapter 289), as amended from time to time.
In respect of any matter arising from or in connection with the research you could contact the following representatives of Motilal Oswal Capital Markets Singapore Pte Limited:
Nihar Oza
Kadambari Balachandran
Email: niharoza.sg@motilaloswal.com
Email : kadambari.balachandran@motilaloswal.com
Contact: (+65) 68189232
Contact: (+65) 68189233 / 65249115
Office address: 21 (Suite 31), 16 Collyer Quay, Singapore 049318
Motilal Oswal Securities Ltd
Motilal Oswal Tower, Level 9, Sayani Road, Prabhadevi, Mumbai 400 025
Phone: +91 22 3982 5500 E-mail: reports@motilaloswal.com