13 May 2013
4QFY13 Results Update | Sector: Financials
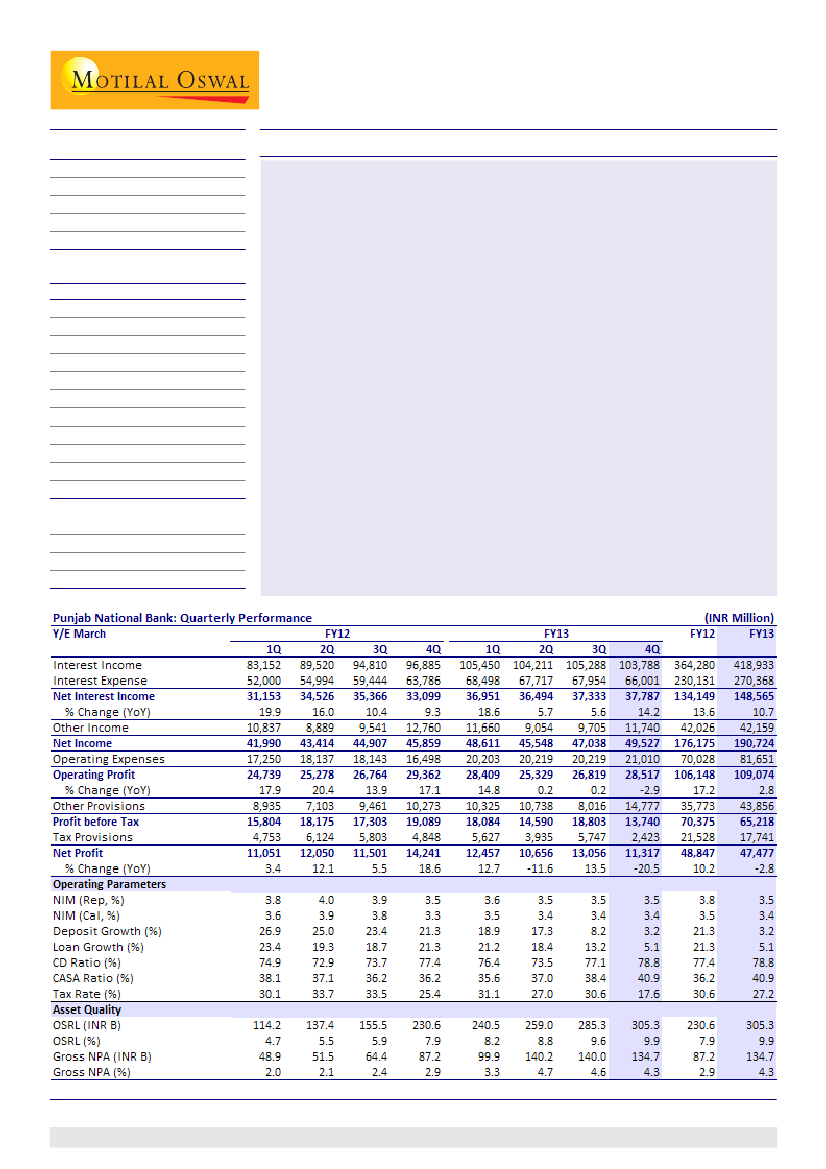
Punjab National Bank
BSE Sensex
20,083
Bloomberg
Equity Shares (m)
M.Cap. (INR b)/(USD b)
52-Week Range (INR)
1,6,12 Rel.Perf.(%)
S&P CNX
6,095
PNB IN
339.2
265.7/4.9
922/659
0/-7/-20
CMP: INR771
TP: INR1,130
Buy
Financials & Valuation (INR b)
Y/E March
2013 2014E 2015E
NII
149
166
196
OP
109
117
140
NP
47
52
62
NIM (%)
3.4
3.5
3.6
EPS (INR)
134
148
176
EPS Gr. (%)
-6.7
10.0
19.2
BV/Sh. (INR)
884
997 1,133
ABV/Sh. (INR) 751
850
984
ROE (%)
16.5
15.7
16.5
ROA (%)
1.0
1.0
1.1
Div. Payout (%) 23.3
23.2
23.2
Valuations
P/E(X)
5.7
5.2
4.4
P/BV (X)
0.9
0.8
0.7
P/ABV (X)
1.0
0.9
0.8
Div. Yield (%)
3.5
3.8
4.6
PNB's 4QFY13 PAT declined 21% YoY to INR11.3b, 19% below est (INR13.4b), led
by higher-than-expected provisions of INR11b on stressed assets. Lower tax rate
of 17.6% v/s est of 30.7% helped PAT. NIM was stable QoQ at 3.5%.
Key highlights:
While net slippages in 1HFY13 were significantly higher at INR53.5b (4%
annualized), balance sheet consolidation, aggressive recovery drive and
higher follow-up with borrowers are leading to sharp reversal in reported
NPL movement. In 3QFY13, net slippages were almost nil, while in 4QFY13
they were just INR3.7b (annualized 50bp).
Additions to standard restructured loans stood at INR64b (2.1% of loans), of
which ~INR20b belonged to SEBs. Outstanding standard restructured loan
(OSRL) portfolio stood at INR305.3b (9.9% of loans).
Bank continues to de-bulk and consolidate its balance sheet, resulting in
with (a) fall in bulk deposits to 12.5% v/s 24% a year ago and (b) increase in
CASA deposits (reported) to 40.9% v/s 38.4% QoQ and 36.2% a year ago.
Valuation and view:
PNB remains highly levered to macro-economic scenario
and any improvement in the same can provide significant upside in earnings (led
by asset quality). Lower balance sheet and fee income growth and higher credit
cost led to 7/15% downgrade in PPP/PAT estimates. Top management continuity
till October 2014, improvement in liability profile, strategically placed treasury
book for decline in interest rates, relatively better pension related assumption
than peers, healthy RoA of 1%+ are some of the comforting factors.
Buy.
Alpesh Mehta
(Alpesh.Mehta@MotilalOswal.com) + 91 22 3982 5415
Sohail Halai
(Sohail.Halai@MotilalOswal.com)+ 9122 3982 5430
Investors are advised to refer through disclosures made at the end of the Research Report.
1