30 May 2013
4QFY13 Results Update | Sector: Oil & Gas
ONGC
BSE Sensex
20,148
Bloomberg
Equity Shares (m)
M.Cap. (INR b)/(USD b)
52-Week Range (INR)
1,6,12 Rel. Perf. (%)
S&P CNX
6,104
ONGC IN
8,555.5
2,858/51.5
354/244
-2/27/8
CMP: INR334
TP: INR442
Buy
Financials & Valuation (INR b)
Y/E March
Sales
EBITDA
Adj. PAT
Adj. EPS (INR)
EPS Gr. (%)
BV/Sh.(INR)
RoE (%)
RoCE (%)
Payout (%)
Valuation
P/E (x)
P/BV (x)
EV/EBITDA (x)
Div. Yield (%)
11.8
1.9
4.8
2.8
9.5
1.7
3.9
3.3
6.6
1.4
2.7
4.8
2013 2014E 2015E
1,614 1,814 2,075
540
240
28.3
(8.8)
177
16.8
15.6
39.2
654
304
35.3
26.7
199
18.8
17.9
36.4
861
436
50.6
43.5
231
23.5
22.3
37.0
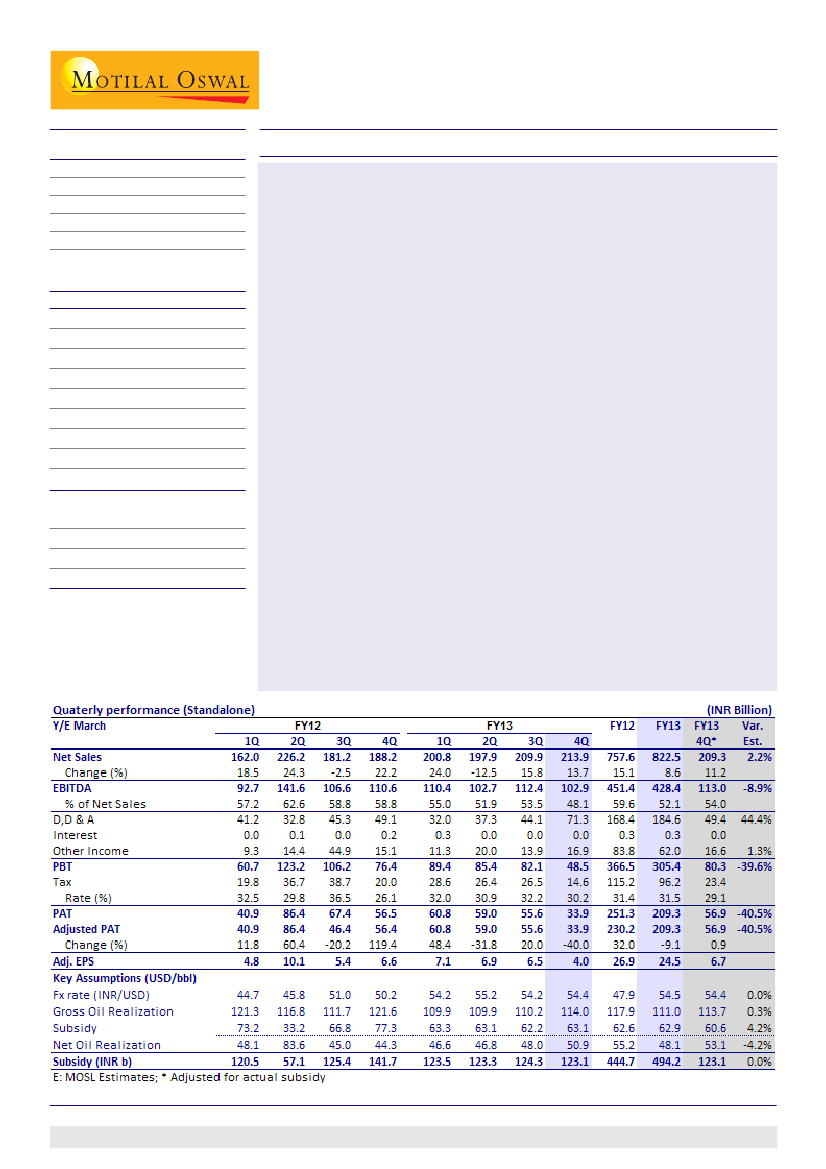
Exploration write-offs, employee cost provision impacts profitability:
ONGC's
reported 4QFY13 EBITDA at INR103b (v/s est of INR113b, adj. for actual subsidy)
was impacted by INR20b superannuation benefits provision, the impact of
which was partly negated by higher VAP revenue. PAT was impacted by
significantly higher D,D&A at INR71.3b v/s our estimate of INR49.4b, led by
dry well write-offs.
4QFY13 net realization at USD50.9/bbl:
Gross realization for 4QFY13 declined
6% YoY (but grew 3% QoQ) to USD114/bbl. Post subsidy of USD63.1/bbl (v/s
our revised estimate of USD60.6/bbl, USD62.2/bbl in 3QFY13 and USD77.3/
bbl in 4QFY12), net realization was USD50.9/bbl. Absolute subsidy sharing
for the quarter was INR123.1b (down 13% YoY and 1% QoQ).
Quarterly production lower:
Oil production (including JV) for 4Q declined 2%
YoY and QoQ to 6.47mmt while gas production declined 5% YoY and 2% QoQ
to 6.22bcm due to shutdown at PMT fields.
Upstream sharing at 38% in FY13; model 40% for FY14/FY15:
ONGC's 4QFY13
subsidy was INR123b and its share in upstream contribution was 82.8%. We
model upstream sharing at 40% for FY14/FY15.
Key things to watch:
(1) Gas price hike, (2) Implementation of diesel reforms,
(3) Clarity on Sudan and Syria production for OVL, (4) Subsidy sharing, and (5)
Visibility on production growth.
Maintain Buy:
We currently model Brent oil price of USD105/bbl (v/s USD110/
bbl earlier) in FY14/FY15 and USD95/bbl in long term. Timely execution of
diesel reforms and gas price hike could lead to stock re-rating. Implied
dividend yield for FY13 stands at ~3%. The stock trades at 8.6x FY14E EPS of
INR35.3. Our SOTP-based target price for ONGC is INR442.
Buy.
Harshad Borawake
(HarshadBorawake@MotilalOswal.com); +91 22 3982 5432
Kunal Gupta
(Kunal.Gupta@MotilalOswal.com); +91 22 3982 5445
Investors are advised to refer through disclosures made at the end of the Research Report.

ONGC
ONGC: Quarterly performance snapshot (INR b)
4Q
FY12
124.2
40.9
23.1
188.2
1.9
3.3
43.6
28.8
77.6
110.6
0.2
49.1
15.1
76.4
20.0
56.5
26.1
3Q
FY13
142.54
42.0
25.4
209.9
1.6
3.5
57.1
35.4
97.5
112.4
0.0
44.1
13.9
82.1
26.5
55.6
32.2
4Q
FY13
147.8
41.4
24.7
213.9
1.9
7.4
54.9
46.8
111.0
102.9
0.0
71.3
16.9
48.5
14.6
33.9
30.2
YoY
Chg (%)
18.9
1.4
6.8
13.7
-0.2
119.9
25.7
62.9
42.9
-6.9
-99.8
45.2
11.4
-36.5
-26.6
-40.0
15.5
QoQ
Chg (%)
3.7
-1.2
-2.8
1.9
20.1
112.7
-3.9
32.4
13.8
-8.4
-95.9
61.5
21.6
-40.9
-44.7
-39.1
-6.4
Comments
Oil Sales is higher YoY due to lower sharing of subsidy
during 4QFY13 (INR123b v/s INR142b in 4QFY12)
Higher VAP realisations on YoY basis
Oil
Gas
VAP and others
Net sales
RM & purchases
Staff Cost
Staturoy levies
Other Expenditure
Total Expenditure
EBITDA
Interest
D, D & A
Other Income
Profit before tax
Total tax
Adj. Net Profit
Effective tax rate (%)
Driven by higher Cess n FY13 at INR4,500/MT v/s
INR2,500/MT in FY12
One-off provisioning in INR20b towards super
annuation benefits during 4QFY13
Higher due to higher dry well write offs during 4QFY13
"Tax rate was higher in 3QFY12 led by difference
between“taxable & accounting profit as company get higher
deduction on R&D expenses"
Source: Company, MOSL
4QFY13 subsidy payout of INR123b; net realization at USD51/bbl
ONGC's subsidy payout stood at INR123b (v/s INR142b in 4QFY12 and INR124b in
3QFY13). Its share stood at 82.8% of overall upstream share for 4QFY13.
Gross realization in 4QFY13 was at USD114/bbl, while the subsidy payout was at
USD63.1/bbl resulting in net realization of USD50.9/bbl, up 14.7% YoY and 6% QoQ.
We understand that ONGC/OINL's FY13 subsidy is computed by multiplying per
barrel subsidy of USD56/bbl with oil production volume (for ONGC, even
condensate volume is accounted to calculate subsidy).
To be conservative, we are compelled to increase the upstream sharing in future
years, but as there is no scientific method to predict future sharing, we maintain
the upstream sharing at 40% even for FY14/FY15.
ONGC: 4QFY13 Net realization at USD50.9/bbl (USD/bbl)
Source: Company, MOSL
30 May 2013
2

ONGC
4QFY13 subsidy at INR123b; upstream sharing at ~38% for FY13 (INRb)
Source: Company, MOSL
We model upstream sharing at 40% in FY14/FY15 (INR b)
FY09
Fx Rate (INR/USD)
46.0
Brent (USD/bbl)
85
Product Sales (mmt)
83
Gross Under recoveries (INR b)
Petrol
52
Diesel
523
Kerosene
282
LPG
176
Total
1,033
Gross Under recoveries Sharing (INR b)
Government
713
Upstream
329
OMC’s
(9)
Total
1,033
Gross Under recoveries Sharing (%)
Government
69
Upstream
32
OMC’s
(1)
Total
100
FY10
47.5
70
91
52
93
174
143
461
260
145
56
461
56
31
12
100
FY11
45.6
86
96
27
348
200
205
780
410
303
67
780
53
39
9
100
FY12
47.9
114
100
0
819
278
284
1,385
829
552
0
1,385
60
40
0
100
FY13
54.5
111
104
0
915
296
399
1,610
1,000
601
0
1,601
FY14E
54.5
105
104
0
381
275
367
1,022
613
409
0
1,022
FY15E
54.0
105
110
0
37
260
416
713
428
285
0
713
60
40
0
100
MOSL
62
60
38
40
0
0
100
100
Source: Company,
D,D&A significantly higher due to dry wells write off; trend is normally on
the higher side in second half of the year
ONGC's D,D&A expenses in 4QFY13 stood at INR71b (v/s est. of INR49b); up 45%
YoY and 62% QoQ. Increase is largely driven by write-off of INR47b in 4QFy13 and
believe is driven by dry well expenses (await details).
Historically it has been observed that the D,D&A charges are normally higher
during second half of the year as ONGC typically charges the well write-offs at the
end of the year when it reviews its exploration performance.
30 May 2013
3

ONGC
D,D&A expenses was higher at INR71b
D,D&A charge has been typically higher in 2H as against 1H in recent years (INRb)
*Survey expenses assumed
Source: Company, MOSL
4QFY13 operational and other key highlights
Oil production (excl. JV) stood at 5.62mmt (-3% YoY, -1% QoQ); sales (excl. JV)
were at 4.79mmt (-1% YoY, -2% QoQ).
Gas production (excl. JV) stood at 5.83bcm (-3% YoY, -1%QoQ); sales (excl. JV)
were at 4.62bcm (-3% YoY, flat QoQ).
JV oil production was 0.85mmt (+6% YoY, -5% QoQ), while JV gas production was
0.39bcm (-27% YoY, -13% QoQ) hit by lower gas production at PMT fields due to
shutdown. YoY JV oil production growth is driven by Rajasthan production ramp-
up, while QoQ drop is due to PMT shutdown.
ONGC declared 22 discoveries in FY13, which includes 12 new prospects (4offshore
and 8 onland) and 10 new pools (5 offshore and 5 onland).
Ultimate domestic reserve accretion of 84.8mmtoe is highest in the last 22 years,
implying reserve replacement ratio of 1.8.
30 May 2013
4

ONGC
Oil standalone (excl. JV) production
down 2% YoY (mmt)
Gas (incl. JV) production down
5% YoY and 2% QoQ (bcm)
Rajasthan oil lowers YoY
de-growth to 3% (mmtoe).
Oil sales down 1% YoY (mmt)
Gas sales volumes were down YoY due
to shutdown at PMT (bcm)
Overall sales declined YoY and
QoQ (mmtoe)
Source: Company, MOSL
ONGC Videsh Financial Performance
ONGC Videsh's (OVL) FY13 key financial numbers were ahead of expectations.
OVL's FY13 reported PAT is up 44% to INR39.3b v/s INR27.2b in FY12. While, on a
adjusted basis, PAT is down 7% as its FY12 reported PAT was impacted by one-time
impairment charge of INR19.5b for Imperial Energy.
OVL will add INR4.6/sh to ONGC's consolidated FY13 EPS as against INR3.2/sh in FY12.
On the production front, volumes were down 17% YoY, with oil production at
4.3mmt (-30% YoY) and gas production at 2.9mmt (+15% YoY) impacted by adverse
geo-political situation in Syria and South Sudan.
Long term plans: OVL has maintained its long term production target of 20mmt by
FY18 and 60mmt by FY30.
OVL: Reported PAT up 44%, while on adjusted basis down 7%
INR b
Net Sales
EBITDA
PBT
PAT
Adj. PAT
YoY Chg (%)
Reported EPS
FY09
181.4
93.7
53.4
27.9
29.6
-24%
3.3
FY10
151.8
78.8
40.0
20.9
22.4
24%
2.4
FY11
185.0
95.1
48.3
25.8
27.7
53%
3.0
FY12
226.0
121.0
51.2
27.2
42.2
-15%
3.2
FY13 Est
179.6
106.0
64.4
35.9
35.9
-7%
4.2
FY13 Act. YoY Chg (%)
180.3
-20
39.3
39.3
44
-7
4.6
44
Source: Company, MOSL
5
30 May 2013

ONGC
OVL: Production down 17% YoY led by Syria and Sudan impact
FY09
Oil (mmt)
Gas (bcm)
Total (mmtoe)
YoY Chg (%)
6.6
2.2
8.7
FY10
6.5
2.4
8.9
2%
FY11
6.8
2.7
9.4
7%
FY12
6.2
2.5
8.8
-7%
FY13 Est
4.4
2.5
6.9
-21%
FY13 Act. YoY Chg (%)
4.3
-30
2.9
15
7.3
-17
-17%
Source: Company, MOSL
ONGC Videsh production headwinds: Production has been impacted by Syria, Sudan and Imperial
(mmtoe)
Valuation and view
We have factored in a gas price of USD 6.8/mmbtu from FY15 onwards for ONGC.
Also, in-line with the announced reforms, we have assumed a diesel price hike of
INR 0.45/lt/month, and thus estimate a ~55% reduction in under recoveries in
FY15 for FY13 base. Similar to last 3 years, we have assumed 40% sharing for
upstream in FY14/FY15.
Key things to watch are (1) gas price hike; (2) implementation of diesel reforms;
(3) clarity on Sudan and Syria production for OVL, (4) subsidy sharing and (5) visibility
on production growth.
We currently model Brent oil price of USD105/bbl (v/s USD110/bbl earlier) in FY14/
FY15 and USD95/bbl in long term. ONGC currently trades at ~40% discount to its
global peers on EV/BOE (1P basis) and timely execution of diesel reforms and gas
price hike could lead to stock's re-rating. Implied dividend yield of FY13 dividend
stands at ~3%. The stock trades at 8.6x FY14 EPS of INR35.3. Our SOTP-based target
price for ONGC stands at INR442/sh. We will be fine tuning of estimates post the
analyst meet.
Buy.
Valuation summary
USDB
ONGC Domestic
OVL
Cairn India
Net (Debt) / Cash
Listed Investments
44
18
2
5
3
INRB INR/sh Valuation method
2,307
940
112
277
144
270
110
13
32
17
DCF Based, WACC of 12%
2P reserves @ USD6/boe (same as ONGC)
DCF based
Cons. net debt
MRPL, IOC, GAIL & Petronet LNG; 25% discount
to our target/market price
Target Price
71 3,781
442
*We do not factor in the contribution from the recent OVL acquisitions
30 May 2013
6

ONGC
ONGC: Key assumptions (INR m)
Year End: March 31
FY09
FY10
47.5
1.9
69.7
26.5
25.6
52.1
8.9
60.9
115.6
71.7
15.7
56.0
19.6
2.4
0.6
22.7
FY11
45.7
3.9
86.5
27.3
25.3
52.6
9.4
62.1
248.9
89.4
35.6
53.8
20.4
3.0
1.1
24.5
FY12
47.9
4.2
114.5
26.9
25.5
52.4
8.8
61.2
444.7
117.4
62.7
54.7
26.8
3.2
0.4
30.4
FY13
54.5
4.2
110.6
26.2
25.4
51.6
6.9
58.5
494.1
110.7
62.9
47.8
FY14E
54.5
4.2
105.0
27.1
26.5
53.5
7.4
61.0
335.3
105.5
41.9
63.6
FY15E
54.0
6.8
105.0
28.3
28.0
56.3
9.0
65.3
233.8
105.5
27.8
77.7
40.7
5.9
3.9
50.6
MOSL
Exchange Rate (INR/US$)
45.8
APM Gas Price (USD/mmbtu)
2.0
Brent crude price (USD/bbl)
84.8
Production Details (mmtoe)
Domestic Oil Production (mmt)
27.1
Domestic Gas Production (bcm) 25.4
Domestic Production (mmtoe)
52.6
OVL Production (mmtoe)
8.8
Group Production (mmtoe)
61.3
Subsidy Sharing (INRb)
282.3
Oil Price Realization (USD/bbl)
Gross
88.0
Upstream Discount
39.1
Net
49.0
Cons EPS Break-up (INR/sh)
EPS (Standalone)
18.9
EPS (OVL)
3.3
EPS (MRPL, Cairn & Others)
0.9
EPS (Consolidated)
23.1
21.8
26.2
4.2
4.4
2.3
4.6
28.3
35.3
Source: Company,
30 May 2013
7

ONGC
ONGC: an investment profile
Company description
ONGC, a Fortune 500 company, is an eminent exploration
and production (E&P) company in India. With over 300
discoveries, it has established in-place reserves of 6.9b
ton of oil equivalent (btoe), with ultimate reserves of
2.4btoe. It currently accounts for ~68% of India's domestic
oil and gas production. Through its 100% subsidiary
ONGC Videsh Limited (OVL), it has equity investments
in E&P blocks in 16 countries. Downstream presence is
marked through its subsidiary (71.6% stake), MRPL.
increased efforts towards E&P, we expect the company
to report more oil and gas finds, going forward.
Increased capex, IOR/EOR projects to provide
production growth:
Impressive RRR>1 for last 6 years.
Production likely to be flat in short-term, however
we expect volume growth in long term led by IOR/
EOR, marginal fields and monetization of the
discovered fields. Increased capex in the large
unexplored NELP acreage could result in significant
reserve accretion in future.
Key investment arguments
Diesel reforms to lead to significant cut in under
recoveries:
Recently announced diesel reforms (a)
increasing diesel prices by INR 0.40-0.50/lt every
month and (b) Market pricing for bulk buyers; would
lead to a significant cut in under recoveries (50%
reduction in under recoveries in FY15 over FY13).
Gas price hike would be a key trigger:
Rangarajan
committee in its report has proposed a implied gas
price of ~USD8/mmbtu for domestically produced gas.
Oil Ministry has already moved a note to the Cabinet
for accepting the recommendations of the
committee.
Large NELP acreage to provide long-term growth:
ONGC has more than 50 % of the total NELP
exploration acreage allotted. Of this, around 66%
acreage is in high potential deep water. As bulk of this
acreage is yet to be explored, we believe there is
huge potential for hydrocarbon discoveries. ONGC has
met with initial success in the KG block - the country's
and its first ultra -deep water discovery UD-1. With
Key investment risks
Ad-hocism in subsidy sharing. Delay in
implementation of announced diesel reforms.
Acquisition of overseas assets at high valuations
against stiff competition from China.
Slowdown in deep water development due to
technological barriers.
Recent developments
Government announced Diesel reforms to cut under
recoveries. If executed in a timely manner this could
lead to a significant reduction in under recoveries.
OVL completed announced acquisition of stake in
Azerbaijan fields.
The Oil Ministry has moved a cabinet note, whereby
it has proposed to fix gas price at USD6.8/mmbtu..
Valuation and view
The stock trades at 8.6x FY14 EPS of INR35.3.
Our SOTP-based target price for ONGC is INR442/sh.
Maintain
Buy.
Target price and recommendation
Current
Price (INR)
334
Target
Price (INR)
442
Upside
(%)
32.3
Reco.
Buy
EPS: MOSL forecast v/s consensus (INR)
MOSL
Forecast
35.3
50.6
Consensus
Forecast
34.6
39.7
Variation
(%)
1.9
27.5
FY14
FY15
Stock performance (1 year)
Shareholding pattern (%)
Mar-13
Promoter
Domestic Inst
Foreign
Others
30 May 2013
69.2
10.8
6.3
13.6
Dec-12
69.2
11.2
5.8
13.8
Mar-12
69.2
11.6
5.4
13.8
8

ONGC
Financials and valuation
30 May 2013
9

Disclosures
This report is for personal information of the authorized recipient and does not construe to be any investment, legal or taxation advice to you. This research report does not constitute an offer, invitation or inducement
to invest in securities or other investments and Motilal Oswal Securities Limited (hereinafter referred as MOSt) is not soliciting any action based upon it. This report is not for public distribution and has been
furnished to you solely for your information and should not be reproduced or redistributed to any other person in any form.
Unauthorized disclosure, use, dissemination or copying (either whole or partial) of this information, is prohibited. The person accessing this information specifically agrees to exempt MOSt or any of its affiliates
or employees from, any and all responsibility/liability arising from such misuse and agrees not to hold MOSt or any of its affiliates or employees responsible for any such misuse and further agrees to hold MOSt
or any of its affiliates or employees free and harmless from all losses, costs, damages, expenses that may be suffered by the person accessing this information due to any errors and delays.
The information contained herein is based on publicly available data or other sources believed to be reliable. While we would endeavour to update the information herein on reasonable basis, MOSt and/or its
affiliates are under no obligation to update the information. Also there may be regulatory, compliance, or other reasons that may prevent MOSt and/or its affiliates from doing so. MOSt or any of its affiliates or
employees shall not be in any way responsible and liable for any loss or damage that may arise to any person from any inadvertent error in the information contained in this report . MOSt or any of its affiliates
or employees do not provide, at any time, any express or implied warranty of any kind, regarding any matter pertaining to this report, including without limitation the implied warranties of merchantability, fitness
for a particular purpose, and non-infringement. The recipients of this report should rely on their own investigations.
This report is intended for distribution to institutional investors. Recipients who are not institutional investors should seek advice of their independent financial advisor prior to taking any investment decision
based on this report or for any necessary explanation of its contents.
MOSt and/or its affiliates and/or employees may have interests/positions, financial or otherwise in the securities mentioned in this report. To enhance transparency, MOSt has incorporated a Disclosure of Interest
Statement in this document. This should, however, not be treated as endorsement of the views expressed in the report.
Disclosure of Interest Statement
1. Analyst ownership of the stock
2. Group/Directors ownership of the stock
3. Broking relationship with company covered
4. Investment Banking relationship with company covered
ONGC
No
No
No
No
Analyst Certification
The views expressed in this research report accurately reflect the personal views of the analyst(s) about the subject securities or issues, and no part of the compensation of the research analyst(s) was, is, or
will be directly or indirectly related to the specific recommendations and views expressed by research analyst(s) in this report. The research analysts, strategists, or research associates principally responsible
for preparation of MOSt research receive compensation based upon various factors, including quality of research, investor client feedback, stock picking, competitive factors and firm revenues.
Regional Disclosures (outside India)
This report is not directed or intended for distribution to or use by any person or entity resident in a state, country or any jurisdiction, where such distribution, publication, availability or use would be contrary to
law, regulation or which would subject MOSt & its group companies to registration or licensing requirements within such jurisdictions.
For U.K.
This report is intended for distribution only to persons having professional experience in matters relating to investments as described in Article 19 of the Financial Services and Markets Act 2000 (Financial
Promotion) Order 2005 (referred to as "investment professionals"). This document must not be acted on or relied on by persons who are not investment professionals. Any investment or investment activity to
which this document relates is only available to investment professionals and will be engaged in only with such persons.
For U.S.
Motilal Oswal Securities Limited (MOSL) is not a registered broker - dealer under the U.S. Securities Exchange Act of 1934, as amended (the"1934 act") and under applicable state laws in the United States.
In addition MOSL is not a registered investment adviser under the U.S. Investment Advisers Act of 1940, as amended (the "Advisers Act" and together with the 1934 Act, the "Acts), and under applicable state
laws in the United States. Accordingly, in the absence of specific exemption under the Acts, any brokerage and investment services provided by MOSL, including the products and services described herein
are not available to or intended for U.S. persons.
This report is intended for distribution only to "Major Institutional Investors" as defined by Rule 15a-6(b)(4) of the Exchange Act and interpretations thereof by SEC (henceforth referred to as "major institutional
investors"). This document must not be acted on or relied on by persons who are not major institutional investors. Any investment or investment activity to which this document relates is only available to major
institutional investors and will be engaged in only with major institutional investors. In reliance on the exemption from registration provided by Rule 15a-6 of the U.S. Securities Exchange Act of 1934, as amended
(the "Exchange Act") and interpretations thereof by the U.S. Securities and Exchange Commission ("SEC") in order to conduct business with Institutional Investors based in the U.S., MOSL has entered into
a chaperoning agreement with a U.S. registered broker-dealer, Motilal Oswal Securities International Private Limited. ("MOSIPL"). Any business interaction pursuant to this report will have to be executed within
the provisions of this chaperoning agreement.
The Research Analysts contributing to the report may not be registered /qualified as research analyst with FINRA. Such research analyst may not be associated persons of the U.S. registered broker-dealer,
MOSIPL, and therefore, may not be subject to NASD rule 2711 and NYSE Rule 472 restrictions on communication with a subject company, public appearances and trading securities held by a research analyst
account.
For Singapore
Motilal Oswal Capital Markets Singapore Pte Limited is acting as an exempt financial advisor under section 23(1)(f) of the Financial Advisers Act(FAA) read with regulation 17(1)(d) of the Financial Advisors
Regulations and is a subsidiary of Motilal Oswal Securities Limited in India. This research is distributed in Singapore by Motilal Oswal Capital Markets Singapore Pte Limited and it is only directed in Singapore
to accredited investors, as defined in the Financial Advisers Regulations and the Securities and Futures Act (Chapter 289), as amended from time to time.
In respect of any matter arising from or in connection with the research you could contact the following representatives of Motilal Oswal Capital Markets Singapore Pte Limited:
Nihar Oza
Kadambari Balachandran
Email: niharoza.sg@motilaloswal.com
Email : kadambari.balachandran@motilaloswal.com
Contact: (+65) 68189232
Contact: (+65) 68189233 / 65249115
Office address: 21 (Suite 31), 16 Collyer Quay, Singapore 049318
Motilal Oswal Securities Ltd
Motilal Oswal Tower, Level 9, Sayani Road, Prabhadevi, Mumbai 400 025
Phone: +91 22 3982 5500 E-mail: reports@motilaloswal.com