Metals Weekly
3 June 2013
Metals Weekly
Valuations: Indian companies
Price
EV/EBITDA P/BV
(INR) FY14E FY15E FY14E
Steel
Tata Steel
SAIL
JSW Steel
JSPL
NMDC
Sesa Goa
Non-ferrous
Sterlite Inds.
HZL
Nalco
Hindalco
Rain Comm.
294
56
690
286
117
161
93
115
34
103
39
5.7
7.8
6.9
7.6
3.7
31.4
3.3
3.4
5.2
6.8
5.5
6.1
8.1
6.1
6.3
3.5
6.0
2.9
2.7
4.6
6.3
4.5
1.1
0.6
0.9
1.2
1.5
1.0
0.6
1.3
0.7
0.9
0.5
TMT- Mumbai (INR/ton)
HRC- Mumbai (INR/ton)
HRC (USD/ton) fob CIS
Metal Prices
CMP
3-Jun
34,100
32,445
518
%
1
-2
-4
Week
Quarter
27-May
% 1-Apr
33,700 -2 34,900
33,246 -11 36,565
540 -8
565
19,300 -5 19,800
25,200
4 24,200
125 -18
138
240 -11
265
345 -12
385
5,213
1,814
101
1,096
1,823
101
620
7,240
408
-1
0
4
-7
1
5
7
-5
1
5,228
1,881
102
1,171
1,870
102
571
7,582
408
%
-5
-9
-4
YTD CY13
1-Jan
35,900
35,676
538
21,150
24,200
141
330
378
5,210
2,040
112
1,221
2,034
111
321
7,915
441
30,631
57,172
2,340
0.98
Sponge iron - Raipur (INR/ton)
18,800 -3
Pig iron - Raipur (INR/ton)
25,200
0
Iron ore spot (USD/ton) cfr China
113 -10
Coke (USD/ton) fob
235 -2
Shred. scrap (USD/ton) Rotterdam
337 -2
LME inventories (‘000 ton)
LME Spot (USD/ton)
Indian prices (INR ‘000/ton)
LME inventories (‘000 ton)
LME Spot (USD/ton)
Indian prices (INR ‘000/ton)
LME inventories (‘000 ton)
LME Spot (USD/ton)
Indian prices (INR ‘000/ton)
5,202
1,875
106
1,087
1,882
106
608
7,241
410
0
3
5
-1
3
5
-2
0
1
2
0
7
0
-11
4
-20
-29
-11
0
-8
-5
-11
-7
-5
90
-9
-7
-12
-24
-6
3
Note: Detailed table on pg 23
Source: MOSL
Valuations: Global companies
Price
Mining
BHP
AUD 34.9
FMG
AUD 3.4
Rio Tinto AUD 55.2
Vale
USD 14.4
Teck Res. USD 26.7
Steel
A. Mittal
EUR 9.9
Posco
k KRW 322
US Steel USD 17.7
Nucor
USD 44.5
JFE
JPY 2145
Gerdau
BRL 13.1
Bao Steel CNY 4.8
Non-ferrous
Alcoa
USD 8.5
Norsk Hyd. NOK 26.7
Rusal
HKD 3.71
Detailed on pg 23
BSE Metals Index
Sensex
102
100
98
96
EV/EBITDA
CY13 CY14
7.0
6.2
5.6
4.8
5.9
6.3
5.5
7.0
9.8
7.1
7.8
7.3
6.2
4.5
5.1
4.8
5.1
5.1
4.9
4.7
6.6
6.6
6.4
6.3
P/BV
CY13
2.4
1.8
1.7
0.9
0.9
0.4
0.7
0.8
1.8
0.7
1.1
0.8
Gold (INR/10gms)
26,850
Sliver (INR/1kg)
43,550
Lead Spot LME (USD/ton)
2,193
FC 6-8% C basis 60% Cr (USD/lb Cr) 1.01
INR/USD
BDI
26,444 -9 29,526
43,638 -17 52,621
2,056
5 2,094
1.01 -2
1.03
56.4
2
55.6
4
54.5
3
54.7
809 -2
826 -11
910
16
699
Source: Metal Bulletin, Bloomberg, Steel Mint, MOSL
7.3
6.3
0.7
8.3
6.4
0.8
16.3 14.5
0.6
Source: Bloomberg
Iron ore down 10% WoW; Base metals improve 0-7% WoW
Steel prices continue to remain weak and declined by 4%, 2% and 0.5%
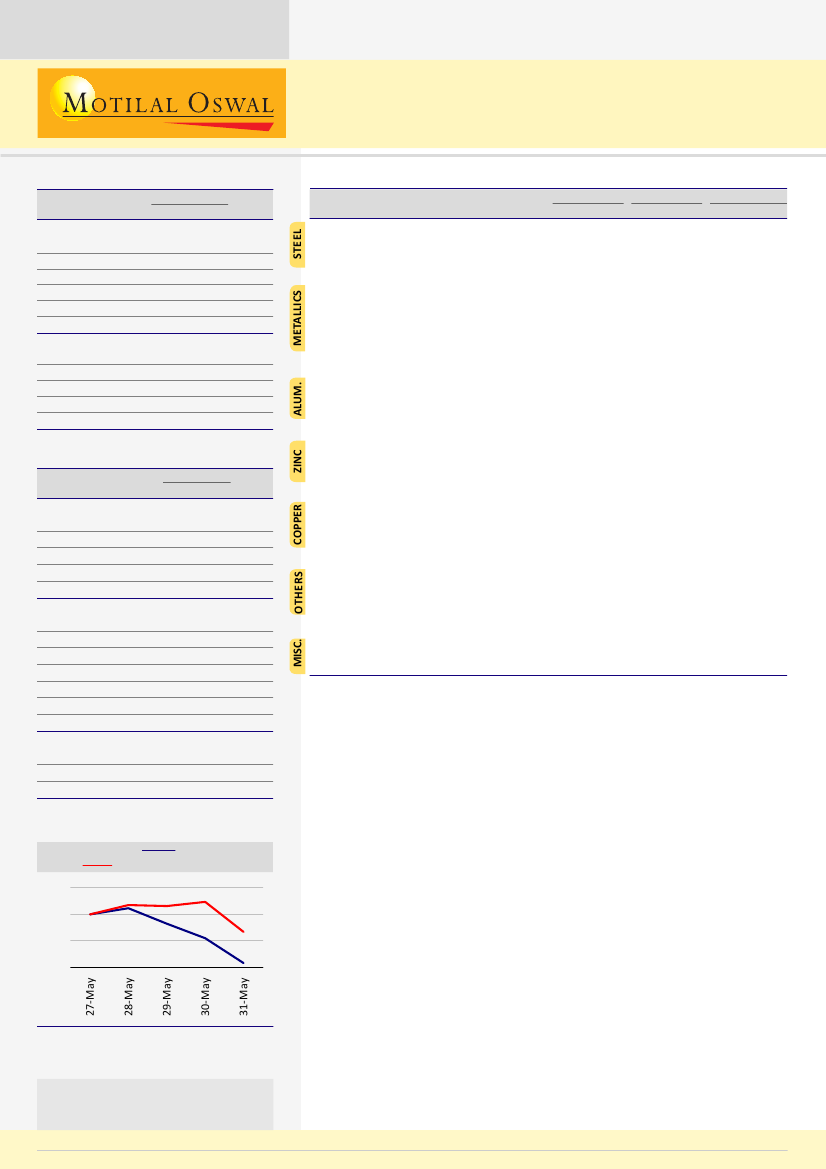
BSE Metals Index v/s Sensex
Source: Bloomberg
Note: Indexed to 100 on 27 May 2013
Stock performance table on pg 24
Investors are advised to refer through
disclosures made at the end of the
Research Report.
WoW in CIS, China and Turkey respectively. Prices were flat in Europe.
However North America was an exception as HRC prices bounced back
from three year low levels, increasing 3.6% WoW.
Indian long steel prices TMT (Mumbai) increased 1% WoW, while flat
product prices HRC (Import parity, Mumbai) declined 2% WoW. Sponge
iron prices has decreased 3% WoW, while Scrap prices improved 1.4%
WoW. Pellet prices declined INR400/t WoW to INR7,000/t.
Iron ore prices (63.5% Fe CFR China) decreased 10%WoW to USD113/t.
Coking coal prices (Premium Low vol, Fob Australia) declined USD3 WoW
to USD137/t.
Base metals price improved with aluminium, Lead and Zinc prices
increasing by 3% , 7% and 3% WoW respectively while Copper was flat
WoW.
Sterlite Tuticorin smelter is expected to resume operations after NGT
gave conditional approval.
NMDC has rolled over May prices for lumps and fines to June.
Sanjay Jain
(SanjayJain@MotilalOswal.com); Tel:+91 22 3982 5412
3 June 2013
Pavas Pethia
(Pavas.Pethia@MotilalOswal.com); Tel:+91 22 3982 5413
1

Metals Weekly
Contents
Page No.
Ferrous
..................................................................................
3-10
India ...................................................................................................... 3 & 4
European Union .......................................................................................... 5
China ............................................................................................................ 6
Other regions ........................................................................................ 7 & 8
Steel raw material ............................................................................... 9 & 10
Ferro alloys ................................................................................................ 11
Non ferrous
..........................................................................
12-18
Aluminum ................................................................................................. 12
Copper ....................................................................................................... 14
Zinc ............................................................................................................ 15
Lead ........................................................................................................... 16
Commodity curve analysis ................. ...................................................17
China non-ferrous trade data ................ ...............................................18
Key indicators
......................................................................
19-20
Industrial production growth across the globe
........................
21
BSE Exchange announcements
................................................
22
Metals valuation matrix
...........................................................
23
Metals stock performance
.......................................................
24
3 June 2013
2

Metals Weekly
Ferrous
Ferrous
INDIA
Indian flat steel prices import parity (INR/T, exl. ED & VAT)
HRC M umbai
39,000
HRC (Import Parity Mumbai) prices
decreased 2% WoW to INR32,445/t
37,000
35,000
33,000
31,000
Indian long steel price (INR/T, exl. ED & VAT)
42,000
40,000
TM T (Mumbai)
TMT (Mumbai) prices increased
1% WoW to INR34,100/t
38,000
36,000
34,000
32,000
Steel intermediates prices (INR/T, exl. ED & VAT)
25,000
23,000
Spo nge (Raipur)
Sponge iron (Raipur) prices
decreased 3% WoW to INR18,800/t
21,000
19,000
17,000
India: Monthly crude steel production
India
YoY (%
)
7.0
6.5
6.0
5.5
5.0
30
20
10
0
-10
Source: SteelMint, WSA, MOSL
3 June 2013
3

Metals Weekly
Ferrous
INDIA
Scrap Mandi (INR/t)
Scrap (M andi)
32,000
Scrap (Mandi) prices increased
1.4% WoW to INR28,100/t
30,000
28,000
26,000
Iron ore lumps (INR/t)
NM DC 6-40mm (CG)
Lumps 5-1 (Odisha)
8
9,000
8,000
7,000
6,000
5,000
4,000
Iron ore fines (INR/t)
Fines 63% (Odisha)
NM DC Fines
3,500
3,100
2,700
2,300
1,900
1,500
Pellet (Barbil) INR/t
P ellet (B arbil)
9,000
8,500
Pellet prices (Barbil) decreased by
INR400/t WoW to INR7,000/t
8,000
7,500
7,000
6,500
Source: SteelMint, WSA, MOSL
3 June 2013
4

Metals Weekly
European Union
European HRC prices (EUR/ton)
Euro pe
650
600
European HRC prices were
flat WoW at Euro458/t
550
500
450
400
Rotterdam: shredded scrap prices (USD/t)
480
450
Rotterdam export shredded scrap
prices decreased 2.2% WoW
to USD337/t
420
390
360
330
European wire rods prices (USD/ton)
Wire Ro ds (Expo rts)
750
Wire rods export prices increased
0.4% WoW to USD600t
700
650
600
550
European Union: Monthly crude steel production
EU
Yo Y (%)
17
15
13
11
20
10
0
-10
Source: Metal Bulletin, Bloomberg, WSA, MOSL
3 June 2013
5

Metals Weekly
China
China domestic prices (USD/ton)
740
HRC
Rebar
China HRC prices decreased
2.7% WoW, while Rebar prices
decreased 1% WoW
680
620
560
500
Steel trade (m ton)
Expo rts
Impo rts
6
4
2
0
Steel inventories (m tons)
9
8
7
6
5
Monthly crude steel production
China
Yo Y (%)
70
62
54
46
38
30
20
15
10
5
0
-5
-10
Source: Metal Bulletin, Bloomberg, WSA, MOSL
3 June 2013
6

Metals Weekly
Other regions
CIS HRC export prices (USD/ton)
CIS Expo rts (HRC)
620
580
CIS export HR prices decreased
4.2% WoW to USD518/t
540
500
Turkish export billets (USD/ton)
650
600
Turkish Exp B illets
Turkish export billet prices
decreased 0.5% WoW to USD528/t
550
500
North America HRC prices (USD/ton)
700
North America domestic HRC prices
bounced back from three year low
levels increasing 3.6% WoW
to USD580/t
650
600
550
CIS: Monthly crude steel production
CIS
Yo Y (%)
10
9
8
7
11
4
-3
-10
Source: Metal Bulletin, WSA, Bloomberg, MOSL
3 June 2013
7

Metals Weekly
Other regions
North America: Monthly crude steel production
No rth A merica
Yo Y (%)
11
10
9
8
20
10
0
-10
Global: Monthly crude steel production
Glo bal
Yo Y (%)
140
130
20
0
120
110
-20
Global: Monthly crude steel capacity utilization
Capacity Utilizatio n
84
81
78
75
72
69
Source: Bloomberg, WSA, MOSL
3 June 2013
8

Metals Weekly
Steel raw materials
Indian 63.5% grade iron-ore fines in China (USD/ton)
CIF
FOB
160
140
China spot CFR iron ore prices
decreased 10% WoW to
USD113/ton DMT
120
100
80
OTC iron-ore swaps (USD/ton)
3Q1
3
4Q1
3
201
4
150
130
110
90
China iron-ore production and imports (m tons)
Ore Impo rts
Ore P ro d
P ig iro n pro d (RHS)
150
120
90
70
65
60
55
60
30
50
45
China iron-ore inventories (m tons)
110
100
90
80
70
60
Source: Metal Bulletin, Bloomberg, MOSL
3 June 2013
9

Metals Weekly
Steel raw materials
Freight rates to China (USD/ton)
B razil
A ustralia
India
42
28
14
0
Coal price index
Richards B ay Steam Co al
135
115
95
75
Coke price index
China co ke expo rt spo t (LHS)
China 1 grade metallurgical co ke
st
450
400
350
300
250
200
2,200
2,175
2,150
2,125
2,100
2,075
Coking coal (USD/t)
Spo t co king co al (fo b A ustralia)
240
Spot coking coal FOB Australia
declined USD3/t WoW to USD137/t
210
180
150
120
Source: Metal Bulletin, Bloomberg, MOSL
3 June 2013
10

Metals Weekly
Ferro alloys
China’s imports of manganese ore and conc
Impo rts
P rices (RHS)
1,700
1,400
1,100
800
500
250
220
190
160
130
Manganese and chrome ore FOB spot prices
290.0
255.0
220.0
185.0
150.0
40% Chro me A frica (RHS)
Ferro chrome CIF prices (CNY/t)
Fe Chro me 50% Cr China
Fe Chro me 63% Cr P ittursburgh
13,000
11,500
10,000
8,500
7,000
5,500
Source: Metal Bulletin, Bloomberg, MOSL
3 June 2013
11

Metals Weekly
Non-ferrous
Non-ferrous
Aluminum
LME inventories and prices
Invento ries
Spo t
2,300
5.6
5.2
4.8
Aluminum spot prices increased
3% WoW to USD1,875/ton
2,100
1,900
1,700
4.4
4.0
Global primary aluminum monthly production and YoY growth
P ro ductio n
Yo Y
4,250
4,000
3,750
3,500
3,250
20
8
-4
-16
China primary aluminum monthly production and YoY growth
P ro ductio n
Yo Y
1.8
1.6
1.4
1.2
1.0
40
20
0
-20
India: Company-wise primary aluminum monthly production
Hindalco
B alco
Nalco
VA L
Source: Metal Bulletin, Bloomberg, MOSL
3 June 2013
12

Metals Weekly
Non-ferrous
Aluminum
Aluminum raw material and power cost for marginal producer in US
CP C
A lumina
P o wer
LM E+Spo t
4,000
3,000
2,000
1,000
0
CPC US
700
575
450
325
200
Alumina
480
400
320
240
160
Industrial power US (Lousiana)
10.0
8.5
7.0
5.5
4.0
Source: Metal Bulletin, Bloomberg, Industry, MOSL
3 June 2013
13

Metals Weekly
Non-ferrous
Copper
LME inventories and prices
Invento ries
Spo t
9,100
8,600
0.7
0.6
0.5
0.4
0.3
0.2
Copper spot prices were
flat WoW at USD7,241/ton
8,100
7,600
7,100
6,600
Global refined copper monthly production and YoY growth
P ro ductio n
Yo Y - RHS
1.9
1.8
1.7
1.6
1.6
1.5
1.4
10.0
7.5
5.0
2.5
0.0
-2.5
China: Refined copper monthly production and YoY growth
P ro ductio n
Yo Y - RHS
0.60
0.54
0.48
0.42
0.36
0.30
36
25
14
3
-8
India: Company-wise refined copper monthly production
80
60
40
20
0
Hindalco
HCL
Sterlite
Source: Metal Bulletin, Bloomberg, MOSL
3 June 2013
14

Metals Weekly
Non-ferrous
Zinc
LME inventories and prices
Invento ries
Spo t
2,300
1.3
1.2
Zinc spot prices increased
3% WoW to USD1,882/ton
2,100
1.1
1.0
1,900
0.9
0.8
1,700
0.7
Global refined zinc monthly production and YoY growth
P ro ductio n
Yo Y - RHS
1.2
1.1
1.1
1.0
0.9
14
6
-2
-10
China: Refined zinc monthly production and YoY growth
P ro ductio n
Yo Y - RHS
0.5
0.4
0.3
0.3
0.2
60
40
19
-2
-22
India: Company-wise refined zinc monthly production
HZL
B ZL
4
3
2 2
2 2 2 2 2 2
2
0
2
2
2
2 2
3 3 2 2
2
3 3
2
Source: Metal Bulletin, Bloomberg, MOSL
3 June 2013
15

Metals Weekly
Non-ferrous
Lead
LME inventories and prices
Invento ries
Spo t
2,600
2,400
0.40
0.36
0.32
0.28
0.24
0.20
Lead spot prices increased
7% WoW to USD2,193/ton
2,200
2,000
1,800
1,600
Global refined lead monthly production and YoY growth
P ro ductio n
Yo Y - RHS
1.0
0.9
0.8
0.7
0.6
25
15
5
-5
-15
China: Refined lead monthly production and YoY growth
P ro ductio n
Yo Y - RHS
0.5
0.4
0.3
0.2
40
20
0
-20
-40
India: Company-wise refined lead monthly production
HZL
Source: Metal Bulletin, Bloomberg, MOSL
3 June 2013
16

Metals Weekly
Commodity forward curves
LME aluminum (USD/ton)
Current
1
-week ago
3-mo nth ago
2,600
2,400
2,200
2,000
1,800
LME copper (USD/ton)
Current
1
-week ago
3-mo nth ago
8,500
8,200
7,900
7,600
7,300
7,000
6,700
LME zinc futures (USD/ton)
Current
1
-week ago
3-mo nth ago
2,500
2,400
2,300
2,200
2,100
2,000
1,900
1,800
Base metals US spot premium (USD/ton)
A luminium
Zinc
Co pper
300
235
170
105
40
Source: Metal Bulletin, Bloomberg, MOSL
3 June 2013
17

Metals Weekly
China non-ferrous trade data
China’s aluminum trade ('000 tons)
Impo rts
Expo rts
400
300
200
100
0
China’s refined copper trade ('000 tons)
Impo rts
Expo rts
500
400
300
200
100
0
China’s refined zinc trade ('000 tons)
Expo rt
Impo rt
75
50
25
0
China’s alumina imports ('000 tons) and prices (USD/ton)
Impo rts
P rices (RHS)
800
600
400
200
0
600
450
300
150
0
Source: Metal Bulletin, Bloomberg, MOSL
3 June 2013
18

Metals Weekly
Key indicators
China new loan growth
1,200
900
600
300
China PMI
54
52
50
48
China: Fixed asset investment
27
24
21
18
Currency movement with respect to the rupee
USD (LHS)
GB P
EURO
62
92
84
76
68
60
The rupee depreciated 2% WoW
against the US dollar and was
trading at INR56.4/USD
57
52
47
42
Source: Bloomberg, MOSL
3 June 2013
19

Metals Weekly
Key indicators
(Contd..)
China Energy Production Electricity (b kwh)
450
400
350
300
250
200
Electricity
Yo Y (%, RHS)
50
40
30
20
10
0
-10
China Monthly Trade YoY (%)
60
Impo rt
Expo rt
40
20
0
-20
China Price Index YoY (%)
PPI
CP I
9
6
3
0
-3
-6
China GDP YoY (%)
10
9
8
7
GDP
Source: Bloomberg, MOSL
3 June 2013
20

Metals Weekly
Industrial production growth
The UK and the US
UK
USA
6
3
0
-3
-6
Japan
20
10
0
-10
-20
European Union
France
Germany
Italy
20
8
-4
-16
BRIC
Russia
B razil
India
China
18
12
6
0
-6
Source: Bloomberg, MOSL
3 June 2013
21

Metals Weekly
Stock Exchange announcements
The Board of Directors of the
Godawari Power and Ispat
has
recommended a dividend of INR2.5 per equity share for FY13.
The Board of Directors of the
Bhushan Steel
has recommended a
dividend of INR0.5 per equity share for FY13.
The Board of Directors of the
SAIL
has recommended a dividend of INR0.4
per equity share taking total dividend to INR2 equity share for FY13.
The Board of Directors of the
Hindalco
has recommended a dividend of
INR1.4 per equity share.
The Board of Directors of the
NMDC
has recommended a dividend of
INR4 per equity share taking total dividend to INR7 equity share for
FY13.
The Board of Directors of the
Nalco
has recommended a dividend of
INR0.5 per equity share taking total dividend to INR1.25 equity share for
FY13.
The Board of Directors of the
Sarda Energy
has recommended a dividend
of INR0.5per equity share taking total dividend to INR1.25 equity share
for FY13.
Board of Directors of the
Adhunik Metaliks
has accepted the resignation
of Mr. Lalit Mohan Chatterjee from the Directorship of the Company
with effect from May 30, 2013. The Board of Directors also has decided
to extend the current accounting/financial year of the Company to close
of June 30, 2013 (for a period of 12 months beginning from July 01, 2012)
The National Green Tribunal (NGT) has today allowed the Tuticorin
Copper Smelter of
Sterlite Industries
to recommence production.
The Board of Directors of the
Sarda Energy
has recommended a dividend
of INR3 per equity share for FY13.
In terms of Section 391(3) read with Section 394(3) of Companies Act,
1956, the Composite Scheme of Amalgamation and Arrangement
between
JSW Steel
and
JSW Ispat
has become effective from June 01,
2013, upon filing of the certified copy of the Order of the Hon'ble High
Court of Bombay with the Registrar of Companies, Maharashtra, Bombay.
The Appointed Date, in terms of the Scheme, is July 01, 2012.
3 June 2013
22

Metals Weekly
Metals
Valuation Matrix
Valuations: Indian companies
Rating
Price Mkt Cap
(INR) (USD M)
5,136
4,150
2,997
4,934
8,226
2,608
EPS (INR)
FY13E
FY14E
2.8
5.7
46.1
37.2
16.7
27.1
35.8
3.9
31.7
36.7
15.0
21.6
FY15E
25.6
3.0
69.0
41.1
15.5
28.2
P/E (X)
FY14E FY15E
8.2
14.5
21.8
7.8
7.8
7.5
11.5
19.1
10.0
7.0
7.5
5.7
EV/EBITDA (X)
FY14E FY15E
5.7
7.8
6.9
7.6
3.7
31.4
6.1
8.1
6.1
6.3
3.5
6.0
P/B (X)
FY14E FY15E
1.1
0.6
0.9
1.2
1.5
1.0
1.0
0.5
0.8
1.1
1.4
1.0
Steel
Tata Steel
Sell
294
SAIL
Sell
56
JSW Steel
Sell
690
JSPL
Sell
286
NMDC
Buy
117
Sesa Goa
Buy
161
Non-Ferrous
Sterlite Inds.
Buy
93
Hindustan Zinc
Buy
115
Nalco
Neutral
34
Hindalco
Buy
103
Rain Commodities*
Buy
39
* Rain Comm. follows calendar year reporting,
5,787
18.3
17.7
15.6
5.2
5.9
3.3
2.9
8,986
16.4
15.8
15.6
7.3
7.4
3.4
2.7
1,590
2.3
2.6
2.6
13.2
13.3
5.2
4.6
3,657
18.4
17.9
16.7
5.7
6.2
6.8
6.3
264
16.7
10.2
15.2
4.1
2.8
5.5
4.5
CY13 and CY14 fig. are quoted in place of FY14 and FY15 respectively
0.6
0.6
1.3
1.1
0.7
0.7
0.9
0.8
0.5
0.4
Source: MOSL
Valuations: Global companies
BBG
Code
Mining
BHP-Billiton
FMG
Rio Tinto
Vale
Teck Resources
Steel
Arcelor Mittal
Posco
US Steel
Nucor
JFE
Gerdau
Bao Steel
Non-Ferrous
Alcoa
Norsk Hydro
Rusal
BHP AU
FMG AU
RIO AU
Vale US
TCK US
MT NA
005490 KS
X US
NUE US
5411 JT
GGBR4 BZ
600019 CH
AA US
NHY NO
486 HK
Currency
Price
Mkt Cap
(USD M)
167,243
9,758
83,978
75,320
15,544
21,453
24,859
2,552
14,145
12,606
10,208
12,974
9,090
9,430
7,163
P/E (X)
CY13
13.3
6.1
9.4
6.5
12.1
36.6
12.3
-
24.2
9.3
15.6
12.3
18.8
29.8
10.0
CY14
11.6
4.5
8.4
6.6
10.1
10.9
10.7
14.1
12.6
7.9
9.9
9.9
12.3
16.5
7.7
EV/EBITDA(X)
CY13
CY14
7.0
6.2
5.6
4.8
5.9
6.3
5.5
7.0
9.8
7.1
7.8
7.3
7.3
8.3
16.3
6.2
4.5
5.1
4.8
5.1
5.1
4.9
4.7
6.6
6.6
6.4
6.3
P/BV
CY13
2.4
1.8
1.7
0.9
0.9
0.4
0.7
0.8
1.8
0.7
1.1
0.8
AUD
AUD
AUD
USD
USD
EUR
k KRW
USD
USD
JPY
BRL
CNY
USD
NOK
HKD
34.9
3.4
55.2
14.4
26.7
9.9
322.0
17.7
44.5
2,145.0
13.1
4.8
8.5
26.7
3.7
6.3
0.7
6.4
0.8
14.5
0.6
Source: Bloomberg
3 June 2013
23

Metals Weekly
Metals Stock
Performance
Among large-cap companies,
Hindalco has outperformed and
SAIL has underperformed over
the last one month
Metals stock performance on absolute and relative basis (%)
Months
Steel
Tata Steel
SAIL
JSW Steel
JSPL
NMDC
Sesa Goa
Non-ferrous
Sterlite Inds.
Hindustan Zinc
Nalco
Hindalco
Mid Caps
Monnet Ispat
Godawari
Sarda Energy
Tata Sponge
Adhunik Metaliks
Bhushan Steel
Jai Balaji
Rain Commodities
Prakash Industries
SENSEX
Best performer
Absolute Perf (%)
1
3
6
-5.5
-11.7
-2.8
-10.2
-7.5
0.2
-4.0
-4.9
-2.0
4.8
-23.6
-1.8
-1.0
-6.2
-11.3
1.7
-7.7
-13.7
-4.2
0.9
-13.9
-21.1
-7.8
-20.3
-15.4
4.7
-0.4
-2.4
-21.9
3.8
-39.2
-4.1
3.3
-10.7
-23.4
0.7
-9.0
10.4
5.5
4.4
-23.7
-30.2
-7.1
-28.8
-28.1
-11.6
-14.5
-17.2
-26.0
-11.6
-44.5
-28.5
-23.6
-10.8
-16.3
2.2
-29.0
6.4
-24.2
2.1
12
-26.1
-38.1
14.8
-33.3
-29.1
-11.2
1.7
-1.2
-40.3
-11.7
-63.5
-27.3
-14.8
1.9
-22.4
8.3
-28.4
5.0
-25.1
23.7
Relative Perf to Sensex (%)
1
3
6
12
-6.4
-12.6
-3.7
-11.1
-8.4
-0.7
-4.9
-5.9
-2.9
3.9
-18.3
-25.5
-12.2
-24.7
-19.8
0.3
-4.9
-6.8
-26.3
-0.6
-25.9
-32.3
-9.3
-31.0
-30.2
-13.7
-16.7
-19.4
-28.1
-13.8
-49.9
-61.8
-8.9
-57.1
-52.8
-35.0
-22.0
-24.9
-64.0
-35.4
Among mid-cap companies,
Bhushan Steel outperformed and
Monnet Ispat has underperformed
over the last one month
Worst performer
-24.6 -43.6 -46.7 -87.3
-2.8
-8.5 -30.7 -51.1
-2.0
-1.1 -25.7 -38.5
-7.1 -15.1 -13.0 -21.8
-12.2 -27.8 -18.5 -46.1
0.7
-3.8
0.0 -15.5
-8.6 -13.4 -31.2 -52.1
-14.6
5.9
4.3 -18.7
-5.1
1.1 -26.4 -48.9
-
-
-
-
Source: MOSL, Bloomberg
Global metals stock performance on absolute basis (%)
1week
Mining
Rio Tinto
BHP Billiton
Vale
FMG
Anglo American
Vedanta
Steel
US Steel
Nucor
Arcelor Mittal
Bao Steel
Posco
JFE Holdings
Nippon
Thyssen Krupp
Voest Alpine
Gerdau
Aluminium
Alcoa
Rusal
Chalco
Best performer
-0.3
0.5
-7.2
-5.0
-1.9
-1.5
-4.0
-1.6
-1.7
0.0
-1.2
-8.1
-6.6
-0.5
-1.2
-6.1
0.2
-1.6
0.7
Worst performer
1month
-5.5
7.0
-14.5
-4.4
-6.7
0.0
-2.5
-0.9
2.8
-1.0
1.4
4.0
2.0
6.9
4.7
-21.1
-1.4
-6.6
6.6
Absolute Perf (%)
3 months
6 months
-17.0
-7.2
-22.4
-28.0
-19.7
8.0
-12.9
0.3
-11.9
-3.4
-9.2
2.6
0.4
-8.4
1.6
-24.2
0.7
-16.2
-4.1
-7.6
-0.6
-17.4
-16.6
-11.9
17.8
-17.9
8.1
-15.3
3.4
-0.8
61.6
33.9
-0.9
3.6
-28.0
12 months
3.1
7.8
-20.3
-28.7
-21.9
42.8
-8.4
24.4
-8.9
-0.2
-10.2
68.4
49.7
19.7
28.2
-20.8
Among global mining companies,
BHP Billiton was the best performer,
while Vale was the worst performing
stock over the last one month
Among global steel majors, Thyssen
Krupp was the best performer, while
Gerdau was the worst performing
stock over the last one month
1.1
2.4
-20.8
-20.6
-7.3
-4.4
Source: MOSL, Bloomberg
3 June 2013
24

Motilal Oswal
Product Gallery
weekly
Motilal Oswal
Sector
Periodicals
power utilities monthly

Metals Weekly
Disclosures
This report is for personal information of the authorized recipient and does not construe to be any investment, legal or taxation advice to you. This research report does not constitute an offer, invitation or inducement
to invest in securities or other investments and Motilal Oswal Securities Limited (hereinafter referred as MOSt) is not soliciting any action based upon it. This report is not for public distribution and has been
furnished to you solely for your information and should not be reproduced or redistributed to any other person in any form.
Unauthorized disclosure, use, dissemination or copying (either whole or partial) of this information, is prohibited. The person accessing this information specifically agrees to exempt MOSt or any of its affiliates
or employees from, any and all responsibility/liability arising from such misuse and agrees not to hold MOSt or any of its affiliates or employees responsible for any such misuse and further agrees to hold MOSt
or any of its affiliates or employees free and harmless from all losses, costs, damages, expenses that may be suffered by the person accessing this information due to any errors and delays.
The information contained herein is based on publicly available data or other sources believed to be reliable. While we would endeavour to update the information herein on reasonable basis, MOSt and/or its
affiliates are under no obligation to update the information. Also there may be regulatory, compliance, or other reasons that may prevent MOSt and/or its affiliates from doing so. MOSt or any of its affiliates or
employees shall not be in any way responsible and liable for any loss or damage that may arise to any person from any inadvertent error in the information contained in this report . MOSt or any of its affiliates
or employees do not provide, at any time, any express or implied warranty of any kind, regarding any matter pertaining to this report, including without limitation the implied warranties of merchantability, fitness
for a particular purpose, and non-infringement. The recipients of this report should rely on their own investigations.
This report is intended for distribution to institutional investors. Recipients who are not institutional investors should seek advice of their independent financial advisor prior to taking any investment decision
based on this report or for any necessary explanation of its contents.
MOSt and/or its affiliates and/or employees may have interests/positions, financial or otherwise in the securities mentioned in this report. To enhance transparency, MOSt has incorporated a Disclosure of Interest
Statement in this document. This should, however, not be treated as endorsement of the views expressed in the report.
Disclosure of Interest Statement
1. Analyst ownership of the stock
2. Group/Directors ownership of the stock
3. Broking relationship with company covered
4. Investment Banking relationship with company covered
Companies where there is interest
Rain Commodities, Sesa Goa, Tata Sponge
None
None
None
Analyst Certification
The views expressed in this research report accurately reflect the personal views of the analyst(s) about the subject securities or issues, and no part of the compensation of the research analyst(s) was, is, or
will be directly or indirectly related to the specific recommendations and views expressed by research analyst(s) in this report. The research analysts, strategists, or research associates principally responsible
for preparation of MOSt research receive compensation based upon various factors, including quality of research, investor client feedback, stock picking, competitive factors and firm revenues.
Regional Disclosures (outside India)
This report is not directed or intended for distribution to or use by any person or entity resident in a state, country or any jurisdiction, where such distribution, publication, availability or use would be contrary to
law, regulation or which would subject MOSt & its group companies to registration or licensing requirements within such jurisdictions.
For U.K.
This report is intended for distribution only to persons having professional experience in matters relating to investments as described in Article 19 of the Financial Services and Markets Act 2000 (Financial
Promotion) Order 2005 (referred to as "investment professionals"). This document must not be acted on or relied on by persons who are not investment professionals. Any investment or investment activity to
which this document relates is only available to investment professionals and will be engaged in only with such persons.
For U.S.
Motilal Oswal Securities Limited (MOSL) is not a registered broker - dealer under the U.S. Securities Exchange Act of 1934, as amended (the"1934 act") and under applicable state laws in the United States.
In addition MOSL is not a registered investment adviser under the U.S. Investment Advisers Act of 1940, as amended (the "Advisers Act" and together with the 1934 Act, the "Acts), and under applicable state
laws in the United States. Accordingly, in the absence of specific exemption under the Acts, any brokerage and investment services provided by MOSL, including the products and services described herein
are not available to or intended for U.S. persons.
This report is intended for distribution only to "Major Institutional Investors" as defined by Rule 15a-6(b)(4) of the Exchange Act and interpretations thereof by SEC (henceforth referred to as "major institutional
investors"). This document must not be acted on or relied on by persons who are not major institutional investors. Any investment or investment activity to which this document relates is only available to major
institutional investors and will be engaged in only with major institutional investors. In reliance on the exemption from registration provided by Rule 15a-6 of the U.S. Securities Exchange Act of 1934, as amended
(the "Exchange Act") and interpretations thereof by the U.S. Securities and Exchange Commission ("SEC") in order to conduct business with Institutional Investors based in the U.S., MOSL has entered into
a chaperoning agreement with a U.S. registered broker-dealer, Motilal Oswal Securities International Private Limited. ("MOSIPL"). Any business interaction pursuant to this report will have to be executed within
the provisions of this chaperoning agreement.
The Research Analysts contributing to the report may not be registered /qualified as research analyst with FINRA. Such research analyst may not be associated persons of the U.S. registered broker-dealer,
MOSIPL, and therefore, may not be subject to NASD rule 2711 and NYSE Rule 472 restrictions on communication with a subject company, public appearances and trading securities held by a research analyst
account.
For Singapore
Motilal Oswal Capital Markets Singapore Pte Limited is acting as an exempt financial advisor under section 23(1)(f) of the Financial Advisers Act(FAA) read with regulation 17(1)(d) of the Financial Advisors
Regulations and is a subsidiary of Motilal Oswal Securities Limited in India. This research is distributed in Singapore by Motilal Oswal Capital Markets Singapore Pte Limited and it is only directed in Singapore
to accredited investors, as defined in the Financial Advisers Regulations and the Securities and Futures Act (Chapter 289), as amended from time to time.
In respect of any matter arising from or in connection with the research you could contact the following representatives of Motilal Oswal Capital Markets Singapore Pte Limited:
Nihar Oza
Kadambari Balachandran
Email: niharoza.sg@motilaloswal.com
Email : kadambari.balachandran@motilaloswal.com
Contact: (+65) 68189232
Contact: (+65) 68189233 / 65249115
Office address: 21 (Suite 31), 16 Collyer Quay, Singapore 049318
Motilal Oswal Securities Ltd
Motilal Oswal Tower, Level 9, Sayani Road, Prabhadevi, Mumbai 400 025
Phone: +91 22 3982 5500 E-mail: reports@motilaloswal.com