Metals Weekly
8 July 2013
Metals Weekly
Valuations: Indian companies
Price
EV/EBITDA P/BV
(INR) FY14E FY15E FY14E
Steel
Tata Steel
SAIL
JSW Steel
JSPL
NMDC
Sesa Goa
Non-ferrous
Sterlite Inds.
HZL
Nalco
Hindalco
Rain Comm.
260
48
605
220
102
142
83
101
29
99
36
5.9
8.0
6.5
7.1
2.9
31.6
3.1
2.6
2.8
6.6
5.5
5.9
6.9
6.2
5.9
2.8
6.2
2.5
1.8
1.8
5.7
4.5
1.0
0.5
0.9
1.0
1.3
0.9
0.5
1.1
0.6
0.8
0.5
TMT- Mumbai (INR/ton)
HRC- Mumbai (INR/ton)
HRC (USD/ton) fob CIS
Metal Prices
CMP
8-Jul
32,100
37,098
520
%
-1
7
2
-1
-1
7
2
1
0
1
1
-1
-1
2
0
1
2
1
-1
-1
0
Week
1-Jul
32,500
34,673
510
Quarter
% 1-Apr
-8 34,900
1 36,565
-8
565
YTD CY13
% 1-Jan
-11 35,900
4 35,676
-3
538
-11
1
-11
-32
-8
4
-15
-6
-15
-11
0
106
-14
-8
-15
-30
-13
1
21,150
24,200
141
330
378
5,210
2,040
112
1,221
2,034
111
321
7,915
441
30,631
57,172
2,340
0.98
Sponge iron - Raipur (INR/ton)
18,850
Pig iron - Raipur (INR/ton)
24,500
Iron ore spot (USD/ton) cfr China
125
Coke (USD/ton) fob
225
Shred. scrap (USD/ton) Rotterdam
350
LME inventories (‘000 ton)
LME Spot (USD/ton)
Indian prices (INR ‘000/ton)
LME inventories (‘000 ton)
LME Spot (USD/ton)
Indian prices (INR ‘000/ton)
LME inventories (‘000 ton)
LME Spot (USD/ton)
Indian prices (INR ‘000/ton)
5,419
1,743
106
1,035
1,805
111
660
6,821
408
19,050 -5 19,800
24,800
1 24,200
117 -9
138
220 -15
265
347 -9
385
5,445
1,731
104
4
-7
3
5,228
1,881
102
1,171
1,870
102
571
7,582
408
Note: Detailed table on pg 23
Source: MOSL
Valuations: Global companies
Price
Mining
BHP
AUD 31.4
FMG
AUD 3.0
Rio Tinto AUD 52.4
Vale
USD 13.2
Teck Res. USD 21.4
Steel
A. Mittal
EUR 8.6
Posco k KRW 298.5
US Steel USD 17.5
Nucor
USD 43.3
JFE
JPY 2177
Gerdau
BRL 12.6
Bao Steel CNY 3.9
Non-ferrous
Alcoa
USD 7.8
Norsk Hyd. NOK 24.2
Rusal
HKD 3
Detailed on pg 23
BSE Metals Index
Sensex
102
100
98
96
94
EV/EBITDA
CY13 CY14
6.2
5.9
5.4
4.6
5.2
5.8
5.2
7.4
10.0
7.3
7.7
6.5
5.6
3.9
4.8
4.4
4.6
4.8
4.7
4.9
6.5
6.8
6.2
5.7
P/BV
CY13
2.1
1.6
1.6
0.9
0.7
0.4
0.6
0.8
1.8
0.8
1.1
0.8
1,050 -12
1,823 -3
109
9
659 16
6,750 -10
402
0
Gold (INR/10gms)
26,098
Sliver (INR/1kg)
39,845
Lead Spot LME (USD/ton)
2,035
FC 6-8% C basis 60% Cr (USD/lb Cr) 0.99
INR/USD
BDI
25,816 -12 29,526
40,286 -24 52,621
2,058 -3 2,094
0.99 -3
1.03
61.1
3
59.4 12
54.5
12
54.7
1,099 -7
1,179 21
910
57
699
Source: Metal Bulletin, Bloomberg, Steel Mint, MOSL
7.4
6.2
0.6
7.8
6.0
0.7
15.7 13.7
0.5
Source: Bloomberg
Base metals spot premiums at multiyear high - some relief against
weak LME
Steel prices showed some signs of improvement increasing 1.5%, 2%,
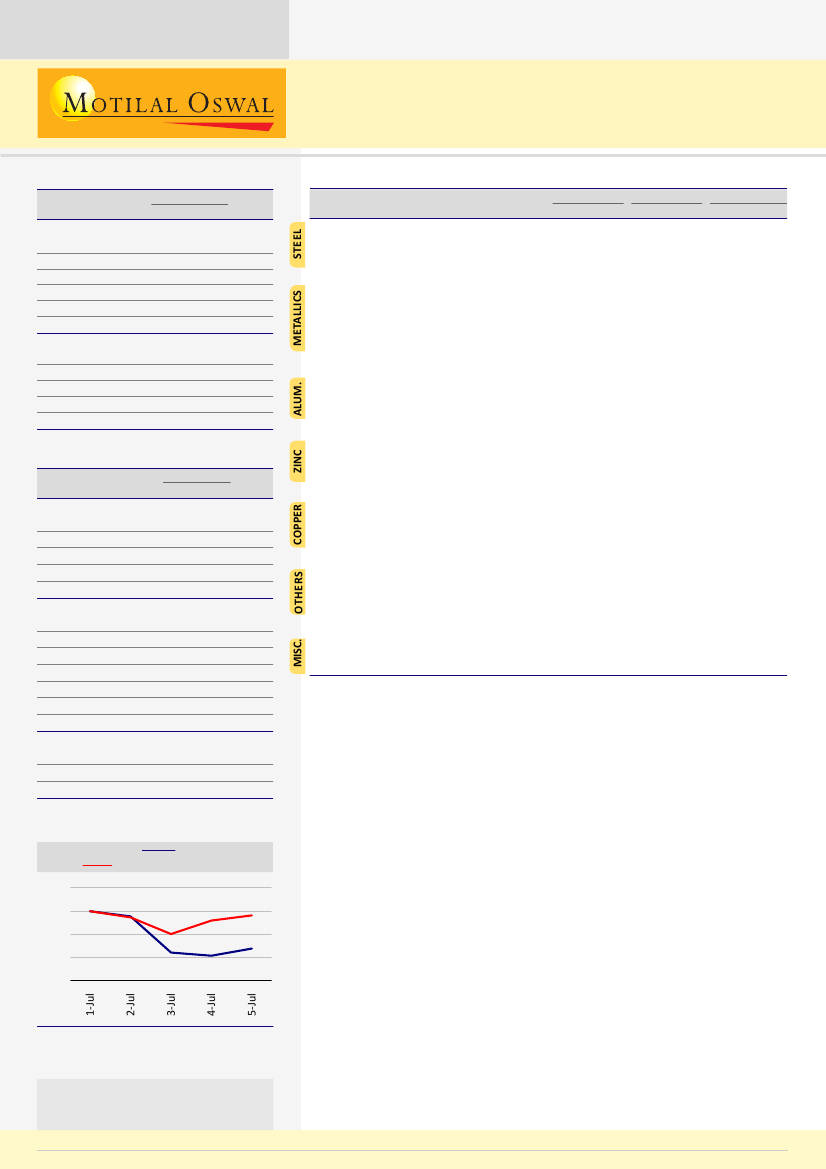
BSE Metals Index v/s Sensex
Source: Bloomberg
Note: Indexed to 100 on 1 July 2013
Stock performance table on pg 24
Investors are advised to refer through
disclosures made at the end of the
Research Report.
1.4% WoW in China, CIS and Turkey respectively. Prices were flat in Europe
and N. America.
Indian long steel prices TMT (Mumbai) decreased 1.2% WoW, while flat
product prices (offers only) HRC (Import parity, Mumbai) increased
sharply by 7% WoW to INR 37,098/t (these offers are not supported by
transactions). Import parity prices were higher due to 3% WoW rupee
depreciation and 4% WoW improvement in USD denominated prices.
Sponge iron prices decreased 1% WoW to INR18,850, while pellet prices
were flat WoW at INR6,400/t.
Iron ore prices (63.5% Fe CFR China) increased 7% WoW to USD125/t, but
the sustainability is uncertain. Coking coal prices (Premium Low vol,
Fob Australia improved USD0.5 WoW to USD130.5/t.
Base metals price were mixed with Aluminium and Copper prices
increasing 1% WoW each, while lead and zinc prices declined 1% WoW
each. Aluminium and zinc premiums shot up by 1% and 5% WoW to
multiyear high levels.
1
Sanjay Jain
(SanjayJain@MotilalOswal.com); Tel:+91 22 3982 5412
8 July
Tel:+91 22 3982 5413
Pavas Pethia
(Pavas.Pethia@MotilalOswal.com);
2013