30 July 2013
1QFY14Results Update | Sector:
Healthcare
Torrent Pharmaceuticals
BSE SENSEX
19,593
Bloomberg
Equity Shares (m)
M.Cap. (INR b) / (USD b)
52-Week Range (INR)
1, 6, 12 Rel.Per (%)
S&P CNX
5,832
TRP IN
169.2
71.2/1.2
459/304
2/19/11
CMP: INR421
TP: INR477
Buy
Financials & Valuation (INR m)
Y/E MAR
Net Sales
EBITDA
Adj PAT
2013 2014E 2015E
30,540 37,329 42,307
6,930 7,336 8,358
4,330 5,031 5,772
29.7
7
108
30.7
29.6
14.2
3.9
34.1
15
133
28.3
28.7
12.3
3.2
Adj.EPS (INR) 27.8
Growth (%) 43
BV/Share
85
(INR)
RoE (%)
35.8
RoCE (%)
P/E (x)
P/BV (X)
33.5
15.1
5.0
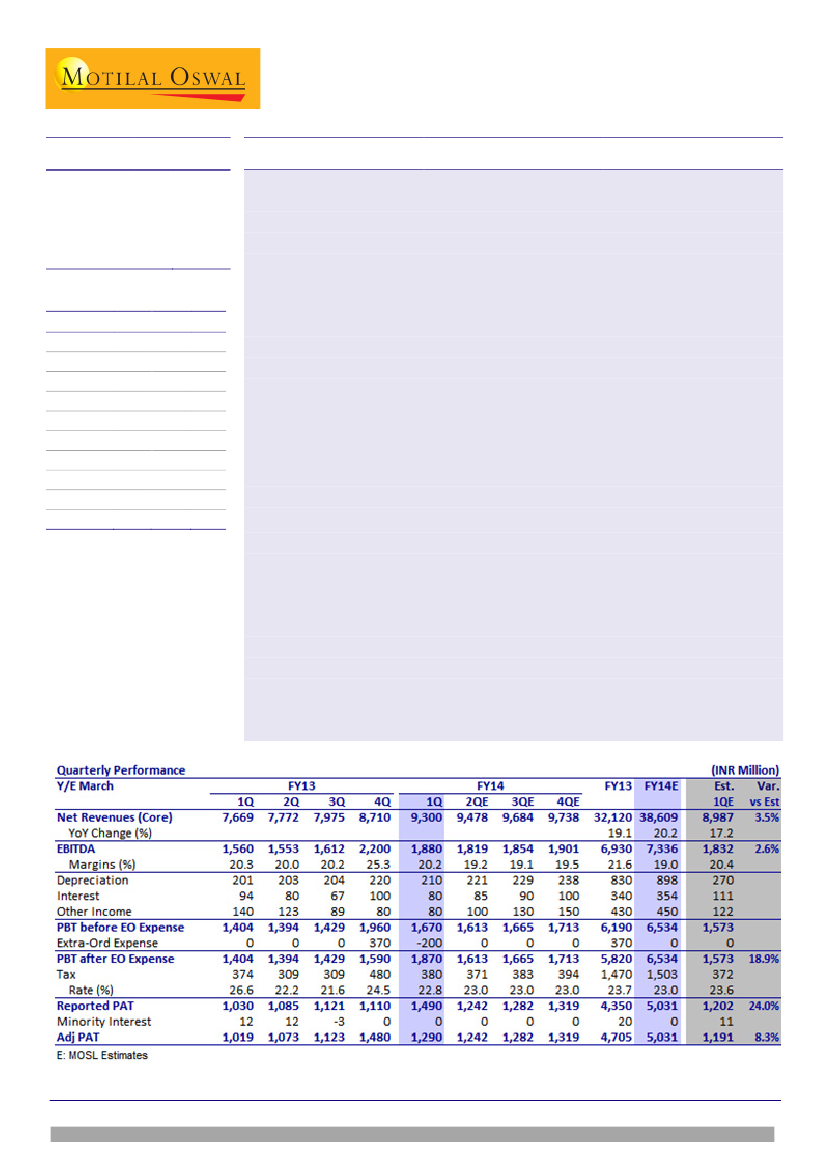
Torrent Pharma’s (TRP) revenue, adjusted for one-time income of INR420m, grew
21.3% YoY to INR9.3b (v/s est. INR8.99b). Adjusted EBITDA grew 20.5% YoY to
INR1.88b (v/s est. of INR1.83b), with EBITDA margin at 20.2% (est. 20.4%).
Adjusted PAT grew 26.7% to INR1.29b (above est. INR1.19b).
Sales growth was driven by stronger-than-expected growth in Europe, while the
US grew 40% YoY as expected. Brazil continued to report a decline of 2% YoY (as
expected), while RoW, Russia and CIS markets posted a healthy 23% YoY growth.
Domestic formulations growth was also in line with expectation at 13% YoY.
EBITDA growth was impacted by adverse sales mix, with higher contribution from
Europe (low margin business) and price pressures in Brazil. Other factors were (1)
forex loss of INR130m and (2) inventory write-down of INR220m.
Concall highlights: (1) India: Revival of growth in acute segment continues; see
signs of improving MR productivity. (2) Brazil: Price reduction in two key products
due to increasing competition; increasing focus on generic. (3) US: High growth to
sustain driven by five to six launches in FY14. (4) Europe: High growth to sustain
due to contribution from new markets of the UK and Romania.
Based on 1QFY14 performance, we increase EPS estimates for FY14E/15E by 4%/3%
mainly to reflect the higher growth in Europe. Over the last six years, TRP delivered
30% EPS CAGR, even as capital employed CAGR was just 17.6%. It consistently
improved profitability, with RoCE increasing from 14.5% in FY05 to 35.7% in FY13.
Based on revised estimates, we expect 20% EPS CAGR over FY12-15E, led by 17%
revenue CAGR. Its high return ratios are likely to sustain, despite large capex and
growing cash on the books. We believe current valuations do not reflect the
improvement in business profitability (exl. Europe), scale-up of international
operations and TRP’s strong positioning in domestic formulations, particularly in
chronic therapeutic segments. The stock trades at 14.2x FY14E and 12.3x FY15E EPS.
Maintain
Buy
with a target price of INR477 (14x FY15E EPS).
Alok Dalal(Alok.Dalal@MotilalOswal.com);+91
22 39825584
Hardick Bora(Hardick.Bora@MotilalOswal.com);+91
22 3982 5423
Investors are advised to refer through disclosures made at the end of the Research Report.

Torrent Pharmaceuticals
Topline growth led by Europe and US
Revenue, adjusted for one-time licensing income of INR420m, grew 21.3% YoY to
INR9.3b (v/s est. INR8.99b). The company reported one-time income of INR420m
on account of milestone payment arising from settlement and license agreement
involving assignment of a patent.
Sales growth was driven by stronger than expected growth in Europe (up 49% YoY
v/s est. 24%) and US generics business (up 40% YoY as expected). Revenues from
Brazil de-grew by 2% YoY (as expected) while RoW, Russia and CIS markets posted
a healthy 23% YoY growth. Domestic formulations growth was also in line with
expectation at 13% YoY.
EBITDA impacted by adverse sales mix and inventory write-down
EBITDA, adjusted for one-time settlement income and inventory write-off, grew
20.5% YoY to INR1.88b (in line with est. of 1.83b), with EBITDA margins at 20.2%
(est. 20.4%). Adjusted PAT grew 26.7% to INR1.29b (above est. INR1.19b).
Reported PAT grew 44.6% YoY to INR1.49b.
EBITDA growth was limited by adverse sales mix, with higher contribution from
Europe (low margin business) and price decreases taken in Brazil. Other factors
affecting EBITDA margin were (1) forex loss of INR130m and (2) inventory write-
down of INR220m.
EBITDA amd margin trend
EBITDA (INR m)
EBITDA Margins (%)
20.3
20.0
20.2
25.3
20.2
19.2
19.1
19.5
1Q
2Q
FY13
3Q
4Q
1Q
2QE
FY14
3QE
4QE
Source: MOSL, Company
30 July 2013
2

Torrent Pharmaceuticals
Key takeaways from concall
India formulations
Growth was at 13% YoY (as estimated) against a 8% growth in covered market.
Acute segment grew 10%, while growth in chronic segment was 13%.
Management indicated that the revival in the growth is outcome of corrective
actions taken by the management in the business over last 5-6 quarters.
As a part of the exercise to revive growth in the acute segment, the company
had added field force to focus on certain brands in GI segment. The current field
force stands at 3,800 MRs. As a result, the growth in acute therapeutic segments
has been improving over the last 3-4 quarters.
With lower attrition rate and improving MR productivity, the company will now
be consolidating its entry into new geographies and therapeutic segments.
The management did not comment on the impact of the pharma pricing policy
as it is awaiting further clarity on the implementation. We have assumed slower
growth in the domestic market as absorption of new prices is likely to lead to
significant volatility in the market in the near term
Domestic formulations revenue growth trend
Revenues (INR m)
Growth (%)
15.5
15.5
12.7
11.7
9.0
7.0
8.5
FY09
FY10
FY11
FY12
FY13
FY14E
FY15E
Source: MOSL, Company
Brazil
Recorded de-growth of 2% in INR terms (as expected) impacted by (1) price
reduction taken to combat increasing competition and (2) the overall slow-down
in the market. Growth in constant currency terms was mere 7%.
TRP is facing severe competition for its two major products, Venlafaxine and
Lamotrigine, and has consequently taken 40-50% price reduction for them to
maintain market share. This was partly responsible for the inventory write-off
taken during this quarter.
The company is now focusing on launching generic-generic products in the US,
starting with 4-5 products in FY14E itself. The management indicated that it has
a pipeline of 20-25 such products which it plans to commercialize over the next
2-3 years.
The management believes that this shift in strategy could marginally impact
gross margins. We have taken this into account while lowering our EBITDA
estimates for FY14E/15E.
We are estimating a conservative 2% growth for TRP’s Brazilian operations for
FY14E, which will start normalizing with a 11% growth in FY15.
3
30 July 2013

Torrent Pharmaceuticals
Latam - FY13 impacted by ANVISA strike & overall slow-down; gradual recovery ahead
Latam revenues (INR m)
Growth (%)
44.9
32.1
17.4
19.9
5.2
1.9
FY09
FY10
FY11
FY12
FY13
FY14E
FY15E
11.1
Source: MOSL, Company
US Generics
Grew 43% led by new product launches, market share gain in existing products,
and favorable currency. Growth in constant currency was 38%.
Management has indicated of strong growth going forward as it scales up the US
operations, led primarily by new launches.
The company expects to launch 5-6 new products in FY14E, including one shared
FTF. It currently has 24 ANDAs pending approval with the US FDA while 43
ANDAs have already been approved.
We note that TRP does not have a very strong patent challenge strategy and
hence the launch of these products will be mainly linked to relevant patent
expiry. However, we believe that the incremental launches will provide benefits
of operating leverage, as the company’s rate & quality of ANDA filings is more-
or-less constant.
US revenues growth trend - High growth to continue
US revenues (USD m)
Growth (%)
116
216.5
65
45
19
6
FY09
FY10
25
30.8
FY11
43.6
81.1
36.6
30.0
89
FY12
FY13
FY14E
FY15E
Source: MOSL, Company
Europe
Growth during 1QFY14 was driven by (1) high growth in Heumann on the back
of tender wins and (2) incremental dossier income from UK & Romania which
was absent till 9MFY13. The management has indicated that this high growth in
Europe will be maintained through FY14E.
In contrast to rest of Europe, the revenue from UK & and Romania are more
profitable owing to the branded-generic business model adopted by TRP.
However, we are of the opinion that margins for these markets are below TRP’s
overall profitability and their increasing contribution will exert pressure on
EBITDA margins going forward.
4
30 July 2013

Torrent Pharmaceuticals
Europe - High growth in FY14E driven new markets; normalization in FY15E
Latam revenues (INR m)
Growth (%)
33.7
31
21.1
3.5
20.7
19.9
13.9
FY09
FY10
FY11
FY12
FY13
FY14E
FY15E
Source: MOSL, Company
Other takeaways
CRAMS business may see some revival due to expected increase in sourcing by
Novo Nordisk (based on tender wins).
Earlier management had indicated that capex will be ~INR2.5b for FY14E. Tax
rate will be in the range of 22-24%.
Play on highly profitable, fast growing lifestyle segments in domestic
market; however, early signs of revival in the acute segment
Though ranked 17th in terms of total revenue in the domestic formulations
segment, TRP derives its strength from being the leader in some of the most
lucrative and fastest growing chronic therapy segments. As of FY13, TRP derived
66% of its domestic business from chronic segment compared to 29% of the
industry.
It enjoys market leadership in niche therapy segments of CVS and CNS, which
are highly profitable and are likely to sustain high growth. It has consistently
maintained its leadership in these therapeutic classes, with strong brands and
new product launches. Torrent has 5 brands in the industry's top 300 brands,
and has 37 brands in leadership positions in their respective molecule segments.
Through constructive measure undertaken over the last 15-18 months, TRP has
revived its slowing growth in acute segment as well.
International business – regulated markets lead growth; emerging markets
lead profitability improvement
Torrent's investments in its international operations have started paying off and
we expect profit margins to expand (ex Europe) as operations scale up. This,
combined with healthy revenue growth expected in markets like US, Europe and
scale up into some of largest branded generics markets like Mexico, UK and
Romania, will drive revenue growth and increase profits from intl operations.
Torrent Pharma has established itself in large international markets like Brazil
and Germany. The next phase of growth will be driven by regulated markets like
US and entry into some of the large European markets like UK and Romania.
We expect revenue from regulated markets (incl. Germany) to clock CAGR of
28% over FY13-15E, led by the US, UK and Romania.
30 July 2013
5

Torrent Pharmaceuticals
Upgrading EPS estimates
Based on 1QFY14 performance, we have increased our sales estimate for
FY14E/15E by 5%/2% mainly to reflect higher growth in Europe.
We have lowered our FY14E/15E EBITDA estimates by 1%/3% mainly to reflect
increasing pressure on EBITDA margins due to pricing pressure in Brazil and
increasing contribution from Europe. This will be partially offset by increasing
profitability in US and domestic formulations.
Our FY14E/15E EPS estimate is increased by 4%/3%.
Revised Forecast (INR m)
Rev
38,609
7,336
5,031
29.7
FY14E
Old
36,872
7,375
4,817
28.5
Chg (%)
4.7
-0.5
4.4
4.5
Rev
43,307
8,358
5,772
34.1
FY15E
Old
42,414
8,605
5,620
33.2
Chg (%)
2.1
-2.9
2.7
2.7
Source: MOSL
Net Sales
EBITDA
Net Profit
EPS (INR)
Valuation and
view
Over last 6 years, Torrent has delivered 30% EPS CAGR, even as capital
employed CAGR was just 17.6%. It consistently improved profitability, with RoCE
increasing from 14.5% in FY05 to 35.7% in FY13.
Based on revised estimates, we expect 20% EPS CAGR over FY12-15E, led by 17%
revenue CAGR. Its high return ratios are likely to sustain, despite large capex and
growing cash on the books.
We believe current valuations do not reflect the improvement in business
profitability (ex Europe), scale up of international operations, and Torrent's
strong positioning in domestic formulations, particularly in chronic therapeutic
segments.
The stock trades at 14.2x FY14E and 12.3x FY15E EPS. Maintain
Buy
with target
price of INR477 (14x FY15E EPS).
30 July 2013
6

Torrent Pharmaceuticals
Torrent Pharmaceuticals: an investment profile
Company description
Torrent Pharma is one of the second tier Pharma
companies that is actively targeting the regulated
generics and semi-regulate markets. The company has
strong presence in domestic market with focus and
leadership in CVS and CNS segments. The company has
large presence in some of the key global markets like
Brazil and Germany while it is expanding its footprint in
key markets like US, Europe and RoW.
Key investment risks
Regulatory risk related to product approvals,
manufacturing cost and various laws across
business segments
Foreign exchange risk as around 50% revenues of
the company come from the export markets.
Valuation and view
Key investment arguments
Torrent derives its strength from being the leader in
some of the most lucrative and fastest growing
chronic therapy segments. Line CVS and CNS
In International business, it will grow profitable on
the back of presence in both generic and branded
markets.
The company has consistently delivered improving
financial performance, with increase in RoCE& RoE
Torrent's net debt-equity ratio has come down from
0.7x in FY07 to zero since FY11.
Over last 6 years, Torrent has delivered 30% EPS
CAGR, even as capital employed CAGR was just
17.6%. It consistently improved profitability, with
RoCE increasing from 14.5% in FY05 to 35.7% in
FY13.
The stock trades at 14.2x FY14E and 12.3x FY15E
EPS. Maintain
Buy
with target price of INR477 (14x
FY15E EPS).
Sector view
Recent developments
Nil
Regulated markets would remain the key sales and
profit drivers in the medium term. Japan is
expected to emerge as the next growth driver,
particularly for companies with a direct marketing
presence.
We are overweight on companies that are towards
the end of the investment phase, with benefits
expected to start coming in from the next fiscal.
Comparative valuations
Torrent
Pharma
14.2
12.3
3.9
3.2
1.8
1.6
9.7
8.4
Glenmark
25.3
18.9
4.9
3.9
3.0
2.5
15.7
12.1
Cadila
Healthcare
18.8
15.7
4.7
3.8
2.6
2.2
12.2
10.2
EPS: MOSL forecast v/s consensus (INR)
MOSL
Forecast
FY14
FY15
29.7
34.1
Consensus
Forecast
28.3
32.8
Variation
(%)
5.0
4.0
P/E (x)
P/BV (x)
EV/Sales (x)
EV/EBITDA (x)
FY14E
FY15E
FY14E
FY15E
FY14E
FY15E
FY14E
FY15E
Target price and recommendation
Current
Price (INR)
421
Target
Price (INR)
477
Upside
(%)
13.3
Reco.
Buy
Shareholding pattern (%)
Jun-13
Promoter
Domestic Inst
Foreign
Others
71.5
9.5
7.7
11.3
Mar-13
71.5
9.7
7.3
11.6
Jun-12
71.5
12.1
5.3
11.2
Stock performance (1 year)
30 July 2013
7

Torrent Pharmaceuticals
Financials and valuation
Income statement
Y/E March
Net Sales
Change (%)
EBITDA
EBITDA Margin (%)
Depreciation
EBIT
Interest
Other Income
Extraordinary items
PBT
Tax
Tax Rate (%)
Reported PAT
Adjusted PAT
Change (%)
Adj Cons PAT
2012
25,946
23
5,218
19.4
817
4,400
395
445
863
3,588
730
20.3
2,858
3,287
22
3,287
2013
30,540
18
6,930
21.6
830
6,100
340
430
370
5,820
1,470
25.3
4,350
4,705
43
4,705
(INR Million)
2014E
37,329
22
7,336
19.0
898
6,438
354
450
0
6,534
1,503
23.0
5,031
5,031
7
5,031
2015E
42,307
13
8,358
19.3
1,003
7,355
354
495
0
7,496
1,724
23.0
5,772
5,772
15
5,772
Ratios
Y/E March
Basic (INR)
EPS
Cash EPS
Book Value
DPS
Payout (incl. Div. Tax.)
Valuation (x)
P/E
Cash P/E
Price / Book Value
EV/EBITDA
EV/Sales
Dividend Yield (%)
Profitability Ratios (%)
RoE
RoCE
Turnover Ratios (%)
Asset Turnover (x)
Debtors (days)
Inventory (days)
Wkg Capital (days)
Leverage Ratios (%)
Debt/Equity (x)
2012
19.4
21.6
70.5
8.5
29
21.7
19.5
6.0
13.1
2.6
2.0
29.7
28.8
1.5
71
72
15
0.5
2013
27.8
30.5
84.9
23.0
52
15.1
13.8
5.0
10.1
2.2
5.5
35.8
33.5
1.5
78
105
40
0.5
2014E
29.7
35.0
108.5
7.4
29
14.2
12.0
3.9
9.4
1.8
1.8
30.7
29.6
1.5
76
75
47
0.4
2015E
34.1
40.0
132.6
8.5
29
12.3
10.5
3.2
8.2
1.6
2.0
28.3
28.7
1.5
74
83
56
0.3
Balance sheet
Y/E March
Share Capital
Reserves
Net Worth
Debt
Deferred Tax
Total Capital Employed
Gross Fixed Assets
Less: Acc Depreciation
Net Fixed Assets
Capital WIP
Investments
Current Assets
Inventory
Debtors
Cash & Bank
Loans & Adv, Others
Curr Liabs & Provns
Curr. Liabilities
Provisions
Net Current Assets
Total Assets
2012
423
11,515
11,938
5,786
514
18,274
11,990
4,022
7,968
1,188
1,240
20,081
5,315
5,228
6,743
2,795
12,202
10,395
1,807
7,878
18,274
2013
423
13,947
14,370
6,930
258
21,561
14,960
4,852
10,108
1,094
605
25,861
9,239
6,878
6,270
3,475
16,107
12,387
3,720
9,755
21,561
(INR Million)
2014E
2015E
846
846
17,507 21,590
18,353 22,436
6,931
6,931
369
369
25,656 29,739
17,560 20,322
5,750
6,753
11,811 13,569
1,047
1,023
605
605
27,074 31,125
7,950
9,895
8,108
9,095
7,193
7,931
3,822
4,204
14,881 16,583
11,715 13,179
3,166
3,405
12,193 14,542
25,656 29,739
E: MOSL Estimates
Cash flow statement
Y/E March
OP/(Loss) before Tax
Others
Direct Taxes Paid
(Inc)/Dec in Wkg Cap
CF from Op. Activity
(Inc)/Dec in FA & CWIP
(Pur)/Sale of Invt
Others
CF from Inv. Activity
Inc/(Dec) in Net Worth
Inc / (Dec) in Debt
Interest Paid
Divd Paid (incl Tax)
CF from Fin. Activity
Inc/(Dec) in Cash
Add: Opening Balance
Closing Balance
2012
5,218
445
-696
902
5,006
-1,736
220
0
-1,516
0
85
-395
-836
-1,535
1,955
4,788
6,743
2013
6,930
430
-1,727
-2,349
2,914
-2,876
636
0
-2,241
0
1,112
-340
-2,273
-1,146
-473
6,743
6,270
(INR Million)
2014E
7,336
450
-1,391
-1,515
4,880
-2,554
0
0
-2,554
423
1
-354
-1,472
-1,402
924
6,270
7,194
2015E
8,358
495
-1,724
-1,611
5,518
-2,738
0
0
-2,738
0
0
-354
-1,688
-2,042
738
7,193
7,931
30 July 2013
8

Torrent Pharmaceuticals
NOTES
30 July 2013
9

Disclosures
This report is for personal information of the authorized recipient and does not construe to be any investment, legal or taxation advice to you. This research report does not constitute an offer, invitation or
inducement to invest in securities or other investments and Motilal Oswal Securities Limited (hereinafter referred as MOSt) is not soliciting any action based upon it. This report is not for public distribution
and has been furnished to you solely for your information and should not be reproduced or redistributed to any other person in any form.
Unauthorized disclosure, use, dissemination or copying (either whole or partial) of this information, is prohibited. The person accessing this information specifically agrees to exempt MOSt or any of its
affiliates or employees from, any and all responsibility/liability arising from such misuse and agrees not to hold MOSt or any of its affiliates or employees responsible for any such misuse and further agrees
to hold MOSt or any of its affiliates or employees free and harmless from all losses, costs, damages, expenses that may be suffered by the person accessing this information due to any errors and delays.
The information contained herein is based on publicly available data or other sources believed to be reliable. While we would endeavour to update the information herein on reasonable basis, MOSt and/or
its affiliates are under no obligation to update the information. Also there may be regulatory, compliance, or other reasons that may prevent MOSt and/or its affiliates from doing so. MOSt or any of its
affiliates or employees shall not be in any way responsible and liable for any loss or damage that may arise to any person from any inadvertent error in the information contained in this report. MOSt or any
of its affiliates or employees do not provide, at any time, any express or implied warranty of any kind, regarding any matter pertaining to this report, including without limitation the implied warranties of
merchantability, fitness for a particular purpose, and non-infringement. The recipients of this report should rely on their own investigations.
Torrent Pharmaceuticals
This report is intended for distribution to institutional investors. Recipients who are not institutional investors should seek advice of their independent financial advisor prior to taking any investment decision
based on this report or for any necessary explanation of its contents.
MOSt and/or its affiliates and/or employees may have interests/positions, financial or otherwise in the securities mentioned in this report. To enhance transparency, MOSt has incorporated a Disclosure of
Interest Statement in this document. This should, however, not be treated as endorsement of the views expressed in the report.
Disclosure of Interest Statement
1. Analyst ownership of the stock
2. Group/Directors ownership of the stock
3. Broking relationship with company covered
4. Investment Banking relationship with company covered
TORRENT PHARMACEUTICALS LTD
No
No
No
No
Analyst Certification
The views expressed in this research report accurately reflect the personal views of the analyst(s) about the subject securities or issues, and no part of the compensation of the research analyst(s) was, is,
or will be directly or indirectly related to the specific recommendations and views expressed by research analyst(s) in this report. The research analysts, strategists, or research associates principally
responsible for preparation of MOSt research receive compensation based upon various factors, including quality of research, investor client feedback, stock picking, competitive factors and firm revenues.
This report is not directed or intended for distribution to or use by any person or entity resident in a state, country or any jurisdiction, where such distribution, publication, availability or use would be contrary
to law, regulation or which would subject MOSt & its group companies to registration or licensing requirements within such jurisdictions.
Regional Disclosures (outside India)
This report is intended for distribution only to persons having professional experience in matters relating to investments as described in Article 19 of the Financial Services and Markets Act 2000 (Financial
Promotion) Order 2005 (referred to as "investment professionals"). This document must not be acted on or relied on by persons who are not investment professionals. Any investment or investment activity
to which this document relates is only available to investment professionals and will be engaged in only with such persons.
For U.K.
Motilal Oswal Securities Limited (MOSL) is not a registered broker - dealer under the U.S. Securities Exchange Act of 1934, as amended (the"1934 act") and under applicable state laws in the United
States. In addition MOSL is not a registered investment adviser under the U.S. Investment Advisers Act of 1940, as amended (the "Advisers Act" and together with the 1934 Act, the "Acts), and under
applicable state laws in the United States. Accordingly, in the absence of specific exemption under the Acts, any brokerage and investment services provided by MOSL, including the products and services
described herein are not available to or intended for U.S. persons.
This report is intended for distribution only to "Major Institutional Investors" as defined by Rule 15a-6(b)(4) of the Exchange Act and interpretations thereof by SEC (henceforth referred to as "major
institutional investors"). This document must not be acted on or relied on by persons who are not major institutional investors. Any investment or investment activity to which this document relates is only
available to major institutional investors and will be engaged in only with major institutional investors. In reliance on the exemption from registration provided by Rule 15a-6 of the U.S. Securities Exchange
Act of 1934, as amended (the "Exchange Act") and interpretations thereof by the U.S. Securities and Exchange Commission ("SEC") in order to conduct business with Institutional Investors based in the
U.S., MOSL has entered into a chaperoning agreement with a U.S. registered broker-dealer, Motilal Oswal Securities International Private Limited. ("MOSIPL"). Any business interaction pursuant to this
report will have to be executed within the provisions of this chaperoning agreement.
The Research Analysts contributing to the report may not be registered /qualified as research analyst with FINRA. Such research analyst may not be associated persons of the U.S. registered broker-
dealer, MOSIPL, and therefore, may not be subject to NASD rule 2711 and NYSE Rule 472 restrictions on communication with a subject company, public appearances and trading securities held by a
research analyst account.
For U.S.
Motilal Oswal Capital Markets Singapore Pte Limited is acting as an exempt financial advisor under section 23(1)(f) of the Financial Advisers Act(FAA) read with regulation 17(1)(d) of the Financial
Advisors Regulations and is a subsidiary of Motilal Oswal Securities Limited in India. This research is distributed in Singapore by Motilal Oswal Capital Markets Singapore Pte Limited and it is only directed
in Singapore to accredited investors, as defined in the Financial Advisers Regulations and the Securities and Futures Act (Chapter 289), as amended from time to time.
In respect of any matter arising from or in connection with the research you could contact the following representatives of Motilal Oswal Capital Markets Singapore Pte Limited:
Kadambari Balachandran
Email : kadambari.balachandran@motilaloswal.com
Contact: (+65) 68189233 / 65249115
Office address: 21 (Suite 31), 16 Collyer Quay, Singapore 049318
For Singapore
Motilal Oswal Securities Ltd
30 July 2013
Motilal Oswal Tower, Level 9, Sayani Road, Prabhadevi, Mumbai 400 025
Phone: +91 22 3982 5500 E-mail: reports@motilaloswal.com
10