12 August 2013
1QFY14Results Update | Sector:
Healthcare
Cipla
BSE SENSEX
18,947
Bloomberg
Equity Shares (m)
52-Week Range (INR)
1, 6, 12 Rel.Per (%)
S&P CNX
5,612
CIPLA IN
802.9
435/347
8/9/11
CMP: INR415
TP: INR425
Neutral
M.Cap. (INR b) / (USD b) 333.2/5.5
Financials & Valuation (INR b)
Y/E MAR
Sales
EBITDA
Net Profit
Adj. EPS
BV/Sh.
RoE (%)
RoCE (%)
P/E (x)
P/BV (x)
2013
82.8
22.0
13.1
16.4
112.2
14.6
20.4
25.3
3.7
2014E 2015E
100.6
23.0
15.1
18.8
14.6
127.5
14.7
18.5
22.1
3.3
115.5
25.9
17.0
21.2
13.1
144.0
14.7
19.1
19.5
2.9
EPS Gr. (%) 16.9
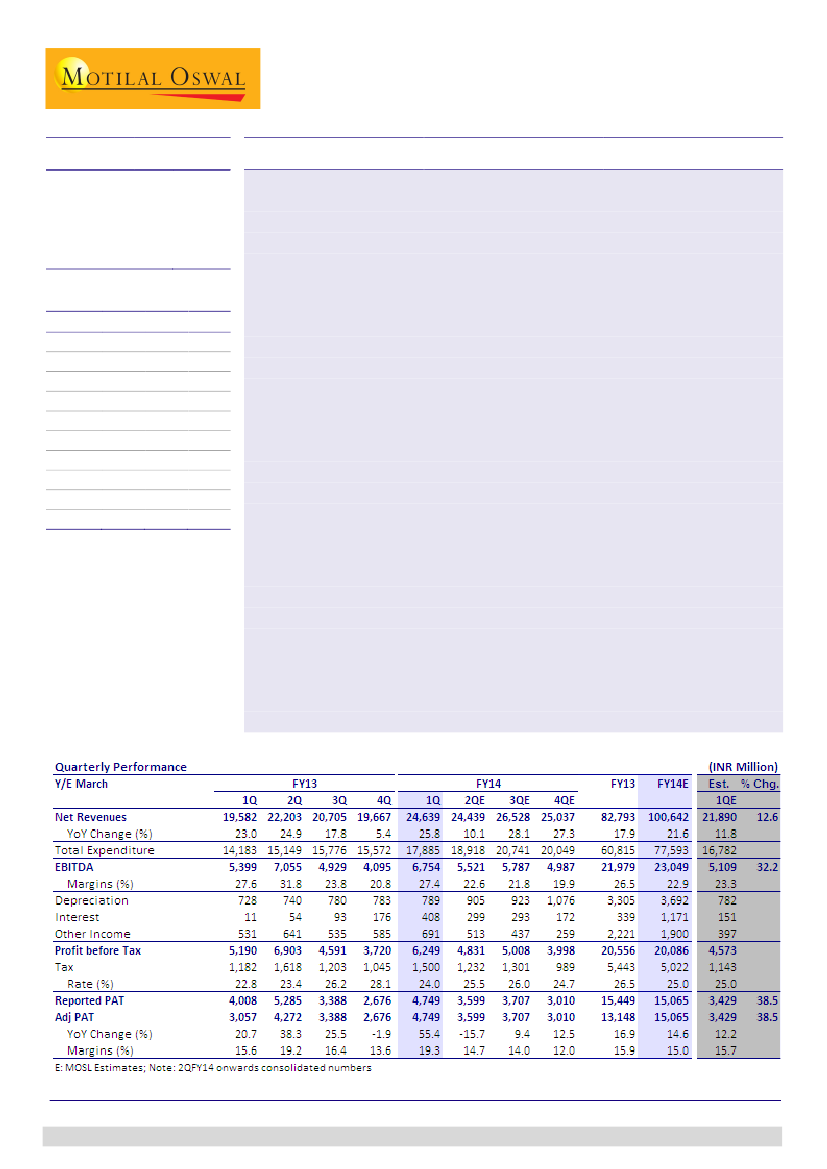
Reported revenue grew 26% YoY to INR24.6b (v/s est. of INR21.9b), reported
EBITDA grew 25% YoY to INR6.75b (v/s est. of INR5.1b) and reported PAT grew
18% to INR4.75b (v/s est. of INR3.4b).
Growth was driven by domestic sales, up 18% YoY (v/s est. of flat growth), and 4x
growth YoY in other operating income (v/s est. of 26%), which included a one-
time milestone payment from Meda for Dymista (not quantified, but we estimate
it at ~USD20-22m).
Reported EBITDA margin was down mere 20bp YoY to 27.4% (v/s est. 23.3%) due
to the licensing income, adjusted for which margins are in line with estimates.
Adjusted for one-off sales in 1QFY13 and the licensing income this quarter, we
estimate that core sales grew 34% YoY (v/s est. 25%), core EBITDA grew 32% YoY
(v/s est. of 23%) and adjusted PAT grew 24% YoY (v/s est. of 12%).
FY14 guidance:
Management has guided for 14-15% sales growth (organic) for
FY14, driven by export formulations. Domestic formulations’ growth is pegged at
12-14% after considering 2-3% impact of the new drug policy. Without giving any
specific guidance on the EBITDA margin, management indicated that profitability
may be impacted by higher R&D expenses (guided at 4-5% of sales) and higher
staff costs. Tax rate is guided at 25%, while capex will be INR4b (apart from the
addition of INR1.5-2b from CWIP).
Post 1QFY14 earnings, we upgrade EPS estimates for FY14E/15E by 4% to reflect the
benefit from Cipla Medpro acquisition, which is partially offset by expected negative
impact of DPCO 2013. Factors driving performance in 1QFY14 are also non-recurring
in nature. The coming quarters will be challenging for Cipla due to the impact from
new pricing policy and increasing pressure on profitability due to rising manpower,
R&D and interest costs. We estimate core EPS of INR18.8 for FY14E (up 15% YoY) and
INR21.2 for FY15E (up 13% YoY). The stock trades at 22.1x FY14E and 19.5x FY15E
earnings. We maintain
Neutral
with a revised target price of INR425 (20x FY15E EPS).
Alok Dalal(Alok.Dalal@MotilalOswal.com);+91
22 3982 5584
Hardick Bora(Hardick.Bora@MotilalOswal.com);+91
22 3982 5423
Investors are advised to refer through disclosures made at the end of the Research Report.

Cipla
1QFY14 results were above estimates, driven by one-off licensing income
Reported revenues grew 26% YoY to INR24.6b (v/s est of INR21.9b), reported
EBITDA grew 25% YoY to INR6.75b (v/s est of INR5.1b) and reported PAT grew 18%
to INR4.75b (v/s est of INR3.4b).
Domestic sales grew 18% YoY (v/s est flat growth), while export formulations grew
21% (in line). Export APIs sales declined 13% YoY (below est. growth of 2%). Other
operating income grew 4x YoY due to one-time milestone payment from Meda for
Dymista (not quantified, but we estimate it at ~USD20-22m).
Adjusted for one-off sales in 1QFY13 and the licensing income this quarter, we
estimate core sales to have grown 34% YoY (v/s est 25%),
Sales mix
(INR M)
Domestic
% of revenues
Exports
% of revenues
Formulations
APIs
Other Operating Income
% of revenues
Total Net Revenues
1QFY14
11,040
45
11,807
48
10,344
1,463
1,792
7
24,639
1QFY13
9,388
48
9,786
50
8,101
1,685
408
2
19,582
25.8
27.7
(13.1)
339.1
20.7
YoY (%)
17.6
4QFY13
7,772
40
11,290
57
9,540
1,750
605
3
19,667
25.3
8.4
(16.4)
196.3
4.6
QoQ (%)
42.0
EBITDA grew mere 25% to INR6.75b (v/s est. of 5% decline to INR5.1b). EBITDA
marginally declined 20bp YoY and stood at 27.4% (v/s our est. of 23.3%), primarily
due to licensing income from Meda, adjusted for which EBITDA margin were in line
with est.
Adjusted for one-off sales in 1QFY13 and the licensing income this quarter, we
estimate core EBITDA to have grown 32% YoY (v/s est of 23%) and adjusted PAT
growth of 24% YoY (v/s est of 12%).
EBITDA & EBITDA margin trend
27.6
31.8
23.8
EBITDA
Margins (%)
20.8
27.4
22.6
21.8
19.9
1Q
2Q
FY13
3Q
4Q
1Q
2QE
FY14
3QE
4QE
Source: MOSL, Company
12 August 2013
2

Cipla
Management guides for 14-15% sales growth in FY14E; indicated of
pressure on margins in the near term
The management has guided for 14-15% sales growth (organic) for FY14E, driven
by export formulations. Cipla Medpro consolidation will be taken into effect
from 15
th
July 2013.
Domestic formulations is guided to grow 12-14% after considering 2-3% impact
(on annual India sales) of the DPCO 2013.
Without giving any specific guidance on EBITDA margins, the management
indicated that profitability maybe impacted by higher R&D expenses (guided at
4-5% of sales) and higher staff costs.
Tax rate is guided at 25%, while capex will be INR4b (apart from addition of
INR1.5-2b from CWIP).
FY14E Guidance
Business
Overall Topline Growth (%)
Guidance
14-15%
Remarks
To be driven by double digit growth in
domestic formulations. Guidance does not
include upside from CMSA consolidation.
Increased R&D spend and employee costs
will impact margins in the near term. We
have estimated 23%/22% for FY14E/15E.
Has been in the range of 3-4% historically
In line with our earlier estimates
Capex mainly directed towards API & R&D
capacity expansion. Besides this another
INR1.5-2b will added from CWIP.
EBITDA Margins (%)
R&D Expenses (%)
Tax Rate (%)
Capex (INR b)
Lower Margins
4-5
25%
4.0
Cipla Medpro South Africa (CMSA) acquisition - to provide front-end in
South Africa, accretive by 6-8%.
Cipla has announced the conclusion of the acquisition of Cipla Medpro South
Africa (CMSA) for USD512m. This is in line with Cipla’s strategy to establish its
own front-end in key emerging markets.
CMSA is one of South Africa's top ten pharmaceutical groups. The Group's
operations comprise of two divisions: 1) Cipla Medpro, South Africa’s third
largest pharma company by value selling chronic & OTC medicines to the public
and private sector; and 2) Cipla Medpro Manufacturing, one of the first
international compliant pharmaceutical manufacturing facilities in South Africa.
For CY12, it reported revenues of USD280m, EBITDA of USD45m (EBITDA
margins of 16.3%) and PAT of USD20m. The deal values Cipla Medpro at 9x CY13
EV/EBITDA (Bloomberg consensus est).
Although, we are awaiting some clarity on the accounting intricacies of this
consolidation, we have factored in the upside from this acquisition into our
estimates from this quarter onwards. This has added 6%/8% to our earlier
FY14E/15E EPS estimate (prior to the 1QFY14 results).
12 August 2013
3

Cipla
Cipla Medpro – Key financials
INR/USD
(INR M)
Sales
YoY Growth (%)
EBITDA
EBITDA Margins (%)
PAT
YoY Growth (%)
ROCE (%)
RoE (%)
48
CY11
11,739
3,117
26.6
1,749
19.7
15.1
54.5
CY12
15,283
30.2
2,485
16.3
1,105
-36.9
17.8
14.6
57.5
CY13E
16,649
8.9
3,033
18.2
1,793
62.3
15.4
57
CY14E
18,293
9.9
3,326
18.2
2,097
17.0
57
CY15E
20,139
10.1
2,762
13.7
2,113
0.8
15.8
15.8
Source: Bloomberg
Cipla Medpro Acqn (INR m)
Current Est
100,642
20.0
23,049
22.9
0
15,065
18.8
FY14E
Incl. Medpro
113,540
37.1
25,397
22.4
591
0
15,895
19.8
Var.
12.8
10.2
Current Est
115,460
16.4
25,919
22.4
0
17,045
21.2
FY15E
Incl. Medpro
Var.
134,214
16.2
33.4
29,104
12.3
21.7
698
0
-
18,448
8.2
23.0
8.2
Source: Bloomberg, MOSL
Sales
YoY Growth %
EBITDA
EBITDA Margins (%)
Less: Increase in interest cost
Minority Interest (for Medpro minority)
PAT (after minority int.)
EPS (INR/sh)
-
5.5
5.5
Domestic formulations records healthy 18% growth in 1Q FY14 despite
industry wide problems-expect slower growth ahead
Domestic formulations reported a strong 17.6% growth in 1QFY14, coming on
the back of a high base of 1QFY13 which grew 30% YoY. The management has
indicated that it expects growth in FY14E to be in the range of 12-14% after
taking the new pricing policy’s impact. Hence we expect this business to witness
single to lower double digit growth over the coming quarters.
The implementation of new pricing policy will impact 2-3% of the segment’s
annual sales. This will also impair profitability going forward.
We have estimated 13%/14% growth in domestic formulations in FY14E/15E.
Investing to establish front-end in foreign markets; This along with high
manpower costs will exert pressure in margins in medium-term
Cipla has started making investments to establish front-end in export markets,
where it is now present through its partners. The acquisition of CMSA was a first
step in this direction.
It is planning direct entry in to the US market as well and has filed 6 ANDAs on
its own till date from the recently approved (in 2QFY13) Indore SEZ. We believe
that Cipla will be a very late entrant in US and hence may not be able to
generate scale in the medium term.
To fund these initiatives the Cipla has added further debt on books and has
guided for increasing R&D spend in the coming quarters. Interest costs from
increased debt will also impact profits. Further, the impact of hiring at senior
management can be seen with rising staff cost, up at 12.5-13% of sales from
historical levels of 10-11%.
4
12 August 2013

Cipla
The relatively low margin business of CMSA is likely to exert pressure on
consolidated EBITDA margins. Hence, although these initiatives are long-term
positive, we believe that they will impact profitability in the medium term.
High growth in export formulations to be driven by CMSA
Domestic Formulations to report moderate growth
Source: Company, MOSL
EBITDA margins to come under pressure going forward
EBITDA (INR m)
23.3%
19.8%
24.5%
23.6%
EBITDA Margin
26.5%
20.9%
22.9%
22.4%
FY08
FY09
FY10
FY11
FY12
FY13
FY14E
FY15E
Source: Company, MOSL
Dymista opportunity – 1Q sales at USD6m, will take time to scale-up
Cipla’s Swedish partner, Meda, had received final US FDA approval for Dymista
in May-12. Dymista is a nasal spray and consists of a combination of Azelastine
HCl and Fluticasone Proprionate and is useful in treating seasonal allergic
rhinitis. It reduces the quantum of allergy medicines that a patient needs to
consume and offers better efficacy compared to traditional first-line treatments.
The US patent office has issued two patents for Dymista expiring in 2023 and
2026.
Cipla is a development-cum-manufacturing partner for Meda for Dymista. The
partnership covers many markets including US. Cipla recently started supplies to
support the US sales and Meda is expected to launch the product in the
European market within the next two quarters.
A few reports indicate that Dymista can generate annual revenues of USD350m
in US by 2016 for Meda. Cipla is likely to benefit as it will be supplying the global
requirements for Dymista including that for the US. While this may not entail
any significant upside in the near term for Cipla (management has guided it
expects it to be a USD25-30m revenue opportunity over the next few years), we
view it as a long-term positive for Cipla.
5
12 August 2013

Cipla
Valuation and view
Cipla has posted a healthy 18% sales growth and 300bps YoY EBITDA margin
expansion in FY13, which was significantly aided by one-off Lexapro supplies to
Teva. Factors driving performance in 1QFY14 are also non-recurring in nature.
The coming quarters will be challenging for Cipla due to the impact from new
pricing policy and increasing pressure on profitability due to rising manpower,
R&D and interest costs. This can be also explained by the 14-15% organic growth
guidance for FY14E, despite a 26% growth in 1Q alone. As such, we expect some
moderation in growth and profitability over the coming quarters.
Post 1QFY14 earnings, we upgrade our EPS estimates for FY14E/15E by 4%. This
factors benefit from Cipla Medpro acquisition, which is partially offset by
expected negative impact of DPCO 2013.
We estimate core EPS of INR18.8 for FY14E (up 15% YoY) and INR21.2 for FY15E
(up 13% YoY). Based on our revised estimates, the stock trades at 22.1x FY14E
and 19.5x FY15E earnings. We maintain
Neutral
with revised target price of
INR425 (20x FY15E EPS), 3% upside.
12 August 2013
6

Cipla
Cipla: an investment profile
Company description
Cipla is the largest player in the domestic formulations
market and has a presence across most therapeutic
areas. The company also has robust exports to several
markets including US, Europe, South Africa, Australia
and the Middle East. Cipla's strategy for regulated
markets (Europe and US) exports is built around supply
tie-ups with global players.
Recent developments
NA
Valuation and view
Key investment arguments
Strong capex of past years yet to be fully utilized – a
long-term positive.
Commencement of exports of CFC free inhalers to
Europe will be a key positive; Cipla has the third
largest capacity of inhalers in the world and could
be a key beneficiary of the unfolding opportunity in
the long-term.
Cipla has posted a healthy 18% sales growth and
300bps YoY EBITDA margin expansion in FY13,
which was significantly aided by one-off Lexapro
supplies to Teva. Factors driving performance in
1QFY14 are also non-recurring in nature.
Management has retained its 14-15% organic
growth guidance for FY14E, despite a 26% growth in
1Q alone. As such, we expect some moderation in
growth and profitability over the coming quarters.
Stock trades at 22.1x FY14E and 19.5x FY15E
earnings. Maintain
Neutral
with TP of INR425.
Sector view
Key investment risks
NPPA liability of INR16b (if it materializes) could
result in a significant one-time cash outflow.
The new pharmaceutical policy (proposed) has
raised uncertainties regarding pricing of drugs in
India. Further clarity on this is awaited.
Cipla is planning to establish front-ends in some of
the key markets - this could involve upfront
investments and long gestation.
Differentiated portfolio in US and Emerging markets
would remain the key sales and profit drivers in the
medium term. Japan is expected to emerge as the
next growth driver, particularly for companies with
a direct marketing presence.
We are overweight on companies that are towards
the end of the investment phase, with benefits
expected to start coming in from the next fiscal.
Comparative valuations
Cipla
P/E (x)
P/BV (x)
EV/Sales (x)
FY14E
FY15E
FY14E
FY15E
FY14E
FY15E
22.1
19.5
3.3
2.9
3.4
3.0
14.9
13.1
DRL
20.6
18.1
4.2
3.5
2.9
2.9
13.4
11.7
Ranbaxy
22.5
18.3
2.1
1.8
1.3
1.1
11.0
7.5
EPS: MOSL forecast v/s consensus (INR)
MOSL
Forecast
FY14
FY15
18.8
21.2
Consensus
Forecast
19.7
22.9
Variation
(%)
-4.7
-7.5
Target price and recommendation
Current
Price (INR)
415
Target
Price (INR)
425
Upside
(%)
2.4
Reco.
Neutral
EV/EBITDA (x) FY14E
FY15E
Shareholding pattern (%)
Jun-13
Promoter
Domestic Inst
Foreign
Others
36.8
10.8
27.7
24.7
Mar-13
36.8
10.2
28.0
25.0
Jun-12
36.8
16.2
21.6
25.4
Stock performance (1-year)
12 August 2013
7

Cipla
Financials and valuation
12 August 2013
8

Cipla
NOTES
12 August 2013
9

Disclosures
This report is for personal information of the authorized recipient and does not construe to be any investment, legal or taxation advice to you. This research report does not constitute an offer, invitation or
inducement to invest in securities or other investments and Motilal Oswal Securities Limited (hereinafter referred as MOSt) is not soliciting any action based upon it. This report is not for public distribution
and has been furnished to you solely for your information and should not be reproduced or redistributed to any other person in any form.
Unauthorized disclosure, use, dissemination or copying (either whole or partial) of this information, is prohibited. The person accessing this information specifically agrees to exempt MOSt or any of its
affiliates or employees from, any and all responsibility/liability arising from such misuse and agrees not to hold MOSt or any of its affiliates or employees responsible for any such misuse and further agrees
to hold MOSt or any of its affiliates or employees free and harmless from all losses, costs, damages, expenses that may be suffered by the person accessing this information due to any errors and delays.
The information contained herein is based on publicly available data or other sources believed to be reliable. While we would endeavour to update the information herein on reasonable basis, MOSt and/or
its affiliates are under no obligation to update the information. Also there may be regulatory, compliance, or other reasons that may prevent MOSt and/or its affiliates from doing so. MOSt or any of its
affiliates or employees shall not be in any way responsible and liable for any loss or damage that may arise to any person from any inadvertent error in the information contained in this report. MOSt or any
of its affiliates or employees do not provide, at any time, any express or implied warranty of any kind, regarding any matter pertaining to this report, including without limitation the implied warranties of
merchantability, fitness for a particular purpose, and non-infringement. The recipients of this report should rely on their own investigations.
Cipla
This report is intended for distribution to institutional investors. Recipients who are not institutional investors should seek advice of their independent financial advisor prior to taking any investment decision
based on this report or for any necessary explanation of its contents.
MOSt and/or its affiliates and/or employees may have interests/positions, financial or otherwise in the securities mentioned in this report. To enhance transparency, MOSt has incorporated a Disclosure of
Interest Statement in this document. This should, however, not be treated as endorsement of the views expressed in the report.
Disclosure of Interest Statement
1. Analyst ownership of the stock
2. Group/Directors ownership of the stock
3. Broking relationship with company covered
4. Investment Banking relationship with company covered
CIPLA LTD
No
No
No
No
Analyst Certification
The views expressed in this research report accurately reflect the personal views of the analyst(s) about the subject securities or issues, and no part of the compensation of the research analyst(s) was, is,
or will be directly or indirectly related to the specific recommendations and views expressed by research analyst(s) in this report. The research analysts, strategists, or research associates principally
responsible for preparation of MOSt research receive compensation based upon various factors, including quality of research, investor client feedback, stock picking, competitive factors and firm revenues.
This report is not directed or intended for distribution to or use by any person or entity resident in a state, country or any jurisdiction, where such distribution, publication, availability or use would be contrary
to law, regulation or which would subject MOSt & its group companies to registration or licensing requirements within such jurisdictions.
Regional Disclosures (outside India)
This report is intended for distribution only to persons having professional experience in matters relating to investments as described in Article 19 of the Financial Services and Markets Act 2000 (Financial
Promotion) Order 2005 (referred to as "investment professionals"). This document must not be acted on or relied on by persons who are not investment professionals. Any investment or investment activity
to which this document relates is only available to investment professionals and will be engaged in only with such persons.
For U.K.
Motilal Oswal Securities Limited (MOSL) is not a registered broker - dealer under the U.S. Securities Exchange Act of 1934, as amended (the"1934 act") and under applicable state laws in the United
States. In addition MOSL is not a registered investment adviser under the U.S. Investment Advisers Act of 1940, as amended (the "Advisers Act" and together with the 1934 Act, the "Acts), and under
applicable state laws in the United States. Accordingly, in the absence of specific exemption under the Acts, any brokerage and investment services provided by MOSL, including the products and services
described herein are not available to or intended for U.S. persons.
This report is intended for distribution only to "Major Institutional Investors" as defined by Rule 15a-6(b)(4) of the Exchange Act and interpretations thereof by SEC (henceforth referred to as "major
institutional investors"). This document must not be acted on or relied on by persons who are not major institutional investors. Any investment or investment activity to which this document relates is only
available to major institutional investors and will be engaged in only with major institutional investors. In reliance on the exemption from registration provided by Rule 15a-6 of the U.S. Securities Exchange
Act of 1934, as amended (the "Exchange Act") and interpretations thereof by the U.S. Securities and Exchange Commission ("SEC") in order to conduct business with Institutional Investors based in the
U.S., MOSL has entered into a chaperoning agreement with a U.S. registered broker-dealer, Motilal Oswal Securities International Private Limited. ("MOSIPL"). Any business interaction pursuant to this
report will have to be executed within the provisions of this chaperoning agreement.
The Research Analysts contributing to the report may not be registered /qualified as research analyst with FINRA. Such research analyst may not be associated persons of the U.S. registered broker-
dealer, MOSIPL, and therefore, may not be subject to NASD rule 2711 and NYSE Rule 472 restrictions on communication with a subject company, public appearances and trading securities held by a
research analyst account.
For U.S.
Motilal Oswal Capital Markets Singapore Pte Limited is acting as an exempt financial advisor under section 23(1)(f) of the Financial Advisers Act(FAA) read with regulation 17(1)(d) of the Financial
Advisors Regulations and is a subsidiary of Motilal Oswal Securities Limited in India. This research is distributed in Singapore by Motilal Oswal Capital Markets Singapore Pte Limited and it is only directed
in Singapore to accredited investors, as defined in the Financial Advisers Regulations and the Securities and Futures Act (Chapter 289), as amended from time to time.
In respect of any matter arising from or in connection with the research you could contact the following representatives of Motilal Oswal Capital Markets Singapore Pte Limited:
Kadambari Balachandran
Email : kadambari.balachandran@motilaloswal.com
Contact: (+65) 68189233 / 65249115
Office address: 21 (Suite 31), 16 Collyer Quay, Singapore 049318
For Singapore
Motilal Oswal Securities Ltd
12 August 2013
Motilal Oswal Tower, Level 9, Sayani Road, Prabhadevi, Mumbai 400 025
Phone: +91 22 3982 5500 E-mail: reports@motilaloswal.com
10