Metals Weekly
16 September 2013
Metals Weekly
Valuations: Indian companies
Price
EV/EBITDA P/BV
(INR) FY14E FY15E FY14E
Steel
Tata Steel
298
SAIL
49
JSW Steel
632
JSPL
241
NMDC
125
Non-ferrous
Hindalco
112
Sesa-Sterlite 187
HZL
126
Nalco
33
Rain Industries 37
6.2
7.5
6.3
8.4
4.1
7.9
6.1
4.1
4.1
4.8
6.4
10.0
5.9
6.1
4.1
6.5
5.3
3.5
4.1
4.0
1.3
0.5
0.9
1.1
1.6
1.0
0.7
1.4
0.7
0.4
TMT- Mumbai (INR/ton)
HRC- Mumbai (INR/ton)
HRC (USD/ton) fob CIS
Metal Prices
CMP
16-Sep
35,300
40,128
545
%
1
-2
0
2
0
0
0
-3
-2
-4
0
-2
-4
0
-2
-5
-2
-4
-7
-4
0
Week
9-Sep
34,900
41,072
548
20,300
25,000
136
240
365
1,780
117
5,364
1,868
122
986
Quarter
%
1-Jul
8 32,600
16 34,673
7
510
9 19,000
1 24,800
15
117
9
220
2
347
1
7
-2
1
7
-7
1,731
104
5,436
1,823
109
1,061
6,750
402
666
YTD FY13
% 1-Apr
1 34,900
10 36,565
-4
565
5
3
-2
-9
-8
-7
9
2
-2
15
-16
-7
10
1
2
-6
-1
-3
19,800
24,200
138
265
385
1,881
102
5,228
1,870
102
1,171
7,582
408
571
29,526
52,621
2,094
1.03
Sponge iron - Raipur (INR/ton)
20,700
Pig iron - Raipur (INR/ton)
25,000
Iron ore spot (USD/ton) cfr China
135
Coke (USD/ton) fob
240
Shred. scrap (USD/ton) Rotterdam
355
LME Spot (USD/ton)
Indian prices (INR ‘000/ton)
LME inventories (‘000 ton)
LME Spot (USD/ton)
Indian prices (INR ‘000/ton)
LME inventories (‘000 ton)
LME Spot (USD/ton)
Indian prices (INR ‘000/ton)
LME inventories (‘000 ton)
1,747
111
5,348
1,833
117
983
7,028
451
578
Note: Detailed table on pg 23
Source: MOSL
Valuations: Global companies
Price
Mining
BHP
AUD 36.2
FMG
AUD 4.6
Rio Tinto AUD 63.1
Vale
USD 33.1
Teck Res. USD 27.1
Steel
A. Mittal EUR 10.5
Posco
k KRW 327
US Steel USD 19.9
Nucor
USD 48.3
JFE
JPY 2595
Gerdau
BRL 17
Bao Steel CNY 4.5
Non-ferrous
Alcoa
USD 8.1
Norsk Hyd. NOK 25.0
Rusal
HKD 2.3
Detailed on pg 23
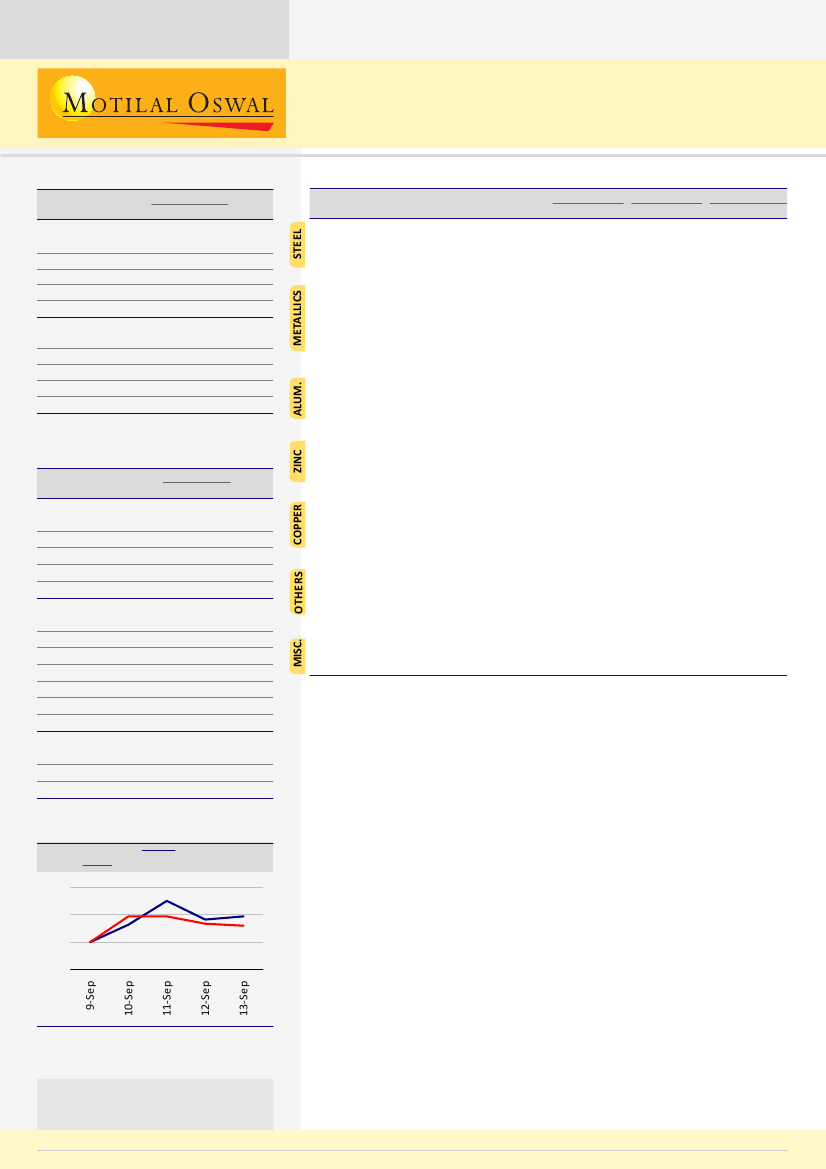
BSE Metals Index
Sensex
108
104
100
96
EV/EBITDA
CY13 CY14
6.7
4.4
6.6
5.2
6.8
6.5
5.6
7.9
12.1
7.7
9.5
7.2
6.2
4.2
5.9
5.2
6.2
5.4
5.1
5.3
7.4
6.9
7.4
6.4
P/BV
CY13
2.3
1.7
2.1
1.0
0.9
0.5
0.7
0.9
2.0
0.9
1.1
0.8
7,170
4
474 12
588 -13
31,326
53,587
2,151
1.00
Gold (INR/10gms)
30,020
Sliver (INR/1kg)
49,572
Lead Spot LME (USD/ton)
2,063
FC 6-8% C basis 60% Cr (USD/lb Cr) 1.00
INR/USD
BDI
16 25,778
23 40,408
0 2,058
1
0.99
62.8 -2
64.1
5
59.6
15
54.5
1,636 11
1,478 40 1,171
80
910
Source: Metal Bulletin, Bloomberg, Steel Mint, MOSL
Indian steel prices improve but global steel and LME were down
Indian long steel product prices e.g. TMT (Mumbai) increased 1.1% WoW.
7.6
6.7
0.7
9.1
7.3
0.7
16.5 15.4
0.4
Source: Bloomberg
BSE Metals Index v/s Sensex
Source: Bloomberg
Note: Indexed to 100 on 9 September 2013
Stock performance table on pg 24
Investors are advised to refer through
disclosures made at the end of the
Research Report.
Sponge iron increased 2% WoW to INR20,700, while Pellet prices
increased INR200/t WoW to INR7,300/t. India flat product prices i.e. HRC
(Import parity, Mumbai) decreased by 2.3% WoW, however with shift
from import parity to export parity, these prices are less relevant
temporarily. Export parity price is INR34,147/t.
Steel prices decreased by 1%, 0.5% and 1% WoW respectively in China,
CIS and N. America while prices were flat WoW in Turkey.
Iron ore prices(63.5% Fe CFR China) decreased 0.4% WoW to USD135/t,
while Coking coal prices (Premium Low volatile, Fob Australia) were
flat WoW at USD151/t.
Base metals prices decreased 2-4% WoW with Aluminum, Copper, Zinc
and Lead decreasing 2%, 2%, 2% and 4% WoW respectively. Aluminum
US spot premium has been on declining trend correcting 2.4% WoW,
which is down ~USD35/t from their peak of USD261/t in August. Some
Major Japan Ports (MJP) aluminum premiums deals have been settled
at USD245-247/t which is a decline of USD3-5/t QoQ.
Sanjay Jain
(SanjayJain@MotilalOswal.com); Tel:+91 22 3982 5412
16 September
22 3982 5413
Pavas Pethia
(Pavas.Pethia@MotilalOswal.com); Tel:+91
2013
1