30 September 2013
Update | Sector: Cement
Ambuja Cements
BSE Sensex
19,380
S&P CNX
5,735
CMP: INR184
TP: INR188
Neutral
Synergy benefits can drive up to 14% EPS upgrade
Structure reduces equity dilution, increases EPS accretion
Stock Info
Bloomberg
Equity Shares (m)
52-Week Range (INR)
1, 6, 12 Rel. Per (%)
M.Cap. (INR b)
M.Cap. (USD b)
ACEM IN
1,544.9
221/148
6/2/-15
284.4
4.6
Proposed restructuring is value neutral for Ambuja Cements (ACEM), ex synergies
and hold-co discount. Cash usage limits equity dilution, and offers better upside
once benefits of synergies start percolating.
Synergies of INR7.8b-9b (8-10% cost savings) are likely to support profitability (4-
14% EPS accretion in CY14/CY15) and dilute our concerns over gradual decline in
subsidy benefits post CY15. We expect synergies of 20%/50% in CY14/CY15.
Balance sheet is likely to remain self-sustaining, despite usage of cash for stake
purchase. We expect net cash to reduce from ~INR35b in CY14 pre-deal
(standalone) to ~INR27b in CY14 post-deal (consolidated).
Financials & Valuation
Y/E March
Sales
EBITDA
NP
Adj. EPS (INR)
EPS Gr. (%)
BV/Sh. (INR)
RoE (%)
RoCE (%)
Payout (%)
Valuations
P/E (x)
P/BV (x)
EV/EBITDA (x)
EV/Ton (USD)
(INR b)
2013 2014E 2015E
96.7 94.6 109.3
24.7
15.4
10.0
23.1
56.9
18.3
27.6
49.8
18.4
3.2
9.7
138
18.7
12.8
8.3
1.1
61.4
14.0
20.2
51.3
22.3
3.0
12.9
135
24.3
16.7
10.8
8.3
67.0
16.9
24.2
48.3
17.0
2.8
9.7
127
While investors are concerned about hold-co discount for ACEM’s stake in ACC, we
believe ACC’s higher payout and operating control by Ambuja may off-set concerns
pertaining to normal hold-co structure.
We are yet to factor in for this deal and resultant synergies. However, based on
our preliminary estimates, ACEM trades at 8.9x CY14E EV/EBITDA and EV/ton of
USD111. Maintain Neutral, with a revised target price of ~INR188.
Restructuring fair at valuations for ACEM
Holcim’s restructuring transaction, in our view, proposes at-par valuation for
ACEM (ex INR9b of guided synergy benefits and hold-co discount). Cash usage in
deal structure limits equity dilution. Compared to an all-share deal, it is EPS
decretive immediately, but offers better upside, once benefits of synergies and
up-cycle start percolating.
Price as on 27 Sep 2013
Shareholding pattern %
As on
Promoter
Dom. Inst
Foreign
Others
Jun-13 Mar-13 Jun-12
50.6
10.2
32.0
7.3
50.6
8.6
33.5
7.4
50.2
12.4
29.9
7.5
Balance sheet remains self-sustaining despite cash usage
We expect ACEM’s balance sheet to remain self-sustaining, despite INR35b cash
outgo, as a net debt situation will arise only if ACEM goes for additional 10%
stake purchase in ACC. We expect net cash to reduce from ~INR35b in CY14 pre-
deal (standalone) to ~INR27b in CY14 post-deal (consolidated).
Synergies to drive profitability, potential ~14% EPS upgrade in CY15
The management expects to derive INR7.8b-9b of synergy benefits (8-10% cost
savings) comprising (1) INR3.5b-4b from supply chain optimization (cement and
clinker swap), and (2) INR4.5b-5b from shared services, procurement and fixed
cost reduction. The benefits would accrue over the next 2-3 years and would
offset gradual reduction in subsidy, driving 5%/4% EPS accretion in CY14/CY15
(after factoring impact of cash outgo). We expect material swap to also (a)
enable volume synergies by lowering regional capacity constraints, and (b)
improve market mix by expanding reach. We are factoring in for synergy benefits
of 20%/50% in CY14/CY15; entire benefits would accrue only in CY16.
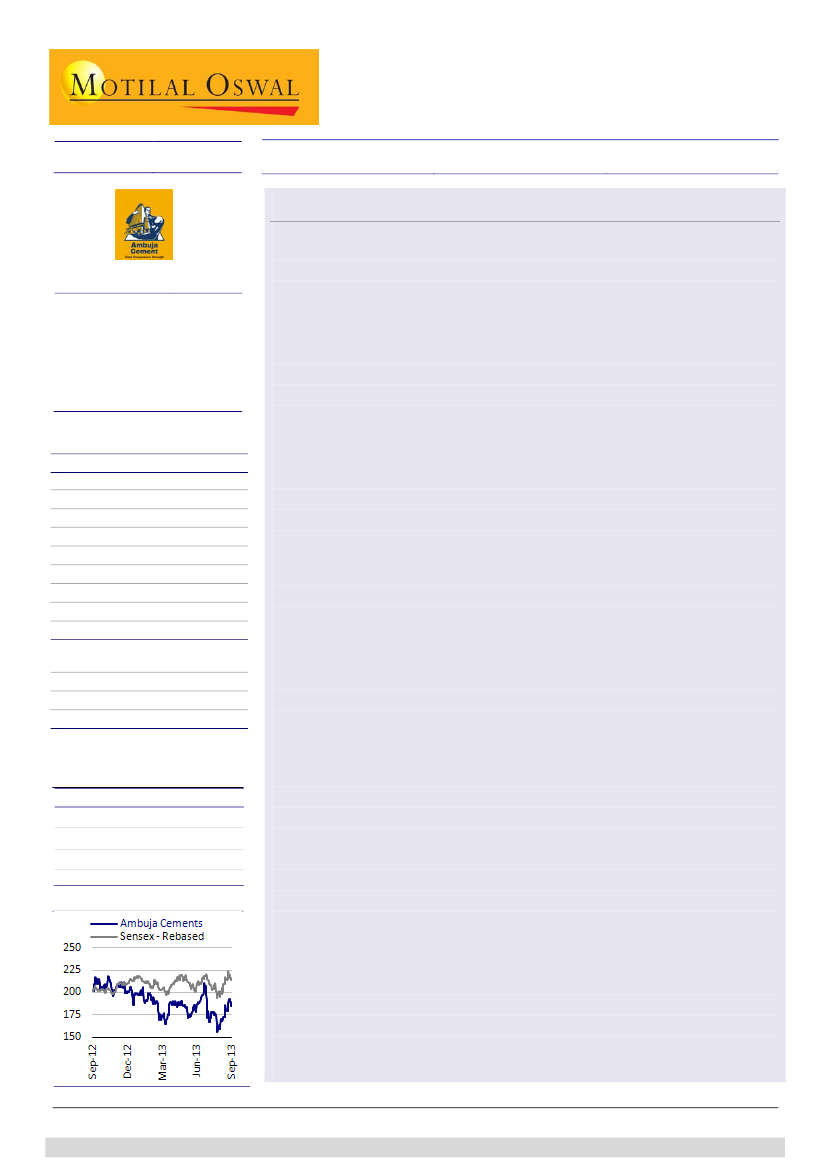
Stock Performance (1-year)
Jinesh Gandhi
(Jinesh@MotilalOswal.com); +91 22 3982 5416
Sandipan Pal
(Sandipan.Pal@MotilalOswal.com); +91 22 3982 5436
Investors are advised to refer through disclosures made at the end of the Research Report.

Ambuja Cements
Synergies priced in at current valuations; maintain Neutral
We are yet to factor in for this deal and resultant synergies, and await further
clarity over the timeline and magnitude of the same. While investors are
concerned about hold-co discount for ACEM’s stake in ACC, we believe ACC’s
higher payout and operating control by Ambuja may off-set concerns pertaining
to normal hold-co structure. ACEM trades at 8.9x CY14E EV/EBITDA and EV/ton
of USD111. Maintain
Neutral
with a revised target price of INR188 (9x CY14E
EV/EBITDA, assuming 20% synergy benefits and no hold-co discount).
Use of cash optimizes EPS accretion vis-à-vis all-share deal
CY13E
Current
CY14E
CY15E
CY13E
8.24
8.27
-0.4
8.2
-0.4
All Share deal
CY14E
CY15E
11.0
10.8
1.8
11.5
6.0
13.6
13.2
2.8
14.7
11.4
EPS impact ex-synergy benefits
EPS (INR/sh)
9.0
11.5
13.8
Pre-deal EPS (INR/sh)
8.3
10.8
13.2
Accretion (%)
8.9
6.5
4.6
Assuming 20%/50% of target synergy benefits of INR9b in CY14E/15E
EPS (INR/sh)
9.0
12.0
15.1
Accretion (%)
8.9
11.1
13.9
* Assuming cash outflow of ~INR35b for purchase of Holcim India 24% stak e happens in Jul-14
Estimate post-deal CY14E-based target price at INR175/share (including synergies)
INR m
Without synergies
S/A EBITDA
Target EV/EBITDA (x)
EV
Less: Net Debt (adj CWIP)
Add: ACC's value
Total Equity Value (INR m)
Equity shares (mn)
TP (INR/sh) w/o synergies
With synergies
S/A EBITDA
Target EV/EBITDA (x)
EV
Less: Net Debt (adj CWIP)
Add: ACC's value
Total Equity Value (INR m)
Equity shares (mn)
TP (INR/sh) with synergies
CY13E
18,673
9
168,060
-45,362
87,135
300,557
1978
152
18,673
9
168,060
-45,362
87,135
300,557
1978
152
CY14E
24,285
9
218,569
-18,695
122,090
359,354
1978
182
25,185
9
226,669
-18,695
126,141
371,505
1978
188
CY15E
29,037
9
261,333
-34,043
139,907
435,283
1978
220
31,287
9
281,583
-34,043
150,034
465,660
1978
235
Source: Company, MOSL
30 September 2013
2

Ambuja Cements
Transaction at par ex synergyies, holdco discount
Use of cash limits dilution, balance sheet to remain self-sustaining
Holcim’s restructuring transaction, in our view, is neutral for ACEM (ex INR9b of
guided synergy benefits and hold-co discount).
Cash usage in deal structure limits equity dilution, and optimizes upside once the
benefits of synergies and up-cycle start percolating. Synergies can drive up to ~14%
EPS upgrade.
Balance sheet would remain self-sustaining despite INR35b cash usage. We expect net
cash to reduce from ~INR35b in CY14 pre-deal (standalone) to ~INR27b in CY14 post-
deal (consolidated).
The deal that rejigged Holcim India’s structure
ACEM and Holcim India to
merge; ACEM becomes
hold-co for ACC
Holcim (ACC and ACEM’s parent) has announced major restructuring of its India
operations, which includes:
Merger of its 100% subsidiary, Holcim India with ACEM
Transfer of Holcim India’s 50.01% stake in ACC to ACEM, making ACEM the
holding company of ACC
Acquisition of Holcim India’s 50.01% stake in ACC by ACEM will take place in a
two-step process comprising:
Step I: ACEM to acquire 24% stake in Holcim India for INR35b in cash
Step II: Holcim India to merge into ACEM, as ACEM will issue 584m shares to
Holcim (Parent) for remaining 76%
Holcim India’s 9.8% stake in ACEM to be cancelled
Post merger, Holcim will hold 61.39% in ACEM and ACEM will hold 50.01% in
ACC. As an implied valuation, the deal derives ACEM / ACC swap ratio of 6.6, and
Holcim India / ACEM swap ratio at 7.4.
ACEM intends to further increase its economic ownership in ACC by up to 10%
over 24 months following the transaction completion, not triggering an open
offer. In-principle approval of ACEM Board is in place for a maximum amount of
INR30b. This implies ~45% premium to current ACC share price.
How the holding structure will change
Source: Company, MOSL:
30 September 2013
3

Ambuja Cements
Deal valuation neutral to minority shareholders and parent
Based on the market price
on the transaction date,
Holcim India valuation is
estimated at INR144b and
overall Holcim holding at
INR266b…
Based on the current holding structure, Holcim’s stake in ACC and ACEM was
valued at INR145b (as per deal valuations), which is largely the consideration to
be paid in cash and ACEM equity to Holcim (parent) by ACEM.
The transaction does not have material financial impact on the valuation of
Holcim’s India holdings or minority shareholders.
However, the impact on ACEM’s valuation would be a function of hold-co
discount ascribed by the market to its 50.01% stake in ACC. Otherwise, we
believe the deal is proposed at fair valuations (0% hold-co discount).
What Holcim used to hold in ACC and ACEM through Holcim India and directly
Market cap
(INR b)*
231
296
296
231
Holcim India
stake
50.0%
9.8%
40.8%
0.3%
Value
(INR b)
115.5
28.9
144.4
120.7
0.7
121.3
265.8
ACC
ACEM
Valuation of Holcim India
ACEM
ACC
Direct holding
Holcim (Parent) valuation of India assets
* Based on CMP on 24th July-13
…and that is what ACEM is
paying to Holcim to get
Holcim India merged
Consideration of INR145b
(in cash + equity) for Holcim India has been at par
STEP 1 - Purchase of 24% stake in Holcim India
Cash Outflow (INR b)
35
Total valuation of Holcim India
144
Implied value of 24% stake
35
STEP 2 - Purchase of 76% stake in Holcim India
Shares Issued to Holcim (m)
584.4
CMP
189
Implied value of 76% stake
110
Total consideration
145
Source: Company/MOSL
Transaction impact
Holcim: No valuation impact – transaction at par
ACEM: At par assuming no holding company discount
30 September 2013
4

Ambuja Cements
ACC stake acquisition at relatively reasonable valuations
157
130
97
Valuation (USD/Ton)
Capacity (MT)
30.7
124
115
10.9
1.5
2.4
4.8
JP Gujarat -
UltraTech
ACC - Ambuja
Adhunik - Dalmia Lafarge - Barings PE Shri Jayajothi - CRH
Source: Company, MOSL
Use of cash limits dilution, allowing higher EPS accretion due to synergies
Synergy and up-cycle
benefits to percolate better
in current deal structure
versus all-equity deal
We consider the proposed deal structure to be prudent as use of cash payment
of INR35b would limit the equity dilution to 22% v/s potential dilution of 28.6%
in case of all-equity deal. Moreover, yield on cash of ~8% (as at CY12) is lower
than cost of equity.
Cash usage in deal structure limits equity dilution, and optimizes upside once
benefits of synergies and up-cycle start percolating. Synergies can drive up to
~14% EPS upgrade (v/s 11% upgrade in all-equity deal).
Use of cash optimizes EPS accretion vis-à-vis all-share deal
Proposed deal format to
outpace all-share deal in
terms of EPS accretion in
CY15 (with synergies)
CY13E
Current
CY14E
CY15E
All Share deal
CY13E
CY14E
CY15E
8.24
8.27
-0.4
8.2
-0.4
11.0
10.8
1.8
11.5
6.0
13.6
13.2
2.8
14.7
11.4
EPS impact ex-synergy benefits
EPS (INR/sh)
9.0
11.5
13.8
Pre-deal EPS (INR/sh)
8.3
10.8
13.2
Accretion (%)
8.9
6.5
4.6
Assuming 20%/50% of target synergy benefits of INR9b in CY14E/15E
EPS (INR/sh)
9.0
12.0
15.1
Accretion (%)
8.9
11.1
13.9
* Assuming cash outflow of ~INR35b for purchase of Holcim India 24% stak e happens in Jul-14
Source: Company, MOSL
Balance sheet (ex synergies) remains self-sustaining despite cash outgo
Post restructuring, ACEM’s balance sheet strength should see interim
deterioration on account of INR35b cash outgo for Holcim India’s 24% stake.
We expect ACEM to generate operating cash flow (OCF) of INR60b+, which
would be sufficient to drive ongoing capex (including Nagaur Plant) of ~INR40b
over CY13-15. Our estimate doesn’t factor in benefits derived from synergies.
On standalone basis, we estimate ACEM to remain net cash of ~INR12b/INR18b
in CY14/CY15, after factoring in for cash outflow of ~INR35b for purchase of
Holcim India’s stake in July 2014. Even if it goes for additional 10% stake
purchase in ACC from CY15 onwards for a maximum amount of ~INR15b per
year in CY15/CY16, it will remain net cash at ~INR3b in CY15.
On consolidated basis (pro-rata for 50% stake in ACC), we estimate ACEM’s net
cash to reduce from ~INR42b (pre-deal) to ~INR26.6b in CY14.
30 September 2013
5

Ambuja Cements
ACEM’s standalone balance sheet to remain strong (ex synergies)
ACEM’s healthy OCF
enables net cash position in
balance sheet despite
organic and inorganic
growth
INR B
Bengining cash balance
OCF
ACC dividend
Capex
Restructuring outgo
Dividend outgo
Y/E cash balance
Additonal 10% ACC stake purchase
Y/E cash balance
CY13E
38.7
15.3
3.1
-7.0
-7.2
42.9
42.9
CY14E
42.9
21.6
3.3
-13.0
-35.0
-8.1
11.7
11.7
CY15E
11.7
26.3
3.8
-14.8
-9.0
18.0
-15
3.0
Source: Company, MOSL
ACEM’s consolidated cash position (pro-rata, ex synergies)
INR B
Bengining cash balance
OCF
Capex
Restructuring outgo
Dividend outgo
ACC dividend income
ACC dividend outgo
Y/E cash balance
Additonal 10% ACC stake purchase
Y/E cash balance
CY13E
54.4
23.3
-12.5
-7.2
3.1
-3.6
57.5
57.5
CY14E
57.4
32.8
-20.0
-35.0
-8.1
3.3
-3.8
26.6
CY15E
26.6
39.7
-21.0
-9.0
3.8
-4.4
35.7
-15
26.6
20.7
Source: Company, MOSL
ACEM’s balance sheet to remain net cash (INR b)
Source: Company, MOSL
30 September 2013
6

Ambuja Cements
Synergies to drive profitability
Reduction in subsidies to be offset by synergy benefits
Management expects to derive INR7.8b-9b of synergy benefits (8-10% cost savings).
Synergies include (1) supply chain optimization of INR3.5b-4b (cement and clinker
swap), and (2) INR4.5b-5b by shared services, procurement and fixed cost reduction.
Benefits would accrue over the next 2-3 years and drive EPS accretion of 5%/14% in
CY14/CY15. Over the long term, synergy benefits would offset the reduction in
government subsidies from CY17 onwards.
We expect material swap to also (a) unleash volume synergies by lowering regional
capacity constraints, and (b) improve market mix by expanding reach.
Synergies to drive meaningful cost savings
The management expects the transaction to drive meaningful synergy benefits of
INR8b-9b to be achieved within two years of completion of the transaction. The
synergy benefits are almost equally attributable to ACC and ACEM. These include:
Supply chain optimization: INR3.5b-4b
Fixed cost reduction and procurement: INR4.5b-5b
The management expects the benefits of supply chain optimization to percolate
sooner than the benefits of fixed cost optimization, which may take 2-3 years. We
have factored in for 20%/50%/100% benefits of targeted synergies in CY14/15/16.
Restructuring opens up scope for synergy benefits of INR7.8b-9b
INR7.8b-9b of synergy
benefits would require 2-3
years to percolate and
would be equally
distributed between ACC
and ACEM
Supply Chain
optimization
INR3.1-3.3b
INR0.5-0.6b
INR1.5-1.7b
INR2.7-3b
INR0.1b
INR7.8-9b
Fixed cost
optimization
Cement swaps Clinker swaps
and logistics
Procurement
Fixed cost
reduction
Shared Services Total Synergies
Source: Company, MOSL
Key aspects of supply chain
benefits comprise lower
freights, lower cost of kiln
and better service level
Supply chain optimization
Supply chain optimization would be targeted through five layers of synergies: (a)
lead distance reduction, (b) cement/clinker swaps, (c) optimize production from
lowest cost kilns, (d) shared assets at hubs, and (e) servicing high contribution
areas by lowest cost plant. Cement/clinker swaps are key to optimization of
supply chain and include the following swaps based on initial assessment:
Clinker swaps with two ACC plants supplying clinker to two ACEM units.
Clinker swaps with two ACEM plants supplying to four ACC units.
Cement swaps with 13 ACEM plants supplying in parts of 21 states for ACC.
Cement swaps with 10 ACC plants supplying in parts of 16 states for ACEM.
30 September 2013
7

Ambuja Cements
These initiatives should help to reduce cost to serve by 8-10% of per ton of
freight cost, lead distance reduction and service level improvement. We expect
material swap to also (a) unleash volume synergies by lowering regional capacity
constraints, and (b) improve market mix by expanding reach.
Scope of fixed cost
reduction hinges on
standardization, improving
efficiencies, sharing back-
end, and power of negation
on procurements
Shared services and fixed cost reduction
Benefit from economies of scale in procurements, improvement in efficiencies,
and common utility of back-end services, as follows:
Integrated procurement through (1) process standardization and
centralization, (2) vendor consolidation – global / regional / local, and (3)
service cost reduction and negotiation.
Improve effectiveness and efficiency through fixed cost reduction: (1)
achieving 85% of global benchmark in plants, (2) reduction in overall fixed
cost by 5-6% in the fields of operations, administration, management and
third party / outsourcing costs.
Expand on existing IT model to join transactional backend processes, and
HR, Commercial and Finance functions.
Comparative regional advantage may enable volume synergies
Cross-company clinker/cement swap could (a) curb the regional capacity
constraints of ACC and ACEM by compensating through unutilized capacity of
the other, and (b) increase overall market reach and dispatch volumes by
releasing supply from capacities in proximity (refer illustrative examples on page
9 and 10). ACC’s high utilization and no expansion plan in the North would be
offset by ACEM’s relatively lower utilization and expansion plan in the region.
Similarly, ACEM’s high utilization in Gujarat can be supported by ACC’s Wadi
plant while catering to the western parts of Maharashtra. Better market reach
may lead to higher incremental volumes in the South and North-East.
Pricing synergy and market reach augmentation
ACC-ACEM’s combined market share should enable better command on pricing,
though the management has repeatedly hinted about competitive operations
between the two entities. Additionally, as each one increases market reach due
to complementary capacities of the other (grinding units, terminal etc), we
expect overall improvement in market mix towards better pricing zones.
Clinker and cement swap
strategy will reduce lead
distance and may result in
volume synergies by
expanding market reach
Swap strategy will improve
market mix and may lead to
better realizations
30 September 2013
8

Ambuja Cements
Fixed cost synergies focused on improving efficiencies and driving economies of scale
Staff Cost (INR/ton of capacity)
193
144
382
171
188
187
201
598
469
602
Other Expenses (INR/ton of capacity)
659
715
MCEM
SRCM ^
ACEM
UTCEM *
ACC +
ACEM
ACC
MCEM
SRCM ^
ACEM
UTCEM *
ACC +
ACEM
ACC
^ incl Merchant Power; * incl White Cement & RMC
Source: Company, MOSL
Capacity map of ACEM and ACC: Various location advantages
A few illustrative examples highlighting possible synergy benefits
We have analyzed some logistics benefits ACEM may derive through clinker and
cement swap with ACC, based on their plant locations and our understanding of the
current dispatching zones of these plants.
30 September 2013
9

Ambuja Cements
Dadri grinding (ACEM) would get clinker supply from Lakheri Western MP market would be catered better by Lakheri (ACC)
plant (ACC) instead of Rabriyawas (ACEM).
than Rabriyawas (ACEM), freeing up capacity for the North.
Dadri (ACEM) would free up Tikaria (ACC) capacity to focus
more on East UP and Bihar, and Chaibasa (ACC) would focus
more on West Bengal market at lower lead distance. This
should free up ACEM’s WB capacity to supply to Assam and
other North East states, and thus, enhance market reach.
Farraka and Sankrail grinding (ACEM) would get clinker from
Chaibasa and Bargarh (ACC) rather than from Bhatpara
(ACEM). Current cement supply from Chaibasa (ACC) to North
East could be done through Farraka grinding (ACEM), helping
to achieve savings on cement transportation cost.
Ambujanagar plant (ACEM) supplies cement to its Cochin Maratha plant (ACEM) may go for cement swap with Wadi
terminal and upcoming Mangalore terminal, which could be plant (ACC) to cater to West Maharashtra, and in turn focus
serviced by TN/Karnataka plants of ACC.
more on catering to East and Central Maharashtra.
Source: MOSL
):
Existing arrangement for clinker/cement supply
Red dotted line (
Blue line (
):
Potential arrangement for clinker/cement supply to reduce lead distance
30 September 2013
10

Ambuja Cements
Synergy benefits to off-set impact of gradual reduction in subsidies
Gradual decline in government subsidies has been a key overhang against
sustenance of ACEM’s profitability. ACEM enjoys ~INR4b of annual government
subsidies, which implies INR180-190/ton of EBITDA on ACEM standalone dispatches.
Existing benefit will start gradually reducing from CY17, new incentives for upcoming
capacities would dilute impact of exhaustion of existing subsidies. Further, we
believe the restructuring synergies, as quantified by the management at ~INR4.5b
for standalone ACEM (and INR5.6b-7b for consolidated ACEM) over the next 2-3
years, would be a strong cushion to offset the impact of gradual reduction in
subsidies. Lastly, Ambuja would also benefit from ‘Holcim Leadership Journey’
program which focuses on further strengthening market and cost leadership
globally, including India.
Government subsidies have been a key contributor to ACEM’s cost advantage
Subsidies from Govt (INR m)
3,730
3,200
188
174
157
Subsidies from Govt (INR/ton)
4,140
CY10
CY11
CY12
Source: Company, MOSL
Holcim Leadership Journey
In 2012, Holcim globally launched ‘Holcim Leadership Journey’ (HLJ) program to
further strengthen market and cost leadership globally, with aim to increase
operating profit by at least CHF1.5b by end CY14. The HLJ program would focus
on:
Customer excellence by improving customer focus and innovation
Cost leadership by a) increasing energy efficiency, b) use of alternate
fuels/raw materials, c) reducing logistic costs by at least 5%, d)
streamlining of procurement globally and e) fixed cost savings
Reduction in working capital and selective divestments
Reduction of the investment cost per ton of new cement capacity by up
to 20%
Further development and generation of talents and leaders as well as
strengthening of the social dialogue with all stakeholders
Ambuja and ACC are also part of the HLJ program, and would benefit from this
global drive by Holcim. It has charted out blue-print of various projects to be
undertaken, benefits of which will start coming from CY14 onwards. This program
is independent of synergies of ACC’s acquisition.
30 September 2013
11

Ambuja Cements
Synergies priced in current stock valuations
High dividend payout of ACC, ACEM to limit hold-co discount
The transaction gives ACEM a strong pan India footprint and meaningful synergy
benefits at fair valuation, and a reasonably prudent structure.
While investors are concerned about hold-co discount for ACEM’s stake in ACC, we
believe ACC’s higher payout and operating control by Ambuja may off-set concerns
pertaining to normal hold-co structure.
ACEM trades at 8.9x CY14E EV/EBITDA and EV/ton of USD107, and offers limited near-
term upside. Maintain Neutral a revised target price of INR188 (9x CY14E EV/EBITDA,
assuming 20% synergy benefits and 0% hold-co discount).
Deal is attractive…
The deal will give ACEM (and ACC) a pan India capacity footprint, with combined
capacity of 59.5m tons (ACEM’s stake: 46.7m tons) as at CY13 and 68.3m tons
(ACEM’s stake: 59.4m tons) by CY16 post completion of ACC’s Jamul
(Chhattisgarh) and ACEM’s Nagaur (Rajasthan) expansion.
As discussed in the earlier section, we believe the transaction proposes (1) at-
par valuation, (2) reasonably prudent structure, (3) does not overstress the
balance sheet, and (4) renders meaningful synergies to drive profitability.
The deal also offsets concerns over declining cost advantages due to diminishing
subsidy benefits and rise in Holcim royalty, by providing synergy benefits.
…but current stock valuations fairly factors in for the same
Pre-transaction, we valued ACEM at 9x CY14E EV/EBITDA or INR173/share. While
we believe that the transaction fairly values ACEM, the impact on valuation would
be driven by the extent of hold-co discount, if any, for its 50.01% stake in ACC.
We assume 0% hold-co discount, translating into a revised target price of INR188
(9x CY14E EV/EBITDA, assuming 20% synergy benefits). We are not yet factoring in
the synergy benefits in ACEM’s profitability, as we await further clarity on the
magnitude and timeline of the same. Our target price (post hold-co discount)
implies EV/ton of USD103 on ACEM’s effective CY14E capacity of 44.9m tons.
ACEM trades at 8.9x CY14E EV/EBITDA and EV/ton of USD107, and offers limited
near-term upside. We maintain our
Neutral
rating on the stock. Re-rating hinges
on (a) faster realization of synergy benefits, driving up profitability, and (b) faster
return of pricing power to the industry.
30 September 2013
12

Ambuja Cements
Estimate post-deal CY14E-based target price at INR188/share (including synergies)
INR m
Without synergies
S/A EBITDA
Target EV/EBITDA (x)
EV
Less: Net Debt (adj CWIP)
18,673
9
168,060
-45,362
87,135
300,557
1978
152
18,673
9
168,060
-45,362
87,135
300,557
1978
152
24,285
9
218,569
-18,695
122,090
359,354
1978
182
25,185
9
226,669
-18,695
126,141
371,505
1978
188
29,037
9
261,333
-34,043
139,907
435,283
1978
220
31,287
9
281,583
-34,043
150,034
465,660
1978
235
CY13E
CY14E
CY15E
Our revised target price of
INR188/share assumes 0%
holding company discount,
and factors in for 20%
synergy benefits in CY14
Add: ACC's value
Total Equity Value (INR m)
Equity shares (mn)
TP (INR/sh) w/o synergies
With synergies
S/A EBITDA
Target EV/EBITDA (x)
EV
Less: Net Debt (adj CWIP)
Add: ACC's value
Total Equity Value (INR m)
Equity shares (mn)
TP (INR/sh) with synergies
Source: Company, MOSL
Target price sensitivity based on holding company discount on ACC stake
Impact on ACEM valuation
hinges on holding company
discount market would like
to ascribe for ACC stake
Holding Co. Discount
0%
10%
20%
30%
40%
50%
W/O Synergies
182
176
169
163
157
151
With Synergies
188
181
175
169
162
156
Source: Company, MOSL
30 September 2013
13

Ambuja Cements
Financials and valuation
30 September 2013
14

Ambuja Cements
Financials and valuation
30 September 2013
15

Disclosures
This report is for personal information of the authorized recipient and does not construe to be any investment, legal or taxation advice to you. This research report does not constitute an offer, invitation or
inducement to invest in securities or other investments and Motilal Oswal Securities Limited (hereinafter referred as MOSt) is not soliciting any action based upon it. This report is not for public distribution
and has been furnished to you solely for your information and should not be reproduced or redistributed to any other person in any form.
Unauthorized disclosure, use, dissemination or copying (either whole or partial) of this information, is prohibited. The person accessing this information specifically agrees to exempt MOSt or any of its
affiliates or employees from, any and all responsibility/liability arising from such misuse and agrees not to hold MOSt or any of its affiliates or employees responsible for any such misuse and further agrees
to hold MOSt or any of its affiliates or employees free and harmless from all losses, costs, damages, expenses that may be suffered by the person accessing this information due to any errors and delays.
The information contained herein is based on publicly available data or other sources believed to be reliable. While we would endeavour to update the information herein on reasonable basis, MOSt and/or
its affiliates are under no obligation to update the information. Also there may be regulatory, compliance, or other reasons that may prevent MOSt and/or its affiliates from doing so. MOSt or any of its
affiliates or employees shall not be in any way responsible and liable for any loss or damage that may arise to any person from any inadvertent error in the information contained in this report. MOSt or any
of its affiliates or employees do not provide, at any time, any express or implied warranty of any kind, regarding any matter pertaining to this report, including without limitation the implied warranties of
merchantability, fitness for a particular purpose, and non-infringement. The recipients of this report should rely on their own investigations.
This report is intended for distribution to institutional investors. Recipients who are not institutional investors should seek advice of their independent financial advisor prior to taking any investment decision
based on this report or for any necessary explanation of its contents.
MOSt and/or its affiliates and/or employees may have interests/positions, financial or otherwise in the securities mentioned in this report. To enhance transparency, MOSt has incorporated a Disclosure of
Interest Statement in this document. This should, however, not be treated as endorsement of the views expressed in the report.
Disclosure of Interest Statement
1. Analyst ownership of the stock
2. Group/Directors ownership of the stock
3. Broking relationship with company covered
4. Investment Banking relationship with company covered
AMBUJA CEMENTS
No
No
No
No
Ambuja Cements
Analyst Certification
The views expressed in this research report accurately reflect the personal views of the analyst(s) about the subject securities or issues, and no part of the compensation of the research analyst(s) was, is,
or will be directly or indirectly related to the specific recommendations and views expressed by research analyst(s) in this report. The research analysts, strategists, or research associates principally
responsible for preparation of MOSt research receive compensation based upon various factors, including quality of research, investor client feedback, stock picking, competitive factors and firm revenues.
This report is not directed or intended for distribution to or use by any person or entity resident in a state, country or any jurisdiction, where such distribution, publication, availability or use would be contrary
to law, regulation or which would subject MOSt & its group companies to registration or licensing requirements within such jurisdictions.
Regional Disclosures (outside India)
This report is intended for distribution only to persons having professional experience in matters relating to investments as described in Article 19 of the Financial Services and Markets Act 2000 (Financial
Promotion) Order 2005 (referred to as "investment professionals"). This document must not be acted on or relied on by persons who are not investment professionals. Any investment or investment activity
to which this document relates is only available to investment professionals and will be engaged in only with such persons.
For U.K.
Motilal Oswal Securities Limited (MOSL) is not a registered broker - dealer under the U.S. Securities Exchange Act of 1934, as amended (the"1934 act") and under applicable state laws in the United
States. In addition MOSL is not a registered investment adviser under the U.S. Investment Advisers Act of 1940, as amended (the "Advisers Act" and together with the 1934 Act, the "Acts), and under
applicable state laws in the United States. Accordingly, in the absence of specific exemption under the Acts, any brokerage and investment services provided by MOSL, including the products and services
described herein are not available to or intended for U.S. persons.
This report is intended for distribution only to "Major Institutional Investors" as defined by Rule 15a-6(b)(4) of the Exchange Act and interpretations thereof by SEC (henceforth referred to as "major
institutional investors"). This document must not be acted on or relied on by persons who are not major institutional investors. Any investment or investment activity to which this document relates is only
available to major institutional investors and will be engaged in only with major institutional investors. In reliance on the exemption from registration provided by Rule 15a-6 of the U.S. Securities Exchange
Act of 1934, as amended (the "Exchange Act") and interpretations thereof by the U.S. Securities and Exchange Commission ("SEC") in order to conduct business with Institutional Investors based in the
U.S., MOSL has entered into a chaperoning agreement with a U.S. registered broker-dealer, Motilal Oswal Securities International Private Limited. ("MOSIPL"). Any business interaction pursuant to this
report will have to be executed within the provisions of this chaperoning agreement.
The Research Analysts contributing to the report may not be registered /qualified as research analyst with FINRA. Such research analyst may not be associated persons of the U.S. registered broker-
dealer, MOSIPL, and therefore, may not be subject to NASD rule 2711 and NYSE Rule 472 restrictions on communication with a subject company, public appearances and trading securities held by a
research analyst account.
For U.S.
Motilal Oswal Capital Markets Singapore Pte Limited is acting as an exempt financial advisor under section 23(1)(f) of the Financial Advisers Act(FAA) read with regulation 17(1)(d) of the Financial
Advisors Regulations and is a subsidiary of Motilal Oswal Securities Limited in India. This research is distributed in Singapore by Motilal Oswal Capital Markets Singapore Pte Limited and it is only directed
in Singapore to accredited investors, as defined in the Financial Advisers Regulations and the Securities and Futures Act (Chapter 289), as amended from time to time.
In respect of any matter arising from or in connection with the research you could contact the following representatives of Motilal Oswal Capital Markets Singapore Pte Limited:
Kadambari Balachandran
Email : kadambari.balachandran@motilaloswal.com
Contact: (+65) 68189233 / 65249115
Office address: 21 (Suite 31), 16 Collyer Quay, Singapore 049318
For Singapore
Motilal Oswal Securities Ltd
Motilal Oswal Tower, Level 9, Sayani Road, Prabhadevi, Mumbai 400 025
Phone: +91 22 3982 5500 E-mail: reports@motilaloswal.com
30 September 2013
16