Metals Weekly
7 October 2013
Metals Weekly
Valuations: Indian companies
Price
EV/EBITDA P/BV
(INR) FY14E FY15E FY14E
Steel
Tata Steel
288
SAIL
55
JSW Steel
774
JSPL
236
NMDC
124
Non-ferrous
Hindalco
118
Sesa-Sterlite 187
HZL
132
Nalco
33
Rain Industries 39
6.0
7.7
6.7
8.4
3.8
7.8
5.8
4.3
3.8
4.9
6.3
8.4
6.4
6.1
3.7
6.2
5.0
3.6
3.3
4.1
1.2
0.5
1.1
1.0
1.6
1.0
0.7
1.5
0.7
0.5
TMT- Mumbai (INR/ton)
HRC- Mumbai (INR/ton)
HRC (USD/ton) fob CIS
Metal Prices
CMP
7-Oct
34,600
38,219
543
%
-2
-3
-1
0
0
-1
-2
0
0
1
0
-3
0
-1
-1
-1
-1
-2
-2
-3
0
Week
30-Sep
35,300
39,457
550
20,300
25,000
133
245
351
1,789
111
5,375
1,880
116
1,024
Quarter
%
1-Jul
6 32,600
10 34,673
6
510
7 19,000
1 24,800
12
117
9
220
1
347
3
7
-1
0
6
-5
1,731
104
5,436
1,823
109
1,061
6,750
402
666
YTD FY13
% 1-Apr
-1 34,900
5 36,565
-4
565
3
3
-4
-9
-9
-5
9
3
-2
14
-13
-6
10
-8
1
-9
-3
-1
19,800
24,200
138
265
385
1,881
102
5,228
1,870
102
1,171
7,582
408
571
29,526
52,621
2,094
1.03
Sponge iron - Raipur (INR/ton)
20,300
Pig iron - Raipur (INR/ton)
25,000
Iron ore spot (USD/ton) cfr China
132
Coke (USD/ton) fob
240
Shred. scrap (USD/ton) Rotterdam
352
LME Spot (USD/ton)
Indian prices (INR ‘000/ton)
LME inventories (‘000 ton)
LME Spot (USD/ton)
Indian prices (INR ‘000/ton)
LME inventories (‘000 ton)
LME Spot (USD/ton)
Indian prices (INR ‘000/ton)
LME inventories (‘000 ton)
1,789
111
5,360
1,831
116
1,013
7,148
447
526
Note: Detailed table on pg 23
Source: MOSL
Valuations: Global companies
Price
Mining
BHP
AUD 35.1
FMG
AUD 4.8
Rio Tinto AUD 60.5
Vale
USD 31.9
Teck Res. USD 27.1
Steel
A. Mittal EUR 10.4
Posco k KRW 312.5
US Steel USD 21.5
Nucor
USD 48.8
JFE
JPY 2422
Gerdau
BRL 16.9
Bao Steel CNY 4.2
Non-ferrous
Alcoa
USD 8.0
Norsk Hyd. NOK 24.9
Rusal
HKD 2.4
Detailed on pg 23
BSE Metals Index
Sensex
108
104
100
96
EV/EBITDA
CY13 CY14
6.4
4.4
6.5
5.0
6.8
6.5
5.4
8.6
12.2
7.5
9.2
6.8
6.0
4.2
5.9
5.0
6.3
5.5
4.9
5.5
7.6
6.7
7.3
6.1
P/BV
CY13
2.5
2.7
2.3
1.1
0.9
0.5
0.6
0.9
2.1
1.0
1.1
0.8
7,252
6
454 11
533 -21
30,186
48,800
2,083
1.01
Gold (INR/10gms)
29,728
Sliver (INR/1kg)
47,904
Lead Spot LME (USD/ton)
2,027
FC 6-8% C basis 60% Cr (USD/lb Cr) 1.01
INR/USD
BDI
15 25,778
19 40,408
-2 2,058
2
0.99
61.8 -1
62.5
4
59.6
13
54.5
2,084
4
2,003 78 1,171 129
910
Source: Metal Bulletin, Bloomberg, Steel Mint, MOSL
7.7
7.1
0.7
9.2
7.2
0.7
16.9 15.4
0.4
Source: Bloomberg
Indian Steel prices come off their recent highs; Global steel prices
marginally weak/flat
Indian long steel product prices e.g. TMT (Mumbai) declined 2% WoW to
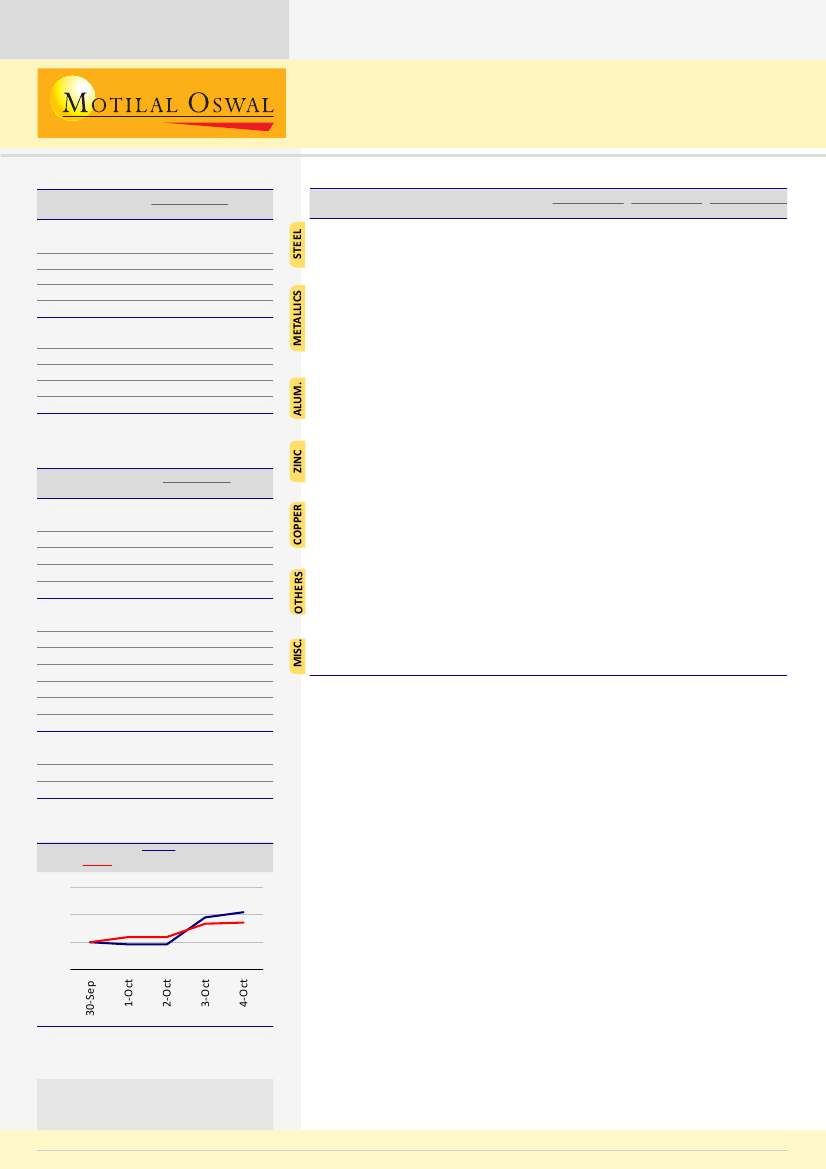
BSE Metals Index v/s Sensex
INR34,600/t. Sponge iron prices were flat WoW at INR20,300, while Pellet
prices declined by INR50 to INR7,250/t.
Steel prices declined in CIS and Turkey by 1.4% and 2.4% WoW
respectively. Prices were flat WoW in Europe and N. America while
Chinese market was closed due to holiday.
Iron ore prices (63.5% Fe CFR China) decreased USD1/t WoW to
USD132/t, while Coking coal prices (Premium Low volatile, Fob Australia)
declined 3% WoW to USD149/t.
Base metals prices were weak with Copper, Lead and Zinc declining 1%,
Source: Bloomberg
Note: Indexed to 100 on 30 September 2013
Stock performance table on pg 24
Investors are advised to refer through
disclosures made at the end of the
Research Report.
3% and 3% WoW respectively. Aluminium prices were flat WoW.
Codelco will offer its European customers a premium of USD112/tonne
for copper cathode to be supplied in 2014 which is 32% higher than
Codelco's 2013 premium and USD7/tonne above Aurubis's offer for 2014.
Sanjay Jain
(SanjayJain@MotilalOswal.com); Tel:+91 22 3982 5412
7 October 2013
Pavas Pethia
(Pavas.Pethia@MotilalOswal.com); Tel:+91 22 3982 5413
1

Metals Weekly
Contents
Page No.
Ferrous
..................................................................................
3-10
India ...................................................................................................... 3 & 4
European Union .......................................................................................... 5
China ............................................................................................................ 6
Other regions ........................................................................................ 7 & 8
Steel raw material ............................................................................... 9 & 10
Ferro alloys ................................................................................................ 11
Non ferrous
..........................................................................
12-18
Aluminum ................................................................................................. 12
Copper ....................................................................................................... 14
Zinc ............................................................................................................ 15
Lead ........................................................................................................... 16
Commodity curve analysis ................. ...................................................17
China non-ferrous trade data ................ ...............................................18
Key indicators
......................................................................
19-20
Industrial production growth across the globe
........................
21
BSE Exchange announcements
................................................
22
Metals valuation matrix
...........................................................
23
Metals stock performance
.......................................................
24
7 October 2013
2

Metals Weekly
Ferrous
Ferrous
INDIA
Indian flat steel prices import parity (INR/T, exl. ED & VAT)
HRC M umbai
43,000
HRC (Import Parity) prices declined
3% WoW to INR38,219/t
41,000
39,000
37,000
35,000
33,000
31,000
Indian long steel price (INR/T, exl. ED & VAT)
TM T (Mumbai)
39,000
TMT (Mumbai) prices declined
2% WoW to INR34,600/t
37,000
35,000
33,000
31,000
Steel intermediates prices (INR/T, exl. ED & VAT)
23,000
21,000
19,000
17,000
Spo nge (Raipur)
Sponge iron (Raipur) prices were
flat WoW at INR20,300/t
India: Monthly crude steel production
India
YoY (%
)
7.0
6.5
6.0
5.5
5.0
30
20
10
-
(10)
Source: SteelMint, WSA, MOSL
7 October 2013
3

Metals Weekly
Ferrous
INDIA
Scrap Mandi (INR/t)
Scrap (M andi)
27,000
26,000
25,000
24,000
23,000
22,000
Iron ore lumps (INR/t)
NM DC 6-40mm (CG)
Lumps 5-1 (Odisha)
8
Iron ore lumps (Odisha) were
flat WoW at INR6,400/t
9,000
8,000
7,000
6,000
5,000
4,000
Iron ore fines (INR/t)
Fines 63% (Odisha)
NM DC Fines
Iron ore fines (Odisha) were
flat WoW at INR1,500/t
3,500
3,200
2,900
2,600
2,300
2,000
1,700
1,400
Pellet (Barbil) INR/t
P ellet (B arbil)
9,000
8,500
Pellet prices (Barbil) declined
INR50 WoW to INR7,250/t
8,000
7,500
7,000
6,500
6,000
Source: SteelMint, WSA, MOSL
7 October 2013
4

Metals Weekly
European Union
European HRC prices (EUR/ton)
Euro pe
HR Europe prices were
flat WoW at Euro465/t
600
550
500
450
400
Rotterdam: shredded scrap prices (USD/t)
470
440
Rotterdam export Shredded scrap
prices increased 0.3% WoW
to USD352/t
410
380
350
320
European wire rods sourthern region (Euro/ton)
Wire Ro ds
570
550
530
510
490
470
450
European Union: Monthly crude steel production
EU
Yo Y (%)
17
15
13
11
20
10
0
-10
Source: Metal Bulletin, Bloomberg, WSA, MOSL
7 October 2013
5

Metals Weekly
China
China domestic prices (USD/ton)
740
680
620
560
500
HRC
Rebar
Steel spreads for Chinese producers
Spread [(HRC -1
.6*Iro n o re - 0.55*Co ke)]
HRC (LHS)
800
720
640
560
480
400
300
270
240
210
180
150
Steel trade (m ton)
Expo rts
Impo rts
6
4
2
-
Monthly crude steel production
China
Yo Y (%)
70
62
54
46
38
30
20
15
10
5
0
-5
-10
Source: Metal Bulletin, Bloomberg, WSA, MOSL
7 October 2013
6

Metals Weekly
Other regions
CIS HRC export prices (USD/ton)
CIS Expo rts (HRC)
620
580
540
500
CIS export HR prices decreased
1.4%WoW to USD543/t
Turkish export billets (USD/ton)
580
560
540
Turkish Exp B illets
Turkish export billet prices
decreased 2.4% WoW to USD513/t
520
500
North America HRC prices (USD/ton)
700
North America domestic HRC prices
were flat WoW at USD640/t
650
600
550
CIS: Monthly crude steel production
CIS
Yo Y (%)
10
9
8
7
11
4
-3
-10
Source: Metal Bulletin, WSA, Bloomberg, MOSL
7 October 2013
7

Metals Weekly
Other regions
North America: Monthly crude steel production
No rth A merica
Yo Y (%)
11
10
9
8
20
10
0
-10
-20
Global: Monthly crude steel production
Glo bal
Yo Y (%)
140
130
120
110
8
4
0
-4
Global: Monthly crude steel capacity utilization
Capacity Utilizatio n
84
81
78
75
72
69
Source: Bloomberg, WSA, MOSL
7 October 2013
8

Metals Weekly
Steel raw materials
Indian 63.5% grade iron-ore fines in China (USD/ton)
CIF
FOB
160
China spot CFR iron ore prices
decreased USD1/t WoW
to USD132/ton DMT
140
120
100
OTC iron-ore swaps (USD/ton)
201
4
2Q1
4
1
QFY1
4
140
130
120
110
100
90
China iron-ore production and imports (m tons)
Ore Impo rts
Ore P ro d
P ig iro n pro d (RHS)
150
120
90
70
65
60
55
60
30
50
45
China iron-ore inventories (m tons)
110
100
90
80
70
60
Source: Metal Bulletin, Bloomberg, MOSL
7 October 2013
9

Metals Weekly
Steel raw materials
Freight rates to China (USD/ton)
B razil
A ustralia
India
32
24
16
8
-
Coal price index
Richards B ay Steam Co al
120
105
90
75
60
Coke price index
China co ke expo rt spo t (LHS)
China 1 grade metallurgical co ke
st
450
400
350
300
250
200
2,200
2,175
2,150
2,125
2,100
2,075
Coking coal (USD/t)
Spo t co king co al (fo b A ustralia)
180
Spot coking coal FOB Australia
decreased 3% WoW to USD149/t
160
140
120
Source: Metal Bulletin, Bloomberg, MOSL
7 October 2013
10

Metals Weekly
Ferro alloys
China’s imports of manganese ore and conc
Impo rts
P rices (RHS)
1,700
1,400
1,100
800
500
250
220
190
160
130
Chrome ore FOB spot prices
255
220
185
150
115
40% Chro me A frica (RHS)
Ferro chrome CIF prices (CNY/t)
Fe Chro me 50% Cr China
Fe Chro me 63% Cr P ittursburgh
11,500
10,000
8,500
7,000
5,500
Source: Metal Bulletin, Bloomberg, MOSL
7 October 2013
11

Metals Weekly
Non-ferrous
Non-ferrous
Aluminum
LME inventories and prices
Invento ries
Spo t
2,300
5.6
5.4
5.2
5.0
Aluminum spot prices were
flat WoW at USD 1,789/ton
2,100
1,900
1,700
Global primary aluminum monthly production and YoY growth
P ro ductio n
Yo Y
4,250
4,000
3,750
3,500
20
8
(4)
(16)
China primary aluminum monthly production and YoY growth
P ro ductio n
Yo Y
2.0
30
1.8
1.6
20
10
1.4
-
India: Company-wise primary aluminum monthly production
Hindalco
B alco
Nalco
VA L
Source: Metal Bulletin, Bloomberg, MOSL
7 October 2013
12

Metals Weekly
Non-ferrous
Aluminum
Aluminum raw material and power cost for marginal producer in US
CP C
Alumina
Po wer
LM E+Spot
3,500
3,000
2,500
2,000
1,500
1,000
500
-
CPC US
575
450
325
200
Alumina
480
400
320
240
160
Industrial power US (Lousiana)
10.0
8.5
7.0
5.5
4.0
Source: Metal Bulletin, Bloomberg, Industry, MOSL
7 October 2013
13

Metals Weekly
Non-ferrous
Copper
LME inventories and prices
Invento ries
Spo t
9,100
8,600
0.7
0.6
0.5
0.4
0.3
0.2
Copper spot prices decreased
1% WoW to USD 7,148/ton
8,100
7,600
7,100
6,600
Global refined copper monthly production and YoY growth
P ro ductio n
Yo Y - RHS
1.9
1.8
1.7
1.6
1.6
1.5
1.4
10.0
7.5
5.0
2.5
0.0
-2.5
China: Refined copper monthly production and YoY growth
P ro ductio n
Yo Y - RHS
0.60
0.54
0.48
0.42
0.36
0.30
36
25
14
3
(8)
India: Company-wise refined copper monthly production
80
60
40
20
-
HCL
Sterlite
Hindalco
Source: Metal Bulletin, Bloomberg, MOSL
7 October 2013
14

Metals Weekly
Non-ferrous
Zinc
LME inventories and prices
Invento ries
Spo t
2,300
1.3
Zinc spot prices decreased
3% WoW to USD1,831/ton
2,100
1.1
1,900
0.9
1,700
0.7
Global refined zinc monthly production and YoY growth
P ro ductio n
Yo Y - RHS
1.2
1.1
1.1
1.0
0.9
14
8
2
(4)
(10)
China: Refined zinc monthly production and YoY growth
P ro ductio n
Yo Y - RHS
0.5
0.4
0.3
0.3
0.2
60
40
19
(2)
(22)
India: Company-wise refined zinc monthly production
HZL
B ZL
4 2 3 2 2 2
2
0
2
2
2 2
3 3 2 2
2
3 3
2
2
2
2
2 2
Source: Metal Bulletin, Bloomberg, MOSL
7 October 2013
15

Metals Weekly
Non-ferrous
Lead
LME inventories and prices
Invento ries
Spo t
2,600
2,400
0.40
0.35
0.30
0.25
0.20
0.15
Lead spot prices decreased
3% WoW to USD2,027/ton
2,200
2,000
1,800
1,600
Global refined lead monthly production and YoY growth
P ro ductio n
Yo Y - RHS
1.0
0.9
0.8
0.7
0.6
25
15
5
(5)
(15)
China: Refined lead monthly production and YoY growth
P ro ductio n
Yo Y - RHS
0.5
0.4
0.3
0.2
40
20
-
(20)
(40)
India: Company-wise refined lead monthly production
HZL
Source: Metal Bulletin, Bloomberg, MOSL
7 October 2013
16

Metals Weekly
Commodity forward curves
LME aluminum (USD/ton)
Current
1
-week ago
3-mo nth ago
2,400
2,200
2,000
1,800
1,600
LME copper (USD/ton)
Current
1
-week ago
3-mo nth ago
7,600
7,400
7,200
7,000
6,800
6,600
LME zinc futures (USD/ton)
Current
1
-week ago
3-mo nth ago
2,100
2,000
1,900
1,800
Base metals US spot premium (USD/ton)
A luminium
Zinc
Co pper
300
235
170
105
40
Source: Metal Bulletin, Bloomberg, MOSL
7 October 2013
17

Metals Weekly
China non-ferrous trade data
China’s aluminum trade ('000 tons)
Impo rts
Expo rts
400
300
200
100
-
China’s refined copper trade ('000 tons)
Impo rts
Expo rts
500
400
300
200
100
-
China’s refined zinc trade ('000 tons)
Expo rt
Impo rt
75
50
25
-
China’s alumina imports ('000 tons) and prices (USD/ton)
Impo rts
P rices (RHS)
800
600
400
200
-
Source: Metal Bulletin, Bloomberg, MOSL
7 October 2013
18

Metals Weekly
Key indicators
China new loan growth
1,200
900
600
300
China PMI
54
52
50
48
China: Fixed asset investment
27
24
21
18
Currency movement with respect to the rupee
USD (LHS)
GB P
EURO
71
67
110
101
92
83
74
65
The rupee appreciated 1.2% WoW
against the US dollar and was
trading at INR61.8/USD
63
59
55
51
Source: Bloomberg, MOSL
7 October 2013
19

Metals Weekly
Key indicators
(Contd..)
China Energy Production Electricity (b kwh)
500
450
400
350
300
250
200
Electricity
Yo Y (%, RHS)
50
40
30
20
10
-
(10)
China Monthly Trade YoY (%)
60
Impo rt
Expo rt
40
20
-
(20)
China Price Index YoY (%)
PPI
CP I
9
6
3
-
(3)
(6)
China GDP YoY (%)
10
9
8
7
GDP
Source: Bloomberg, MOSL
7 October 2013
20

Metals Weekly
Industrial production growth
The UK and the US
UK
USA
6
3
0
-3
-6
Japan
20
10
0
-10
-20
European Union
France
Germany
Italy
20
8
-4
-16
BRIC
Russia
B razil
India
China
18
12
6
0
-6
Source: Bloomberg, MOSL
7 October 2013
21

Metals Weekly
Stock Exchange announcements
JSW Steel
has executed Business Transfer Agreement with Heidelberg
Cement India for acquisition of cement grinding unit at Raigad.
7 October 2013
22

Metals Weekly
Metals
Valuation Matrix
Valuations: Indian companies
Rating
Price Mkt Cap
(INR) (USD M)
4,494
3,650
3,001
3,545
7,891
EPS (INR)
FY13
FY14E
1.6
5.7
49.7
37.2
16.7
33.6
8.2
65.5
27.3
15.7
FY15E
32.2
5.5
71.4
32.3
16.0
P/E (X)
FY14E FY15E
8.6
6.7
11.8
8.7
7.9
9.0
9.9
10.8
7.3
7.7
EV/EBITDA (X)
FY14E FY15E
6.0
7.7
6.7
8.4
3.8
6.3
8.4
6.4
6.1
3.7
P/B (X)
FY14E FY15E
1.2
0.5
1.1
1.0
1.6
1.1
0.5
1.0
0.9
1.5
Steel
Tata Steel
Sell
288
SAIL
Sell
55
JSW Steel
Sell
774
JSPL
Neutral
236
NMDC
Buy
124
Non-Ferrous
Hindalco
Buy
118
Sesa-Sterlite
Buy
187
Hindustan Zinc
Buy
132
Nalco
Buy
33
Rain Industries*
Buy
39
* Rain Comm. follows calendar year reporting,
3,744
17.0
14.0
15.0
8.4
7.9
7.8
6.2
8,541
35.9
33.8
35.9
5.5
5.2
5.8
5.0
8,607
16.4
16.7
16.4
7.9
8.1
4.3
3.6
1,326
2.3
3.3
3.3
10.3
10.3
3.8
3.3
247
16.7
13.3
16.7
2.9
2.3
4.9
4.1
CY13 and CY14 fig. are quoted in place of FY14 and FY15 respectively
1.0
0.9
0.7
0.6
1.5
1.3
0.7
0.7
0.5
0.4
Source: MOSL
Valuations: Global companies
BBG
Code
Mining
BHP-Billiton
FMG
Rio Tinto
Vale
Teck Resources
Steel
Arcelor Mittal
Posco
US Steel
Nucor
JFE
Gerdau
Bao Steel
Non-Ferrous
Alcoa
Norsk Hydro
Rusal
BHP AU
FMG AU
RIO AU
Vale US
TCK US
MT NA
005490 KS
X US
NUE US
5411 JT
GGBR4 BZ
600019 CH
AA US
NHY NO
486 HK
Currency
Price
Mkt Cap
(USD M)
166,100
14,010
92,855
80,979
15,595
23,539
25,425
3,110
15,521
15,199
12,556
11,313
8,514
8,619
4,702
P/E (X)
CY13
12.5
5.1
11.4
6.8
17.2
-
13.2
-
35.7
10.3
21.1
9.9
27.1
43.1
28.1
CY14
11.4
5.0
10.0
6.7
14.1
15.6
10.7
23.9
15.1
8.4
12.7
8.8
18.6
20.4
8.4
EV/EBITDA(X)
CY13
CY14
6.4
4.4
6.5
5.0
6.8
6.5
5.4
8.6
12.2
7.5
9.2
6.8
7.7
9.2
16.9
6.0
4.2
5.9
5.0
6.3
5.5
4.9
5.5
7.6
6.7
7.3
6.1
P/BV
CY13
2.5
2.7
2.3
1.1
0.9
0.5
0.6
0.9
2.1
1.0
1.1
0.8
AUD
AUD
AUD
USD
USD
EUR
k KRW
USD
USD
JPY
BRL
CNY
USD
NOK
HKD
35.1
4.8
60.5
31.9
27.1
10.4
312.5
21.5
48.8
2,422.0
16.9
4.2
8.0
24.9
2.4
7.1
0.7
7.2
0.7
15.4
0.4
Source: Bloomberg
7 October 2013
23

Metals Weekly
Metals Stock
Performance
Metals stock performance on absolute and relative basis (%)
Months
Steel
Tata Steel
SAIL
JSW Steel
JSPL
NMDC
Sesa Sterlite
Non-ferrous
Hindustan Zinc
Nalco
Hindalco
Mid Caps
Monnet Ispat
Godawari
Sarda Energy
Tata Sponge
Adhunik Metaliks
Bhushan Steel
Jai Balaji
Rain Industries
Prakash Industries
SENSEX
Best performer
Absolute Perf (%)
1
3
6
-0.1
14.8
37.5
4.3
2.1
4.7
6.9
-0.7
9.3
-7.2
-0.3
10.7
-0.1
37.3
4.4
-14.2
5.9
4.6
4.9
8.9
14.6
25.4
5.6
19.4
30.7
29.4
12.4
18.0
-4.3
3.9
0.4
-3.4
19.1
3.6
-35.4
6.4
4.5
2.2
-6.5
-10.5
14.6
-29.4
-0.6
25.0
13.6
-0.4
31.2
-43.9
-6.6
-5.1
-9.6
-9.7
5.9
-42.2
-20.6
-14.5
7.9
12
-29.7
-36.1
4.8
-43.3
-34.5
8.9
-2.5
-34.4
-5.7
-62.3
-35.2
-29.2
-17.7
-11.7
-2.1
-59.9
-13.5
-42.6
5.2
Relative Perf to Sensex (%)
1
3
6
12
-5.0
9.9
32.6
-0.6
-2.8
-0.2
1.9
-5.7
4.3
6.8
12.4
23.3
3.5
17.3
28.5
27.2
10.3
15.9
-14.4
-18.4
6.7
-37.3
-8.5
17.0
5.7
-8.4
23.3
-34.9
-41.2
-0.4
-48.5
-39.6
3.7
-7.7
-39.6
-10.9
Among large-cap companies,
JSW Steel has outperformed and
Nalco has underperformed over
the last one month
Among mid-cap companies,
Adhunik Metaliks outperformed and
Monnet Ispat has underperformed
over the last one month
Worst performer
-12.2
-6.5 -51.8 -67.5
-5.2
1.7 -14.5 -40.4
5.8
-1.8 -13.0 -34.4
-5.0
-5.5 -17.6 -22.8
32.3
17.0 -17.6 -16.8
-0.5
1.4
-2.0
-7.3
-19.1 -37.5 -50.2 -65.1
1.0
4.2 -28.6 -18.6
-0.3
2.3 -22.4 -47.7
-
-
-
-
Source: MOSL, Bloomberg
Global metals stock performance on absolute basis (%)
1week
Mining
Rio Tinto
BHP Billiton
Vale
FMG
Anglo American
Vedanta
Steel
US Steel
Nucor
Arcelor Mittal
Bao Steel
Posco
JFE Holdings
Nippon
Thyssen Krupp
Voest Alpine
Gerdau
Aluminium
Alcoa
Rusal
Chalco
Best performer
-1.9
-3.4
0.1
-3.0
-3.2
-1.6
5.2
0.0
2.5
0.0
-3.4
-9.6
-6.3
2.9
-1.9
2.0
-2.9
2.6
-2.1
Worst performer
1month
-2.3
-1.2
1.8
8.4
-3.2
-10.8
17.0
5.2
2.2
-6.7
-2.8
2.7
9.3
15.2
3.2
2.9
1.5
6.7
0.7
Absolute Perf (%)
3 months
6 months
14.2
11.2
23.6
42.6
22.5
6.5
17.1
11.2
20.4
6.3
5.4
4.2
14.6
24.1
22.5
33.7
1.9
-22.9
16.1
-0.1
10.6
-8.0
34.9
-9.4
-1.3
22.5
12.1
9.5
-13.4
-2.6
39.8
47.3
24.5
50.7
4.6
12 months
0.8
5.4
-11.9
32.7
-17.7
-4.1
8.4
26.4
-8.6
-8.3
-14.4
133.6
108.9
2.5
42.7
-17.1
Among global mining companies,
FMG was the best performer while
Anglo American was the worst
performing stock over the
last one month
Among global steel majors, US Steel
was the best performer while Bao
Steel was the worst performing
stock over the last one month
-3.2
-12.4
-40.4
-48.2
-4.7
-14.3
Source: MOSL, Bloomberg
7 October 2013
24

Motilal Oswal
Product Gallery
weekly
Motilal Oswal
Sector
Periodicals
power utilities monthly

Metals Weekly
Disclosures
This report is for personal information of the authorized recipient and does not construe to be any investment, legal or taxation advice to you. This research report does not constitute an offer, invitation or inducement
to invest in securities or other investments and Motilal Oswal Securities Limited (hereinafter referred as MOSt) is not soliciting any action based upon it. This report is not for public distribution and has been
furnished to you solely for your information and should not be reproduced or redistributed to any other person in any form.
Unauthorized disclosure, use, dissemination or copying (either whole or partial) of this information, is prohibited. The person accessing this information specifically agrees to exempt MOSt or any of its affiliates
or employees from, any and all responsibility/liability arising from such misuse and agrees not to hold MOSt or any of its affiliates or employees responsible for any such misuse and further agrees to hold MOSt
or any of its affiliates or employees free and harmless from all losses, costs, damages, expenses that may be suffered by the person accessing this information due to any errors and delays.
The information contained herein is based on publicly available data or other sources believed to be reliable. While we would endeavour to update the information herein on reasonable basis, MOSt and/or its
affiliates are under no obligation to update the information. Also there may be regulatory, compliance, or other reasons that may prevent MOSt and/or its affiliates from doing so. MOSt or any of its affiliates or
employees shall not be in any way responsible and liable for any loss or damage that may arise to any person from any inadvertent error in the information contained in this report . MOSt or any of its affiliates
or employees do not provide, at any time, any express or implied warranty of any kind, regarding any matter pertaining to this report, including without limitation the implied warranties of merchantability, fitness
for a particular purpose, and non-infringement. The recipients of this report should rely on their own investigations.
This report is intended for distribution to institutional investors. Recipients who are not institutional investors should seek advice of their independent financial advisor prior to taking any investment decision
based on this report or for any necessary explanation of its contents.
MOSt and/or its affiliates and/or employees may have interests/positions, financial or otherwise in the securities mentioned in this report. To enhance transparency, MOSt has incorporated a Disclosure of Interest
Statement in this document. This should, however, not be treated as endorsement of the views expressed in the report.
Disclosure of Interest Statement
1. Analyst ownership of the stock
2. Group/Directors ownership of the stock
3. Broking relationship with company covered
4. Investment Banking relationship with company covered
Companies where there is interest
Rain Industries, Sesa Goa, Tata Sponge
None
None
None
Analyst Certification
The views expressed in this research report accurately reflect the personal views of the analyst(s) about the subject securities or issues, and no part of the compensation of the research analyst(s) was, is, or
will be directly or indirectly related to the specific recommendations and views expressed by research analyst(s) in this report. The research analysts, strategists, or research associates principally responsible
for preparation of MOSt research receive compensation based upon various factors, including quality of research, investor client feedback, stock picking, competitive factors and firm revenues.
Regional Disclosures (outside India)
This report is not directed or intended for distribution to or use by any person or entity resident in a state, country or any jurisdiction, where such distribution, publication, availability or use would be contrary to
law, regulation or which would subject MOSt & its group companies to registration or licensing requirements within such jurisdictions.
For U.K.
This report is intended for distribution only to persons having professional experience in matters relating to investments as described in Article 19 of the Financial Services and Markets Act 2000 (Financial
Promotion) Order 2005 (referred to as "investment professionals"). This document must not be acted on or relied on by persons who are not investment professionals. Any investment or investment activity to
which this document relates is only available to investment professionals and will be engaged in only with such persons.
For U.S.
Motilal Oswal Securities Limited (MOSL) is not a registered broker - dealer under the U.S. Securities Exchange Act of 1934, as amended (the"1934 act") and under applicable state laws in the United States.
In addition MOSL is not a registered investment adviser under the U.S. Investment Advisers Act of 1940, as amended (the "Advisers Act" and together with the 1934 Act, the "Acts), and under applicable state
laws in the United States. Accordingly, in the absence of specific exemption under the Acts, any brokerage and investment services provided by MOSL, including the products and services described herein
are not available to or intended for U.S. persons.
This report is intended for distribution only to "Major Institutional Investors" as defined by Rule 15a-6(b)(4) of the Exchange Act and interpretations thereof by SEC (henceforth referred to as "major institutional
investors"). This document must not be acted on or relied on by persons who are not major institutional investors. Any investment or investment activity to which this document relates is only available to major
institutional investors and will be engaged in only with major institutional investors. In reliance on the exemption from registration provided by Rule 15a-6 of the U.S. Securities Exchange Act of 1934, as amended
(the "Exchange Act") and interpretations thereof by the U.S. Securities and Exchange Commission ("SEC") in order to conduct business with Institutional Investors based in the U.S., MOSL has entered into
a chaperoning agreement with a U.S. registered broker-dealer, Motilal Oswal Securities International Private Limited. ("MOSIPL"). Any business interaction pursuant to this report will have to be executed within
the provisions of this chaperoning agreement.
The Research Analysts contributing to the report may not be registered /qualified as research analyst with FINRA. Such research analyst may not be associated persons of the U.S. registered broker-dealer,
MOSIPL, and therefore, may not be subject to NASD rule 2711 and NYSE Rule 472 restrictions on communication with a subject company, public appearances and trading securities held by a research analyst
account.
For Singapore
Motilal Oswal Capital Markets Singapore Pte Limited is acting as an exempt financial advisor under section 23(1)(f) of the Financial Advisers Act(FAA) read with regulation 17(1)(d) of the Financial Advisors
Regulations and is a subsidiary of Motilal Oswal Securities Limited in India. This research is distributed in Singapore by Motilal Oswal Capital Markets Singapore Pte Limited and it is only directed in Singapore
to accredited investors, as defined in the Financial Advisers Regulations and the Securities and Futures Act (Chapter 289), as amended from time to time.
In respect of any matter arising from or in connection with the research you could contact the following representatives of Motilal Oswal Capital Markets Singapore Pte Limited:
Kadambari Balachandran
Email : kadambari.balachandran@motilaloswal.com
Contact: (+65) 68189233 / 65249115
Office address: 21 (Suite 31), 16 Collyer Quay, Singapore 049318
Motilal Oswal Securities Ltd
Motilal Oswal Tower, Level 9, Sayani Road, Prabhadevi, Mumbai 400 025
Phone: +91 22 3982 5500 E-mail: reports@motilaloswal.com