28 October 2013
2QFY14 Results Update | Sector:
Automobiles
Maruti Suzuki
BSE SENSEX
20,570
Bloomberg
Equity Shares (m)
M.Cap. (INR b) / (USD b)
52-Week Range (INR)
1, 6, 12 Rel. Per (%)
Financials & Valuation (INR b)
Y/E MAR
Sales
EBITDA
Adj. PAT
Con.adj.EPS
EPS Gr (%)
BV/Sh (INR)
RoE (%)
RoCE (%)
Con.P/E (x)
P/CE (x)
2013
435.9
42.3
23.9
80.2
37.8
615.0
12.9
15.5
18.9
10.7
2014E
439.6
52.4
28.7
96.3
20.1
697.2
13.6
17.4
15.7
9.1
2015E
504.0
59.1
32.6
108.0
12.1
791.2
13.6
17.3
14.0
8.0
S&P CNX
6,101
MSIL IN
302.1
457/7.4
1,773/1,217
6/-15/0
CMP: INR1,513
TP: INR1,702
Buy
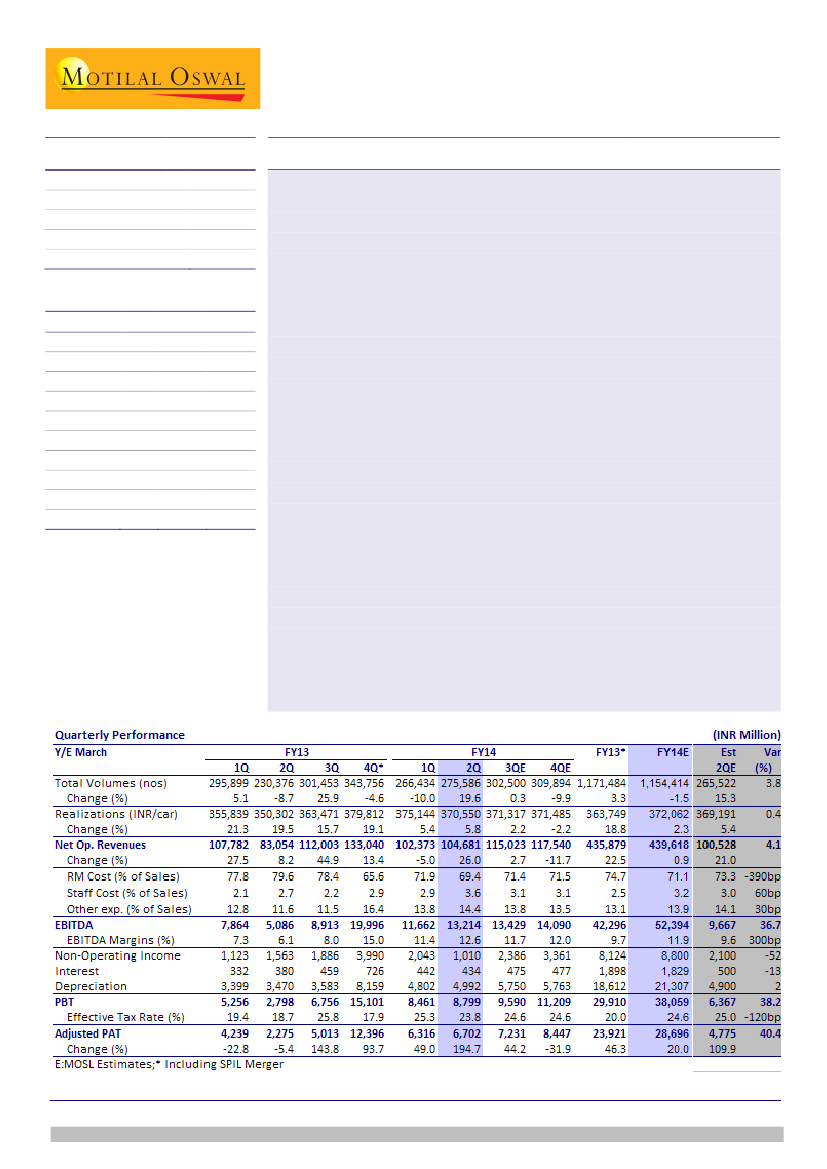
Above est with EBITDA margin at 12.6%; upgrade FY14E EPS by 22%
Current quarter’s performance is not comparable YoY due to merger of SPIL in
4QFY13. MSIL’s 2QFY14 performance was above estimates, with EBITDA margins
of 12.6% (up 120bp QoQ, est 9.7%) driven by favorable forex. Led by higher-than-
estimated EBITDA, PAT stood at INR6.7b (est. INR4.8b).
Earnings call highlights
RM cost fell 260bp QoQ led by 100bp favorable forex on vendors’ import
(quarter lag), higher export revenue (INR depreciation) and low cost inventory
of direct imports (timing mismatch, to reverse in 3Q).
Diesel share stood at 30% (v/s 34% in 1Q). Average discounts increased
sequentially by INR4,000 to INR17,500/unit in 2Q.
Festive sales so far have risen by 5-8%; seasonally, 2H expected to be better
by 10%. Rural grew by 24% during 1HFY14, contributing 31% to MSIL sales.
JPY/USD direct and indirect exposure fully hedged for 3Q and partially hedged
for direct exposure for 4Q. Royalty (payable in May-14) remains unhedged.
USD/INR exposure hedged for 3Q.
Import content to reduce 2-2.5% annually from 19.5% in Mar-13. Depending
on component/technology, ~10-20% cost savings can be expected.
Valuation and view
We upgrade FY14E/FY15E EPS by 22%/7% to ~INR96/108 respectively to
factor a) strong 2QFY14 performance, b) 2HFY14 fx hedges and c) benefit of
cost saving initiatives. We assume volume growth of -1.5%/12.8%, EBITDA of
11.9%/11.7% and JPY/INR of 0.617/0.625 in FY14E/FY15E.
The stock trades at 15.7x/14x FY14E/15E consol. EPS and 9.1x/8x FY14E/15E
cash EPS. Maintain
Buy
with a revised target price of INR1,702 (~9x FY15E
CEPS/16x FY15E con. EPS).
Jinesh Gandhi
(Jinesh@MotilalOswal.com); +91 22 3982 5416
Chirag Jain
(Chirag.Jain@MotilalOswal.com); +91 22 3982 5418
Investors are advised to refer through disclosures made at the end of the Research Report.

Maruti Suzuki
Volumes improves 20% YoY; market share improves QoQ
Volumes improved 19.6% YoY (up 3.4% QoQ), with domestic volume growth of
15% YoY (down 1.6% QoQ) and exports volume growing by 67% YoY (up 61%
QoQ).
Last year’s volumes were impacted due to labour issues at Manesar plant.
MSIL market share improved sequentially in the domestic car and PV segment in
2QFY14 by 80bp/140bp QoQ to 49%/42.1%.
Realizations increased by 5.8% YoY (-1.2% QoQ) to INR 370,550. Sequential drop
is due to lower share of diesel vehicles (30% v/s 34% in 1Q), higher discounts
(INR17,500 v/s INR13,500 in 1Q) partially offset by higher export realizations
(INR deprecation).
Revenues grew by 26% YoY (+2.3% QoQ) to INR104.7b (v/s est INR100.5b).
Trend in segmental-volumes and market share
('000 units)
A1
% of total
MPV
% of total
A2
% of total
A3
% of total
UV
% of total
Exports
% of total
Total Sales
Total PV (Incl Exports) MS (%)
Total Dom. Car MS (%)
Total PV MS (%)
Source: MOSL, Company
2QFY14 2QFY13 YoY (%) 1QFY14 QoQ (%)
4.8
1.7
24.3
8.8
154.0
55.9
46.7
17.0
11.8
4.3
34.0
12.3
275.6
37.1
49.0
42.1
4.2
1.8
31.1
13.5
125.6
54.5
27.6
12.0
21.4
9.3
20.4
8.9
230.5
31.0
38.2
34.4
13.7
-22.0
22.6
69.3
-44.9
66.6
19.6
610bp
1,080bp
770bp
4.6
1.7
22.7
8.5
152.7
57.3
50.7
19.0
14.6
5.5
21.1
7.9
266.5
36.1
48.2
40.6
3.1
6.9
0.9
-7.8
-19.4
61.3
3.4
100bp
80bp
140bp
FY13
17.7
1.5
110.5
9.4
667.1
57.0
176.3
15.0
79
6.8
120.4
10.3
1,171.3
36.7
46.2
39.8
YoY (%)
-23.7
-23.3
-5.2
37.6
1,113.7
-5.5
3.3
40bp
380bp
130bp
Trend in market share
Trend in volumes
Source: MOSL, Company
28 October 2013
2

Maruti Suzuki
Trend in realizations
Trend in discounts/unit
Source: MOSL, Company
EBITDA margin improves on favorable Fx, partially reversible going forward
EBITDA grew by 160% YoY to INR 13.2b (v/s est INR9.7b), translating into EBITDA
margins of 12.6% (+120bp QoQ and 650bp YoY), driven by favorable Fx.
Last year’s operations were impacted by Manesar labour issues, hence such
strong growth on a YoY basis.
EBITDA margin improvement was entirely driven by reduction in RM cost. RM
cost declined by 260bp QoQ led by 100bp favorable fx on vendors import
(quarter lag), higher export revenues (INR depreciation, 70-80bp) and low cost
inventory of direct imports (timing mis-match; expected to reverse in 3Q).
Staff cost had 50bp one-off impact (annual payouts). Royalty stood at 6.5%
(6.1% in 1Q).
Average discounts per vehicle increased by INR4,000 to INR17,500/unit in 2Q.
Other income stood at INR1b (v/s est INR2.1b). Due to investments in FMPs,
other income has been lumpy in nature over the last few quarters.
Trend in discounts (% of PBT)
Trend in EBITDA
Source: MOSL, Company
Expect reversal of 2QFY14 Fx benefits in 3QFY14
Based on current Fx rates, we expect Fx to have negative impact on 3QFY14
profitability.
Vendor imports would have negative contribution of ~145bp QoQ, based on
average JPYINR rate of 2QFY14 of 0.63 (v/s 0.56 in previous quarter).
Further, direct imports would see negative impact of 25-50bp, based on hedged
rate of JPY/USD and USD/INR.
3
28 October 2013

Maruti Suzuki
Based on current USD/INR rates, exports would be neutral to profitability as
2QFY14 realized USD/INR on exports was 61-62.
Beyond Fx, commencement of Manesar Line-C assembly and Gurgaon diesel
plant in Sep-13 would have impact on fixed costs and depreciation.
However, these negative factors would be diluted by operating leverage driven
by ~10% higher volume in 2HFY14 over 1HFY14.
FX volatility reduces earnings visibility, but localization drive to improve
operating competitiveness
Considering over 25% of sales as net Fx payable, MSIL’s earnings have exhibited
high volatility and reduced earnings visibility. For 2QFY14, we estimate Fx to
have contributed over 200bp to QoQ margin improvement.
JPY/USD exposure for direct imports and royalty hedged for remainder FY14 at
98-100, and USD/INR exposure on direct imports/royalty is hedged for 3QFY14.
While JPY/USD exposure for vendor imports and entire USD/INR exposure for
4QFY14 remains unhedged.
On constant currency basis, it expects to reduce import content (ex-royalty) to
~16.5% by FY14 v/s 19.5% as of 4QFY13 at JPY/INR of 0.57 (v/s 26% for FY12).
However, current JPY/INR of 0.63 would dilute benefit of localization.
The management is focused on reducing import content by 2-2.5% annually
from 19.5%. Depending on component/technology, around 10-20% cost savings
can be expected from localization.
Our estimates factor in for JPY/INR of 0.617/0.625 for FY14/15 and factors in for
2% reduction in import content in FY14/FY15.
Other highlights from the call
Industry to decline by 3-5% in FY14; MSIL expected to outperform. Festive sales
so far have risen by 5-8%; seasonally 2H expected to be better by 10%.
Rural grew by 24% during 1HFY14; contributing 31% to MSIL sales.
Finance availability remains good, although there are some signs of liquidity
concern. It has not yet seen any impact of RBI’s ban on subvention on financing.
Diesel share stood at 30% (v/s 34% in 1Q). Avg. discounts increased sequentially
by INR4,000 to INR17,500/unit in 2Q.
Post completion of homologation process in key export markets, it is witnessed
good traction in exports in countries like Bolivia, Israel, Asean countries etc.
Europe now constitutes ~30% of exports.
Price hike effective Oct-13 by 0.7-0.8%.
MSIL commenced 3
rd
assembly line at Manesar (250,000 capacity) and diesel
engine plant (150,000 units) during Sep-13.
It has deferred its capex plans of line-2 of diesel engine unit at Gurgaon plant
due to market conditions. Also, it is yet to start work on Gujarat plant. For FY14,
planned capex is ~INR35b (of which ~INR17b already spent in 1HFY14).
Its diesel engine sourcing arrangement with Fiat doesn’t have any take or pay
clause, giving it flexibility to reduce sourcing from Fiat if demand is weak.
28 October 2013
4

Maruti Suzuki
Valuation and view: Upgrading EPS on back of Fx, demand recovery key to
stock performance
We are upgrading our EPS estimates for FY14/FY15 by 22%/7% to ~INR96/108
respectively, to factor in for a) exceptional strong 2QFY14 performance, b)
hedges for 2HFY14 and c) benefit of cost saving initiatives. We factor in for
volume growth of -1.5%/12.8%, EBITDA margins of 11.9%/11.7% and JPY/INR of
0.617/0.625 in FY14/FY15.
Although short-term outlook remains cautious, demand recovery would be
critical for stock performance from here on.
Forex volatility provides volatility and lack of visibility on earnings, resulting in
wild swings in estimates. Management’s efforts to improve localization would
help to reduce earnings volatility and improve visibility, and in turn drive re-
rating of the stock in the long run.
The stock trades at 15.7x/14x FY14E/15E consol. EPS and 9.1x/8x FY14E/15E
cash EPS. Maintain
Buy
with revised price target of INR1,702 (~9x FY15
CEPS/16x FY15 consol EPS).
Revised Forecast (INR b)
FY14E
Rev
Total Volumes ('000)
Domestic
Exports
Net Sales
EBITDA Margin (%)
PAT
Consol EPS (INR)
Cash EPS (INR)
1,154
1,037
117
430
11.9
28.7
96.3
166.9
Old
1,154
1,037
117
431
10.2
23.5
79.1
149.6
Chg (%)
0.0
0.0
0.0
-0.4
170bp
22.2
21.8
11.5
Rev
1,303
1,172
131
494
11.7
32.6
108.0
189.1
FY15E
Old
1,303
1,172
131
498
11.0
30.6
101.2
182.3
Chg (%)
0.0
0.0
0.0
-0.8
70bp
6.7
6.7
3.7
28 October 2013
5

Maruti Suzuki
Maruti Suzuki: an investment profile
Company description
Maruti Suzuki is the largest passenger vehicle
manufacturer in India, with 1.2m units. It dominates the
domestic cars segment with ~41% market share. It is
also emerging as the global export hub of small cars for
Suzuki, with world strategic model A-Star exclusively
produced in India. It has recently launched Ertiga and
new Alto 800. Its two plants are in Haryana - Gurgaon
and Manesar.
Recent developments
MSIL recently expanded its Manesar plant (0.25m
units capacity) and diesel engine plant at Gurgaon
(0.15m units of capacity) in Sep-13.
Average price hike effective Oct-13 of 0.7-0.8%.
Valuation and view
Key investment arguments
The stock trades at 15.7x/14x FY14E/15E consol.
EPS and 9.1x/8x FY14E/15E cash EPS.
Maintain
Buy
with revised price target of INR1,702
(~9x FY15 CEPS/16x FY15 consol EPS).
Volumes momentum to remain intact in long run,
despite short-term headwinds, resulting in 12-15%
volume in the long run
Volume growth in domestic market driven by focus
on tier-II cities and rural market, recent launches
and increase in diesel engine capacity.
Improving product mix with increasing share of A2,
A3 and UV segment, driven by newer products.
Higher fuel prices can continue to impact demand
for entry level cars
Increasing competition in the key segments.
Adverse forex movement may impact margins
negatively.
Sector view
Key investments risks
Short term pressure notwithstanding, passenger
vehicle segment is expected to continue its growth
momentum over medium to long term.
With low car penetration levels and rising income
levels, the upside potential for growth is
tremendous.
However, increasing competition poses threat in
long term.
Comparative valuations
Maruti
P/E (x)
EPS Gr (%)
RoE (%)
EV/EBITDA (x)
FY14E
FY15E
FY14E
FY15E
FY14E
FY15E
FY14E
FY15E
15.7
14.0
20.1
12.1
13.6
13.6
7.2
6.0
M&M
15.1
14.1
-5.6
7.0
19.8
18.5
7.6
4.9
Tata
Motors
10.5
8.8
12.0
19.2
23.9
22.4
4.2
3.5
EPS: MOSL forecast v/s consensus (INR)
MOSL
Forecast
FY14
FY15
95.0
108.0
Consensus
Forecast
95.5
112.9
Variation
(%)
-0.5
-4.3
Target price and recommendation
Current
Price (INR)
1,513
Target
Price (INR)
1,702
Upside
(%)
12.5
Reco.
Buy
Shareholding pattern (%)
Promoter
Domestic Inst
Foreign
Others
Sep-13
56.2
15.4
19.7
8.7
Jun-13
56.2
13.1
22.1
8.6
Sep-12
54.2
16.2
20.5
9.1
Stock performance (1-year)
28 October 2013
6

Maruti Suzuki
Financials and valuation
Income statement
Y/E March
Net Sales
Change (%)
EBITDA
EBITDA Margin (%)
Depreciation
EBIT
Interest
Other Income
Extraordinary items
PBT
Tax
Tax Rate (%)
Reported PAT
Adjusted PAT
Change (%)
Min. Int. & Assoc. Share
Adj Cons PAT
(INR Million)
2012
2013
2014E
2015E
347,059 426,126 429,514 493,604
-4
23
1
15
25,130 42,296 52,394 59,073
7.1
9.7
11.9
11.7
11,384 18,612 21,307 24,493
13,747 23,684 31,088 34,580
552
1,898
1,829
1,829
8,268
8,124
8,800 10,175
0
0
0
0
21,463 29,910 38,059 42,926
5,110
5,989
9,363 10,302
23.8
20.0
24.6
24.0
16,353 23,921 28,696 32,624
16,353 23,921 28,696 32,624
-29
46
20
14
0
0
0
0
16,353 23,921 28,696 32,624
Ratios
Y/E March
Basic (INR)
EPS
Cash EPS
Book Value
DPS
Payout (incl. Div. Tax.)
Valuation(x)
P/E
Cash P/E
Price / Book Value
EV/Sales
EV/EBITDA
Dividend Yield (%)
Profitability Ratios (%)
RoE
RoCE
Turnover Ratios (%)
Asset Turnover (x)
Debtors (No. of Days)
Inventory (No. of Days)
Debtors (No. of Days)
Leverage Ratios (%)
Net Debt/Equity (x)
2012
56.6
96.0
525.7
56.6
15.4
26.7
15.8
2.9
1.2
16.9
0.5
11.3
8.9
2.3
9.6
18.4
9.6
0.1
2013
79.2
140.8
615.0
79.2
11.7
19.1
10.7
2.5
1.1
11.0
0.5
14.2
12.8
2.3
11.9
15.4
11.9
0.1
2014E
95.0
165.5
697.2
95.0
13.5
15.9
9.1
2.2
1.0
8.6
0.7
14.5
14.3
2.0
11.0
16.0
11.0
0.1
2015E
108.0
189.1
791.2
108.0
12.9
14.0
8.0
1.9
0.8
7.2
0.8
14.5
14.2
2.1
11.0
16.0
11.0
0.1
Balance sheet
Y/E March
Share Capital
Reserves
Net Worth
Debt
Deferred Tax
Total Capital Employed
Gross Fixed Assets
Less: Acc Depreciation
Net Fixed Assets
Capital WIP
Investments
Current Assets
Inventory
Debtors
Cash & Bank
Loans & Adv, Others
Curr Liabs & Provns
Curr. Liabilities
Provisions
Net Current Assets
Total Assets
2012
1,445
150,429
151,873
11,749
3,023
166,646
147,347
72,140
75,207
9,419
61,474
76,922
17,965
9,376
24,362
25,220
56,376
15,892
6,985
20,546
166,647
2013
1,510
184,279
185,790
14,928
4,087
204,805
198,007
100,015
97,992
19,422
70,783
78,683
18,407
14,237
7,750
38,289
62,076
11,661
8,741
16,608
204,805
(INR Million)
2014E
2015E
1,510
1,510
209,088 237,499
210,599 239,010
14,928 14,928
4,087
4,087
229,613 258,024
232,429 267,429
121,322 145,815
111,107 121,614
15,000 10,000
70,783 70,783
93,847 123,668
19,271 22,095
13,249 15,190
23,038 48,094
38,289 38,289
61,124 68,041
11,661 11,661
9,717 10,810
32,723 55,627
229,613 258,024
E: MOSL Estimates
Cash flow statement
Y/E March
OP/(Loss) before Tax
Depreciation
Others
Interest
Direct Taxes Paid
(Inc)/Dec in Wkg Cap
CF from Op. Activity
(Inc)/Dec in FA & CWIP
(Pur)/Sale of Invt
Others
CF from Inv. Activity
Inc/(Dec) in Net Worth
Inc / (Dec) in Debt
Interest Paid
Divd Paid (incl Tax)
CF from Fin. Activity
Inc/(Dec) in Cash
Add: Opening Balance
Closing Balance
2012
21,462
11,384
0
-7,003
-2,509
2,265
25,599
-29,630
-1,328
0
-30,958
0
8,758
-426
-2,167
6,165
806
25,085
25,891
2013
29,910
18,612
0
-4,470
-5,333
5,123
43,842
-38,100
2,359
0
-35,741
0
-5,493
-2,003
-2,167
-9,663
-1,562
24,362
22,799
(INR Million)
2014E
31,088
21,307
0
8,800
-9,363
-827
51,004
-30,000
0
0
-30,000
0
0
-1,829
-3,888
-5,716
15,288
7,750
23,038
2015E
34,580
24,493
0
10,175
-10,302
2,152
61,098
-30,000
0
0
-30,000
0
0
-1,829
-4,213
-6,042
25,056
23,038
48,094
28 October 2013
7

Disclosures
This report is for personal information of the authorized recipient and does not construe to be any investment, legal or taxation advice to you. This research report does not constitute an offer, invitation or
inducement to invest in securities or other investments and Motilal Oswal Securities Limited (hereinafter referred as MOSt) is not soliciting any action based upon it. This report is not for public distribution
and has been furnished to you solely for your information and should not be reproduced or redistributed to any other person in any form.
Unauthorized disclosure, use, dissemination or copying (either whole or partial) of this information, is prohibited. The person accessing this information specifically agrees to exempt MOSt or any of its
affiliates or employees from, any and all responsibility/liability arising from such misuse and agrees not to hold MOSt or any of its affiliates or employees responsible for any such misuse and further agrees
to hold MOSt or any of its affiliates or employees free and harmless from all losses, costs, damages, expenses that may be suffered by the person accessing this information due to any errors and delays.
The information contained herein is based on publicly available data or other sources believed to be reliable. While we would endeavour to update the information herein on reasonable basis, MOSt and/or
its affiliates are under no obligation to update the information. Also there may be regulatory, compliance, or other reasons that may prevent MOSt and/or its affiliates from doing so. MOSt or any of its
affiliates or employees shall not be in any way responsible and liable for any loss or damage that may arise to any person from any inadvertent error in the information contained in this report. MOSt or any
of its affiliates or employees do not provide, at any time, any express or implied warranty of any kind, regarding any matter pertaining to this report, including without limitation the implied warranties of
merchantability, fitness for a particular purpose, and non-infringement. The recipients of this report should rely on their own investigations.
This report is intended for distribution to institutional investors. Recipients who are not institutional investors should seek advice of their independent financial advisor prior to taking any investment decision
based on this report or for any necessary explanation of its contents.
MOSt and/or its affiliates and/or employees may have interests/positions, financial or otherwise in the securities mentioned in this report. To enhance transparency, MOSt has incorporated a Disclosure of
Interest Statement in this document. This should, however, not be treated as endorsement of the views expressed in the report.
Disclosure of Interest Statement
1. Analyst ownership of the stock
2. Group/Directors ownership of the stock
3. Broking relationship with company covered
4. Investment Banking relationship with company covered
MARUTI SUZUKI INDIA LTD
No
No
No
No
Maruti Suzuki
Analyst Certification
The views expressed in this research report accurately reflect the personal views of the analyst(s) about the subject securities or issues, and no part of the compensation of the research analyst(s) was, is,
or will be directly or indirectly related to the specific recommendations and views expressed by research analyst(s) in this report. The research analysts, strategists, or research associates principally
responsible for preparation of MOSt research receive compensation based upon various factors, including quality of research, investor client feedback, stock picking, competitive factors and firm revenues.
This report is not directed or intended for distribution to or use by any person or entity resident in a state, country or any jurisdiction, where such distribution, publication, availability or use would be contrary
to law, regulation or which would subject MOSt & its group companies to registration or licensing requirements within such jurisdictions.
Regional Disclosures (outside India)
This report is intended for distribution only to persons having professional experience in matters relating to investments as described in Article 19 of the Financial Services and Markets Act 2000 (Financial
Promotion) Order 2005 (referred to as "investment professionals"). This document must not be acted on or relied on by persons who are not investment professionals. Any investment or investment activity
to which this document relates is only available to investment professionals and will be engaged in only with such persons.
For U.K.
Motilal Oswal Securities Limited (MOSL) is not a registered broker - dealer under the U.S. Securities Exchange Act of 1934, as amended (the"1934 act") and under applicable state laws in the United
States. In addition MOSL is not a registered investment adviser under the U.S. Investment Advisers Act of 1940, as amended (the "Advisers Act" and together with the 1934 Act, the "Acts), and under
applicable state laws in the United States. Accordingly, in the absence of specific exemption under the Acts, any brokerage and investment services provided by MOSL, including the products and services
described herein are not available to or intended for U.S. persons.
This report is intended for distribution only to "Major Institutional Investors" as defined by Rule 15a-6(b)(4) of the Exchange Act and interpretations thereof by SEC (henceforth referred to as "major
institutional investors"). This document must not be acted on or relied on by persons who are not major institutional investors. Any investment or investment activity to which this document relates is only
available to major institutional investors and will be engaged in only with major institutional investors. In reliance on the exemption from registration provided by Rule 15a-6 of the U.S. Securities Exchange
Act of 1934, as amended (the "Exchange Act") and interpretations thereof by the U.S. Securities and Exchange Commission ("SEC") in order to conduct business with Institutional Investors based in the
U.S., MOSL has entered into a chaperoning agreement with a U.S. registered broker-dealer, Motilal Oswal Securities International Private Limited. ("MOSIPL"). Any business interaction pursuant to this
report will have to be executed within the provisions of this chaperoning agreement.
The Research Analysts contributing to the report may not be registered /qualified as research analyst with FINRA. Such research analyst may not be associated persons of the U.S. registered broker-
dealer, MOSIPL, and therefore, may not be subject to NASD rule 2711 and NYSE Rule 472 restrictions on communication with a subject company, public appearances and trading securities held by a
research analyst account.
For U.S.
Motilal Oswal Capital Markets Singapore Pte Limited is acting as an exempt financial advisor under section 23(1)(f) of the Financial Advisers Act(FAA) read with regulation 17(1)(d) of the Financial
Advisors Regulations and is a subsidiary of Motilal Oswal Securities Limited in India. This research is distributed in Singapore by Motilal Oswal Capital Markets Singapore Pte Limited and it is only directed
in Singapore to accredited investors, as defined in the Financial Advisers Regulations and the Securities and Futures Act (Chapter 289), as amended from time to time.
In respect of any matter arising from or in connection with the research you could contact the following representatives of Motilal Oswal Capital Markets Singapore Pte Limited:
Kadambari Balachandran
Email : kadambari.balachandran@motilaloswal.com
Contact: (+65) 68189233 / 65249115
Office address: 21 (Suite 31), 16 Collyer Quay, Singapore 049318
For Singapore
Motilal Oswal Securities Ltd
28 October 2013
Motilal Oswal Tower, Level 9, Sayani Road, Prabhadevi, Mumbai 400 025
Phone: +91 22 3982 5500 E-mail: reports@motilaloswal.com
8