1 November 2013
2QFY14 Results Update | Sector:
Healthcare
Glenmark Pharma
BSE SENSEX
21,197
Bloomberg
Equity Shares (m)
52-Week Range (INR)
1, 6, 12 Rel.Per (%)
S&P CNX
6,307
GNP IN
271.0
612/418
-8/0/12
CMP: INR540
TP: INR610
Buy
M.Cap. (INR b) / (USD b) 146.4/2.4
Financials & Valuation (INR b)
Y/E MAR
Sales
EBITDA
Net Profit
Adj. EPS
(INR)
EPS Gr. (%)
BV/Sh.
(INR)
RoE (%)
RoCE (%)
Valuations
P/E (x)
29.3
23.0
4.4
13.0
0.6
17.7
3.6
11.2
0.7
P/BV (x)
5.3
EV/EBITDA 15.9
( )
Div.Yld (%) 0.4
2013 2014E 2015E
50.1
10.6
5.0
18.4
53.9
102.0
18.1
16.1
60.5
12.5
6.4
23.5
27.6
122.4
19.2
18.8
13.9
70.5
14.4
8.3
30.5
29.7
148.2
20.6
20.5
15.2
Payout (%) 10.2
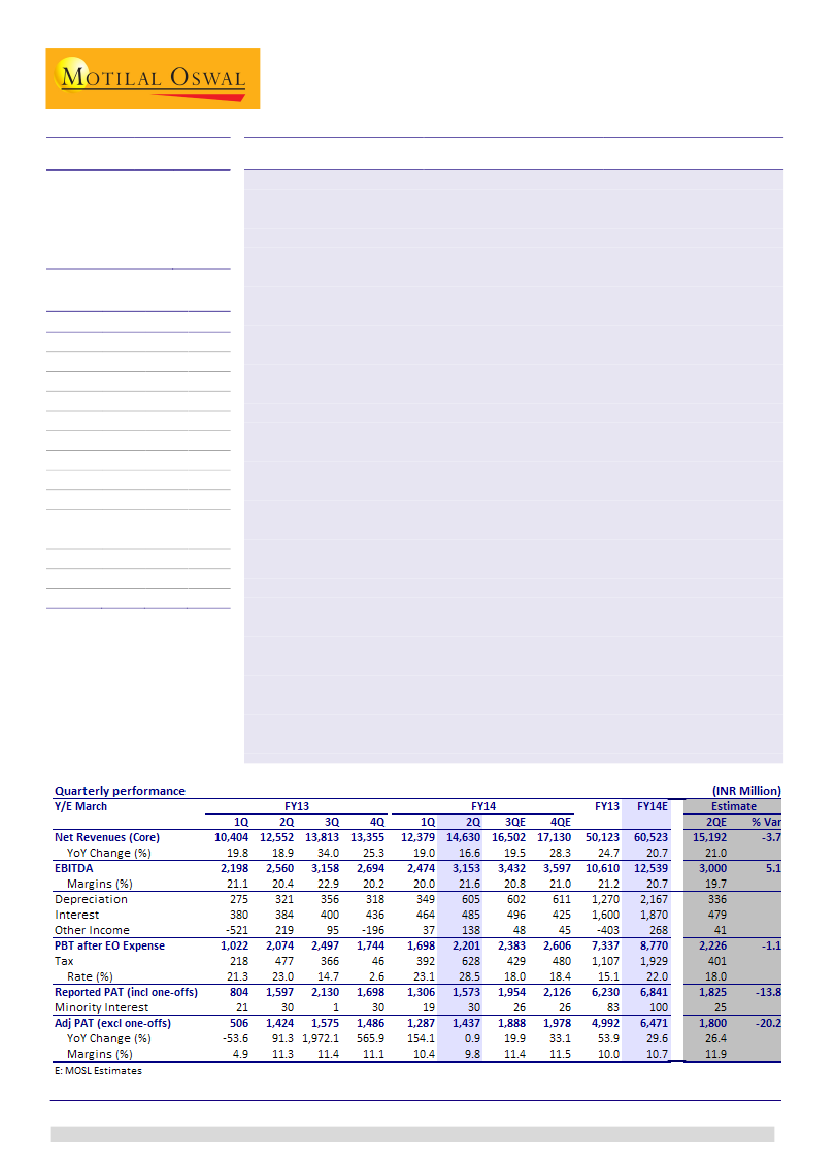
Operational performance in-line:
Glenmark (GNP) posted in-line operational
performance for 2QFY14. Core sales (excluding licensing income) grew 19% YoY to
INR14.5b (v/s our estimate of INR15.2b). Core EBITDA grew 28% YoY to INR3b (in
line) and core PAT grew 1% YoY to INR1.4b (v/s our estimate of INR1.8b). Licensing
income was INR118m (we had not anticipated any licensing income for the
quarter).
Sales growth in LatAm, semi-regulated markets slower than expected:
Sales
growth was driven by stronger than expected growth in domestic formulations (up
21% YoY) and US generics business (30% YoY, partly currency-led). In LatAm (down
3% YoY) and semi-regulated markets (down 11% YoY), sales growth was slower
than expected.
Adjusted PAT significantly below estimate:
Core EBITDA margin expanded 150bp
YoY to 20.9% (v/s 19.7%), driven by better sales mix, with increasing contribution
from recently launched products in the US. Adjusted PAT was significantly below
estimate despite strong EBITDA margin, due to higher depreciation and taxes
(effective tax rate at 28.5% v/s our estimate of 18%).
Guidance:
While GNP has maintained its 20% sales growth guidance for FY14, to
be driven by the US and India, it expects to exceed its earlier EBITDA guidance of
INR12.25b. On the negative side, GNP has raised its tax rate guidance to 22-23%
from 19%, and has indicated higher depreciation, going forward.
Cutting estimates; maintain Buy:
Post 2QFY14 results, we have cut our FY14/FY15
EPS estimates by 7%/4%, mainly due to higher depreciation and tax expense,
despite estimating higher EBITDA growth. We expect GNP to gradually reduce its
net debt over FY14-15, resulting in D/E improving from 1x in FY13 to 0.6x by FY15.
GNP has differentiated itself among Indian pharmaceutical companies through its
significant success in NCE research (resulting in licensing income of USD205m till
date). Given this success, GNP has been aggressive in adding new NCEs to its
pipeline, which will put pressure on its operations in short-to-medium term, as it
will have to fund R&D expenses for these NCEs. The stock trades at 23x FY14E and
17.7x FY15E EPS. Maintain
Buy
with a revised target price of INR610.
Alok Dalal(Alok.Dalal@MotilalOswal.com);+91
22 3982 5584
Hardick Bora(Hardick.Bora@MotilalOswal.com);+91
22 3982 5423
Investors are advised to refer through disclosures made at the end of the Research Report.

Glenmark Pharma
Core revenue was 5% below est. impacted by continued slowdown in SRMs
Net sales were up 17% YoY to INR14.6b (v/s our estimate of INR15.2b). Core
revenues (excl. one-offs) grew 19% YoY.
Sales growth was driven by stronger than expected growth in domestic formulations
(up 21% YoY v/s est. 13%) and US generics business (30% YoY v/s est. 23%). Sales
disappointment was led by slower than expected growth in semi-regulated markets
(down 11% YoY v/s est 30%) and LatAm (down 3% YoY v/s est. 17% growth).
Revenue mix
(INR m)
Formulations
Branded
India
Europe-branded
Latam-branded
Semi-regulated mkts
Generics
Latin America
North America
Europe
API & others
NCE Income
Net Sales
2QFY14
13,501
7,339
4,177
527
900
1,736
6,162
66
5,579
517
1,011
118
14,630
2QFY13
11,447
6,697
3,440
379
937
1,941
4,749
54
4,307
389
1,105
0
12,552
16.6
% YoY
17.9
9.6
21.4
38.9
-4.0
-10.6
29.7
23.4
29.5
33.1
-8.5
1QFY14
11,046
6,074
3,286
261
841
1,686
4,972
37
4,470
465
1,333
0
12,379
18.2
% QoQ
22.2
20.8
27.1
101.5
6.9
3.0
23.9
79.1
24.8
11.2
-24.2
However, core EBITDA was in line; aided by better sales mix
We estimate core EBITDA to have grown 28% YoY to INR3b (in line), with core
EBITDA margins expanding 150bps YoY to 20.9% (v/s est. 19.7%). Improvement was
driven by better sales mix with increasing contribution from recently launched
products in US.
Adjusted PAT stood at INR1.4b (v/s est. INR1.8b), up 1% YoY. PAT is below our
estimate due to higher depreciation and tax rate (at 28.5% v/s est. 18%).
EBITDA TREND
Source: MOSL, Company
1 November 2013
2

Glenmark Pharma
Key highlights from 2QFY14 Concall
India:
GNP continues to outpace the industry growth rate as some of its peers
have reported a dismal quarter for this segment. The management has
maintained its guidance of 18-20% growth for FY14E. As such, GNP will continue
to outperform the average industry growth rates as it expects negligible impact
from the pricing policy.
USA:
As expected, US generics have shown revival in strong, aided by new
launches. During the quarter, GNP filed for 2 ANDAs and has received approval
for 4 products. Management expects 18-20% growth in constant currency in
FY14E. GNP has 53 ANDAs pending approval with the US FDA. Management
expects 3-4 large product launches every year that can drive growth, although
their commercialization is subject to timely approval.
LatAm and Semi-regulated markets:
The management expects 20-25% from
Latin American market. Brazil is the largest and most important market which is
lagging. This will be offset stronger growth in other LatAm markets. Growth in
other semi-regulated markets is expected between 13-15%.
The company now expects to exceed its
earlier EBITDA
guidance of INR12.25b
for FY14E. Excluding the impact of out-licensing income in FY13, this implies
more than 21% YoY growth in core EBITDA.
Gross debt
has reduced from INR100m on constant currency terms to
INR21.35b. Cash & equivalents on books have increased from INR6b to INR10b,
which is set aside to retire debt. The company maintained that focus is on
lowering absolute debt as opposed reducing the gearing.
Depreciation
for quarter has increased due to (1) increased amortization and (2)
commissioning of facilities. CWIP has of ~INR2b has been commercialized which
is now subject to depreciation. Upfront payment made on in-licensed products
launched in Central Eastern Europe is being amortized. As such, depreciation
base will be formed at INR600m/quarter up from the INR350m run-rate.
R&D costs
are guided to be between 9-9.5% of sales;
Capex guidance
stands at
INR3-3.5b.
Trying to build a differentiated portfolio for the US market – Expect strong
growth ahead
Glenmark currently has ~53 ANDAs pending US FDA approval. It has already
launched 12-15 oral contraceptives (OCs) in the US over the last two years.
We note that the company is focussing on niche opportunities in the
Dermatology, Controlled Substances and Oncology space and has also started
receiving some approvals in these categories which is a long-term positive.
Strong guidance of 20 ANDA filings (more than half of them in niche segments),
indicates that the company is investing to build a healthy product pipeline to
support long-term growth.
Management has indicated that ~75% of the total pending ANDAs are in the
niche / low-competition category and will thus result in a differentiated
portfolio in the long-term.
1 November 2013
3

Glenmark Pharma
Glenmark - US Revenue ramp-up (USD m)
Source: MOSL, Company
Sustained growth momentum in India formulations business
GNP has recorded a strong 20% CAGR for its India formulations (DF) business
over the past five years with 31% YoY growth in FY13.
As per MAT September 2013 IMS data, GNP has grown by more than 5% faster
than the industry. GNP has also gained 2 ranks to be 19th in the industry.
With negligible impact expected from the Pharma Pricing Policy, we believe the
company will continue to outperform the domestic market in the near term.
We expect the company to outperform the average industry growth of 14-15%
over the next two years.
Glenmark - Sustained growth in India formulations business
Source: MOSL, Company
1 November 2013
4

Glenmark Pharma
Improvement in return ratios – driven by shorter working capital cycles and
debt reduction
Return ratios are expected to gradually improve over the next two years with
RoCE estimated to improve from 16% to 21% and RoE expected to improve from
18% to 22%.
The improvement will be primarily driven by improved working capital and
expected reduction in debt coupled with sustained growth momentum.
We also expect the company to gradually reduce its debt/equity from 1x in FY13
to 0.6x by FY15E.
Return ratios likely to improve over next two years
Net Working Capital (days) (Ex-NCE income)
Source: Company, MOSL
Valuation and view
GNP is likely to report the NCE clinical data for various NCEs by end of FY14. This
will be an important news-flow to track as favorable data can facilitate potential
out-licensing deals. However, our estimates exclude these upsides.
GNP has differentiated itself among Indian pharmaceutical companies through
its significant success in NCE research (resulting in licensing income of USD205m
till date). Given this success, Glenmark has been aggressive in adding new
molecules to its pipeline, which will put pressure on its operations in short-to-
medium term as it will have to fund R&D expenses for these NCEs.
Post 2QFY14 results, we have lowered our EPS estimates by 7%/4%, mainly due
to higher depreciation and tax expense, despite estimating higher EBITDA
growth.
The stock currently trades at 23x FY14E and 17.7x FY15E EPS. Maintain
Buy
with
target price of INR610 (19x FY15 EPS + INR17 DCF value for Crofelemer & Para-IV
upsides).
1 November 2013
5

Glenmark Pharma
Glenmark Pharma: an investment profile
Company description
Glenmark is one of the second tier integrated
pharmaceutical companies which has differentiated
itself through its success in NCE research. The company
has pipeline of 5 Novel drugs in different phases of
clinical studies. It is also one of the leading Indian
generic companies in US with focus on niche generics
segments. Glenmark has large presence in semi-
regulated markets.
Recent developments
None.
Valuation and view
The stock currently trades at 23x FY14E and 17.7x
FY15E with improving return rations.
Buy with target price of INR610 (19x FY15E EPS +
DCF value of INR16/sh for Crofelemer and Para-IV
upsides).
Key investment arguments
Sector view
Glenmark has adopted differentiated generic
strategy for US business which focuses on niche
segments like Hormones, dermatology, controlled
release etc which has limited competition and
better profitability.
It is the most successful Indian company in novel
drug discovery research and has earned US$205m in
milestone payments so far.
Differentiated portfolio in regulated markets and
emerging markets would remain the key sales and
profit drivers in the medium term. Japan is expected
to emerge as the next growth driver, particularly for
companies with a direct marketing presence.
We are overweight on companies that are towards
the end of the investment phase, with benefits
expected to start coming in from the next fiscal.
Key investment risks
Given the significant contribution of the success of
Glenmark's NCE research (to its market
capitalization); any NCE failures are likely to have
significant adverse impact on investor returns.
Comparative valuations
P/E (x)
P/BV (x)
EV/Sales (x)
EV/EBITDA (x)
FY14E
FY15E
FY14E
FY15E
FY14E
FY15E
FY14E
FY15E
Glenmark
23.0
17.7
4.4
3.6
2.7
2.3
13.0
11.2
DRL
21.5
18.7
4.6
3.8
3.1
2.7
14.3
12.2
Cipla
20.3
18.2
3.2
2.7
3.2
2.8
13.8
12.4
EPS: MOSL forecast v/s consensus (INR)
MOSL
Forecast
FY14
FY15
23.5
30.5
Consensus
Forecast
27.8
34.1
Variation
(%)
-15.5
-10.7
Target price and recommendation
Current
Price (INR)
540
Target
Price (INR)
610
Upside
(%)
13.0
Reco.
Buy
Shareholding pattern (%)
Sep-13
Promoter
Domestic Inst
Foreign
Others
48.3
7.4
34.0
10.4
Jun-13
48.3
7.1
34.3
10.3
Sep-12
48.3
6.7
33.7
11.3
Stock performance (1-year)
1 November 2013
6

Glenmark Pharma
Financials and valuation
1 November 2013
7

Disclosures
This report is for personal information of the authorized recipient and does not construe to be any investment, legal or taxation advice to you. This research report does not constitute an offer, invitation or
inducement to invest in securities or other investments and Motilal Oswal Securities Limited (hereinafter referred as MOSt) is not soliciting any action based upon it. This report is not for public distribution
and has been furnished to you solely for your information and should not be reproduced or redistributed to any other person in any form.
Unauthorized disclosure, use, dissemination or copying (either whole or partial) of this information, is prohibited. The person accessing this information specifically agrees to exempt MOSt or any of its
affiliates or employees from, any and all responsibility/liability arising from such misuse and agrees not to hold MOSt or any of its affiliates or employees responsible for any such misuse and further agrees
to hold MOSt or any of its affiliates or employees free and harmless from all losses, costs, damages, expenses that may be suffered by the person accessing this information due to any errors and delays.
The information contained herein is based on publicly available data or other sources believed to be reliable. While we would endeavour to update the information herein on reasonable basis, MOSt and/or
its affiliates are under no obligation to update the information. Also there may be regulatory, compliance, or other reasons that may prevent MOSt and/or its affiliates from doing so. MOSt or any of its
affiliates or employees shall not be in any way responsible and liable for any loss or damage that may arise to any person from any inadvertent error in the information contained in this report. MOSt or any
of its affiliates or employees do not provide, at any time, any express or implied warranty of any kind, regarding any matter pertaining to this report, including without limitation the implied warranties of
merchantability, fitness for a particular purpose, and non-infringement. The recipients of this report should rely on their own investigations.
Glenmark Pharma
This report is intended for distribution to institutional investors. Recipients who are not institutional investors should seek advice of their independent financial advisor prior to taking any investment decision
based on this report or for any necessary explanation of its contents.
MOSt and/or its affiliates and/or employees may have interests/positions, financial or otherwise in the securities mentioned in this report. To enhance transparency, MOSt has incorporated a Disclosure of
Interest Statement in this document. This should, however, not be treated as endorsement of the views expressed in the report.
Disclosure of Interest Statement
1. Analyst ownership of the stock
2. Group/Directors ownership of the stock
3. Broking relationship with company covered
4. Investment Banking relationship with company covered
GLENMARK PHARMACEUTICALS LTD
No
No
No
No
Analyst Certification
The views expressed in this research report accurately reflect the personal views of the analyst(s) about the subject securities or issues, and no part of the compensation of the research analyst(s) was, is,
or will be directly or indirectly related to the specific recommendations and views expressed by research analyst(s) in this report. The research analysts, strategists, or research associates principally
responsible for preparation of MOSt research receive compensation based upon various factors, including quality of research, investor client feedback, stock picking, competitive factors and firm revenues.
This report is not directed or intended for distribution to or use by any person or entity resident in a state, country or any jurisdiction, where such distribution, publication, availability or use would be contrary
to law, regulation or which would subject MOSt & its group companies to registration or licensing requirements within such jurisdictions.
Regional Disclosures (outside India)
This report is intended for distribution only to persons having professional experience in matters relating to investments as described in Article 19 of the Financial Services and Markets Act 2000 (Financial
Promotion) Order 2005 (referred to as "investment professionals"). This document must not be acted on or relied on by persons who are not investment professionals. Any investment or investment activity
to which this document relates is only available to investment professionals and will be engaged in only with such persons.
For U.K.
Motilal Oswal Securities Limited (MOSL) is not a registered broker - dealer under the U.S. Securities Exchange Act of 1934, as amended (the"1934 act") and under applicable state laws in the United
States. In addition MOSL is not a registered investment adviser under the U.S. Investment Advisers Act of 1940, as amended (the "Advisers Act" and together with the 1934 Act, the "Acts), and under
applicable state laws in the United States. Accordingly, in the absence of specific exemption under the Acts, any brokerage and investment services provided by MOSL, including the products and services
described herein are not available to or intended for U.S. persons.
This report is intended for distribution only to "Major Institutional Investors" as defined by Rule 15a-6(b)(4) of the Exchange Act and interpretations thereof by SEC (henceforth referred to as "major
institutional investors"). This document must not be acted on or relied on by persons who are not major institutional investors. Any investment or investment activity to which this document relates is only
available to major institutional investors and will be engaged in only with major institutional investors. In reliance on the exemption from registration provided by Rule 15a-6 of the U.S. Securities Exchange
Act of 1934, as amended (the "Exchange Act") and interpretations thereof by the U.S. Securities and Exchange Commission ("SEC") in order to conduct business with Institutional Investors based in the
U.S., MOSL has entered into a chaperoning agreement with a U.S. registered broker-dealer, Motilal Oswal Securities International Private Limited. ("MOSIPL"). Any business interaction pursuant to this
report will have to be executed within the provisions of this chaperoning agreement.
The Research Analysts contributing to the report may not be registered /qualified as research analyst with FINRA. Such research analyst may not be associated persons of the U.S. registered broker-
dealer, MOSIPL, and therefore, may not be subject to NASD rule 2711 and NYSE Rule 472 restrictions on communication with a subject company, public appearances and trading securities held by a
research analyst account.
For U.S.
Motilal Oswal Capital Markets Singapore Pte Limited is acting as an exempt financial advisor under section 23(1)(f) of the Financial Advisers Act(FAA) read with regulation 17(1)(d) of the Financial
Advisors Regulations and is a subsidiary of Motilal Oswal Securities Limited in India. This research is distributed in Singapore by Motilal Oswal Capital Markets Singapore Pte Limited and it is only directed
in Singapore to accredited investors, as defined in the Financial Advisers Regulations and the Securities and Futures Act (Chapter 289), as amended from time to time.
In respect of any matter arising from or in connection with the research you could contact the following representatives of Motilal Oswal Capital Markets Singapore Pte Limited:
Anosh Koppikar
Kadambari Balachandran
Email : anosh.koppikar@motilaloswal.com
Email : kadambari.balachandran@motilaloswal.com
Contact: (+65) 68189232
Contact: (+65) 68189233 / 65249115
Office address: 21 (Suite 31), 16 Collyer Quay, Singapore 049318
For Singapore
Motilal Oswal Securities Ltd
1 November 2013
Motilal Oswal Tower, Level 9, Sayani Road, Prabhadevi, Mumbai 400 025
Phone: +91 22 3982 5500 E-mail: reports@motilaloswal.com
8