29 October 2013
2QFY14 Results Update | Sector:
Metals
JSW Steel
BSE SENSEX
20,929
Bloomberg
Equity Shares (m)
52-Week Range (INR)
1, 6, 12 Rel. Per (%)
S&P CNX
6,221
JSTL IN
241.7
894/452
11/15/5
CMP: INR861
TP: INR510
Sell
Strong performance helped by exports
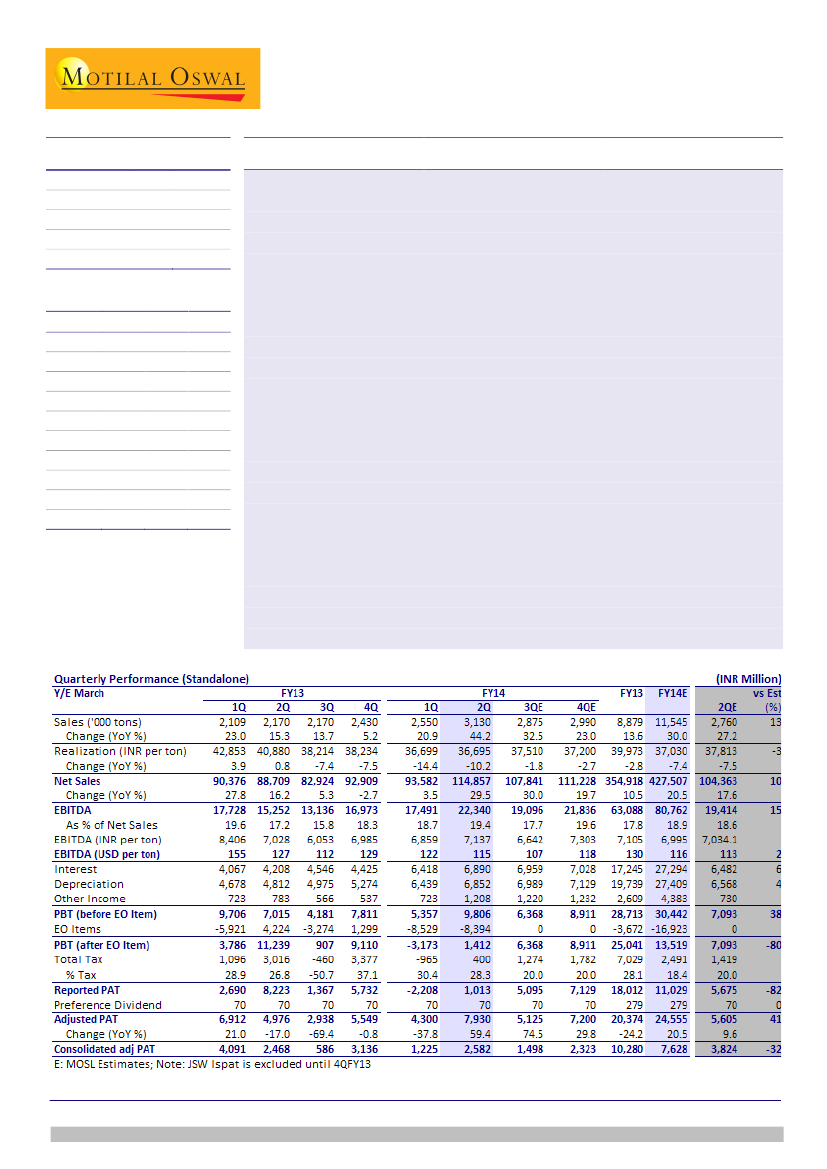
JSW Steel reported strong growth in sales volume and EBITDA driven by exports.
Margins too improved due to various improvements in operations.
Adjusted standalone PAT increased 84% QoQ to INR7.9b, i.e. 41% above est.
largely due to stronger than expected sales volumes on account of liquidation of
inventories.
Consolidated adj. PAT increased 111% QoQ to INR2.6b. Performance of
subsidiaries was still a drag. Reported consolidated PAT (post MI &asso.) of
INR1.15b included forex loss of INR8.5b.
Forex loss was aggravated due to mid quarter change in hedging strategies. JSW
steel is now fully hedging short term forex borrowing and corresponding forward
export revenues. This will better reflect actual business margins, in our view.
Net debt on balance sheet is ~INR400b (including acceptances), which is higher
than our estimate for FY14 end of INR378b. Net debt on balance sheet may
further increase despite cut in capex. Net working capital is likely to rise due to
stretching of credit period by domestic customer.
Weakening steel prices in international market and appreciation of USD/INR rate
is shrinking the export opportunity. Although Indian steel demand is expected to
improve in 2HFY14 due to seasonal factors, yet the import pressure/reducing
exports trend is likely to put pressure on domestic steel prices.
JSW steel continues to improve its operation through right strategic investments,
yet the ballooning debt keeps eroding equity value. Stock trades at FY15
EV/EBTIDA of 6.6x. We value the stock at INR510/share based on SOTP.
Sell.
M.Cap. (INR b) / (USD b) 208.1/3.4
Financials & Valuation (INR Billion)
Y/E MAR
Net Sales
EBITDA
Adj PAT
Adj.EPS
(INR)
Growth
(%)
BV/Share
(INR)
RoE (%)
RoCE (%)
P/E (x)
P/BV (X)
2013
382.1
65.0
8.9
49.7
-25.3
764.8
7.7
8.4
17.3
1.1
2014E 2015E
483.0
85.7
2.4
31.6
-36.5
680.5
11.5
10.1
27.3
1.3
489.8
88.5
7.1
43.8
38.8
696.0
9.2
9.5
19.7
1.2
Sanjay Jain
(SanjayJain@MotilalOswal.com); +91 22 3982 5412
Pavas Pethia
(Pavas.Pethia@MotilalOswal.com); +91 22 3982 5413
Investors are advised to refer through disclosures made at the end of the Research Report.

JSW Steel
Standalone: volumes boosted by increased export opportunity
Export sales volumes
increased 133% QoQ to
840kt
Various improvement in
operational efficiencies
helped margin
Mid quarter change in
hedging policy resulted in
higher forex loss
Net sales increased 23% QoQ to INR115b driven by corresponding growth in
volumes. Sale volumes increased 23% QoQ to 3.13m tons and were boosted by
liquidation of 290kt inventories. Crude steel production increased 4% QoQ to
2.98m tons.
Net sales realization remained flat QoQ at INR36,695/ton, despite a price hike of
about INR2000/ton in September on flat products and slightly lower price
increase on longer products. Prices were weaker in July and August as compared
to 1QFY14.
Sharp fluctuations in currency and firm steel prices in international market made
exports attractive. The share of exports in the revenue increased 10.9pp QoQ to
21.4% while export sales volumes increased 133% QoQ to 840kt (including of
200kt VAP).
Flat steel sales volume increased 23% QoQ to 2.59m ton, while long steel sales
volume increased 10% QoQ to 0.46m ton.
EBITDA increased 28% QoQ to INR22.34b (vs. est. of INR19.4b) driven by higher
volume growth and slight expansion in margin. EBITDA per ton increased 4%
QoQ to INR7,137 (-6% QoQ to USD115). Various operational improvements e.g.
dry quenching of coke, further increase in waste gases utilization, lime kiln,
relative reduction in raw material costs helped margins.
Adjusted standalone PAT increased 84% QoQ to INR7.9b, i.e. 41% above est.
largely due to stronger than expected sales volumes on account of liquidation of
inventories.
Standalone reported PAT of INR1b included INR8.4b of forex loss on account of
movement of USD/INR rate. Although net change in INR/USD rate was
~INR3/USD QoQ i.e. lower than ~INR5.1/USD in previous quarter, yet forex loss
was at similar levels as in 1QFY14.
Hedging policy was changed in the mid of quarter. Entire short term forex
borrowings (~USD1.9b) are being hedged now. Nearly 77% of short term forex
exposure was hedged at INR/USD rate of 65.7 at the end of September. Since
the quarter closed at INR/USD rate of 62.5 instead, there was an additional loss,
which explains the higher than estimated loss. Currently it has hedged 100% of
its short term exposure at INR/USD of 62.
Export revenues (6-9 months) to the extent of short term forex borrowings are
also being hedged thus neutralizing the cost of hedging. As a result, there will be
no forex loss or gain in P&L. The hedging costs will be reported in other
operating costs, while revenue will be impacted by forward exchange cover.
Consolidated: Subsidiaries performance remained a drag
Consolidated adjusted PAT increased 111% QoQ to INR2.6b driven by strong
standalone performance, while the performance of subsidiaries continues to
remain a drag.
All subsidiaries together contributed INR1.1b to EBITDA which is lower by 12%
QoQ.
Reported consolidated loss (post MI &asso.) of INR1.15b included forex loss of
INR8.5b. FY13 numbers are not comparable due to merger with JSW Ispat in
1QFY14.
2
29 October 2013

JSW Steel
Subsidiaries: EBITDA declined 12% QoQ
JSW coated (100% subs.) sold 0.35m tons of value added products and reported
EBITDA of INR780m. EBITDA per ton declined 17% QoQ to INR2,000/ton.
EBITDA contribution from other subsidiaries declined 30% QoQ to INR361m.
Chile iron ore operations reported USD5.34m of EBITDA (USD0.86m in 1QFY14)
on sale of 220kt iron ore.
US coal mines sold only 10kt coal and made EBITDA loss of 0.34m. US plate and
pipe mill utilization remains low, while EBITDA loss was USD2.05m. It doesn’t
have any plan to sell US assets and expect them to turnaround.
Quarterly performance (Subsidiaries)
Y/E March
FY13
1Q
2Q
Net Sales
8,723
6,428
EBITDA
1,357
61
JSW coated
US Mills
351
160
Chile iron ore
460
-4
US coal
PAT
-2,821
-2,508
3Q
5,955
175
-41
44
-2,352
4Q
6,073
359
25
270
-2,413
1Q
9,125
1,303
790
34
48
-20
-3,075
FY14
2Q
3Q
14,982
15,661
1,141
1,228
780
-127
332
-21
-5,348
-3,627
FY13
4Q
15,697
1,236
27,179
1,951
FY14E
55,465
4,908
-4,877
-10,094
-16,927
Source: Company, MOSL
Iron ore availability is gradually easing
11 mines in category A and 3 mines in category B are currently operational with
aggregate capacity of 6.4m ton. In addition, NMDC’s 2 mines are operating at 8-
9mtpa capacity.
Total 57 mines with cumulative capacity of 16m ton has got R&R approval from
CEC.
Currently it is procuring 10-12% of its iron ore requirement for Vijaynagar plant
from outside Karnataka. Cost of iron ore was ~INR3,000/t. Dolvi and Salem
plants are completely dependent on other states for supply of iron ore.
Iron ore availability is easing gradually. Auction of iron ore dumps has already
started in Karnataka.
Rising debt and weaker steel prices will pressure equity value
Capex guidance cut
Net debt continues to rise
Margins to improve from
new projects
Capex guidance is cut by INR15b to INR40b for FY14 as it has shelved coke oven
and sinter plant expansion at Vijaynagar. FY15 capex guidance remains
unchanged at INR40b.
Net debt on balance sheet is INR400b, which is higher than our estimate for
FY14 end of INR378b. Net debt on balance sheet may further increase despite
cut in capex. Net working capital is likely to rise due to stretching of credit
period by domestic customer.
CRM-2
is being commissioned in phases. First coil was rolled in Oct 2013. Full
commissioning is expected by end of FY15. In the mean time, vendor approval
with OEMs will be secured. This mill be supplying higher value added products
to auto industry and is likely to earn better margins.
Dolvi Integration:
4mtpa pellet plant and 1mtpa coke oven at Dolvi is expected
to be commissioned by FY14 end. This is likely to boost margins of Dovli volumes
by INR3000-4000/ton. As a result, the overall margins will improve for the
company.
3
29 October 2013

JSW Steel
New hedging strategy will
more accurately reflect
business margins
The new hedging strategy will result in locking of forward USD revenues. In
other words, the revenue will reflect average USD/INR rate of past ~6 months.
Since the raw material costs too reflect average exchange rate of past 6months,
the reported EBITDA margins will more accurately reflect business margins.
Weakening steel prices in international market and appreciation of USD/INR
rate is shrinking the export opportunity. Although Indian steel demand is
expected to improve in 2HFY14 due to seasonal factors, yet the import
pressure/reducing exports trend is likely to put pressure on domestic steel
prices.
JSW steel continues to improve its operation through right strategic
investments, yet the ballooning debt keeps eroding equity value.
Stock trades at FY15 EV/EBTIDA of 6.6x. We value the stock at INR510/share
based on SOTP. Maintain Sell.
Target price calculations
Year
EBITDA
Target EBITDA multiple
Target EV
less: Net Debt (Rs m)
add: value of JSW Ispat
add: CWIP
Residual equity value
No. of shares
Target price
2013
65,039
5
325,196
292,123
16,064
65,972
115,109
223
516
2014E
85,670
5
428,352
378,167
75,972
126,157
242
522
2015E
88,500
5
442,502
375,177
55,972
123,296
242
510
Source: Company, MOSL
Import parity prices have
come off from peak due to
INR/USD appreciation and
weakening of international
market
HRC import parity prices (INR/T, excl. CVD, VAT)
43,000
41,000
39,000
37,000
35,000
33,000
31,000
HRC Mumbai
Source: MOSL
29 October 2013
4

JSW Steel
JSW Steel: an investment profile
Company description
JSW Steel demonstrated excellent project execution
skills over the past decade, growing its annual capacity
6x to 10m tons through brownfield expansions at
Vijaynagar. With the acquisition of Ispat Industries and
Salem Steel, it controls annual capacity of 14m tons. Its
main production facilities are located in proximity to
rich iron ore reserves in Karnataka. It has investments in
iron ore mining in Karnataka and Chile. Its other
overseas investments include plate and pipe mill
operations and coal mines in the US.
Key investment risks
High dependence on external sources for raw
material can put significant pressure on margins
and earnings growth.
Recent developments
ICICI Bank Limited has withdrawn the nomination
of Mrs. Zarin Daruwala from the Board of the JSW
Steel w.e.f. October 23, 2013.
Valuation and view
Key investment arguments
JSTL has the lowest conversion cost due to
operational efficiencies. Its strategic location near
the iron ore rich Bellary-Hospet belt helps it to keep
iron ore purchase costs low. However, the ban on
iron ore mining at Bellary and subsequent
unavailability of adequate quantity at lower cost
had derailed volume growth.
Earnings have high sensitivity to steel and raw
material prices due to high financial and operating
leverage.
Stock trades at FY15 EV/EBTIDA of 6.6x. We value
the stock at INR510/share based on SOTP.
Maintain
Sell.
Sector outlook
In 2QFY14 domestic steel prices were boosted by
incremental export demand due to INR
depreciation against USD. However INR
depreciating trend has somewhat reversed while
domestic demand continue to remain subdued.
Steel prices have already started to correct with
long product prices witnessing higher level of
correction as compared to flat steel prices. We
maintain our bearish view on ferrous companies
under our coverage universe.
Comparative valuations
JSW
Steel
27.3
19.7
1.3
1.2
1.2
1.2
6.8
6.6
SAIL
7.5
11.1
0.6
0.6
1.0
1.1
8.2
8.8
TATA
Steel
9.6
9.9
1.4
1.3
0.7
0.7
6.2
6.5
EPS: MOSL forecast v/s consensus (INR)
MOSL
Forecast
FY14
FY15
31.6
43.8
Consensus
Forecast
68.7
83.5
Variation
(%)
-54.0
-47.6
P/E (x)
P/BV (x)
EV/Sales (x)
EV/EBITDA (x)
FY14E
FY15E
FY14E
FY15E
FY14E
FY15E
FY14E
FY15E
Target price and recommendation
Current
Price (INR)
861
Target
Price (INR)
571
Upside
(%)
33.7
Reco.
Sell
Shareholding pattern (%)
Promoter
Domestic Inst
Foreign
Others
June-13
36.8
5.8
37.0
20.4
Mar-12
36.3
5.6
38.3
19.8
June-12
38.6
4.7
41.8
14.9
Stock performance (1-year)
29 October 2013
5

JSW Steel
Financials and valuation
Income statement
Y/E March
Net Sales
Change (%)
EBITDA
EBITDA Margin (%)
Depreciation
EBIT
Interest
Other Income
Extraordinary items
PBT
Tax
Tax Rate (%)
Reported PAT
Adjusted PAT
Change (%)
Min. Int. & Assoc. Share
Adj Cons PAT
2012
343.7
42.6
61.0
17.8
19.3
41.7
14.3
0.8
-15.4
12.8
5.0
39.0
7.8
23.2
39.7
-2.1
14.8
2013
382.1
11.2
65.0
17.0
22.4
42.7
19.7
0.7
-4.3
19.4
8.5
43.6
10.9
15.2
-34.3
-2.0
11.1
(INR Billion)
2014E
483.0
26.4
85.7
17.7
32.0
53.7
30.1
1.8
-17.1
8.2
5.6
67.7
2.7
19.8
29.9
-0.3
7.6
2015E
489.8
1.4
88.5
18.1
33.9
54.6
31.5
2.3
-8.5
16.8
9.4
56.0
7.4
15.9
-19.7
-0.3
10.6
Ratios
Y/E March
Basic (INR)
EPS
Cash EPS
Book Value
DPS
Payout (incl. Div. Tax.)
Valuation(x)
P/E
Cash P/E
Price / Book Value
EV/Sales
EV/EBITDA
Dividend Yield (%)
Profitability Ratios (%)
RoE
RoCE
Turnover Ratios (%)
Asset Turnover (x)
Debtors (No. of Days)
Inventory (No. of Days)
Creditors (No. of Days)
Leverage Ratios (%)
Net Debt/Equity (x)
2012
66.5
151.9
738.2
7.5
23.6
12.9
5.7
1.2
1.3
7.4
0.9
12.7
8.8
0.8
16.3
61.5
0.0
1.8
2013
49.7
148.7
764.8
10.0
20.5
17.3
5.8
1.1
1.3
7.4
1.2
7.7
8.4
0.8
20.1
52.5
0.0
1.8
2014E
31.6
162.8
680.5
10.0
40.7
27.3
5.3
1.3
1.2
6.8
1.2
11.5
10.1
0.9
15.0
60.0
0.0
2.5
2015E
43.8
183.0
696.0
10.0
29.4
19.7
4.7
1.2
1.2
6.6
1.2
9.2
9.5
0.8
15.0
60.0
0.0
2.5
Balance sheet
Y/E March
Share Capital
Reserves
Net Worth
Debt
Deferred Tax
Total Capital Employed
Gross Fixed Assets
Less: Acc Depreciation
Net Fixed Assets
Capital WIP
Investments
Current Assets
Inventory
Debtors
Cash & Bank
Loans & Adv, Others
Curr Liabs & Provns
Curr. Liabilities
Provisions
Net Current Assets
Total Assets
2012
2.2
162.5
164.7
293.9
27.2
488.0
426.9
88.8
338.1
35.7
18.9
124.6
57.9
15.4
32.5
18.8
29.2
26.6
2.7
95.4
488.0
2013
2.2
168.4
170.6
310.1
32.7
515.4
458.7
111.5
347.2
66.0
16.1
120.6
55.0
21.1
18.0
26.6
34.3
30.9
3.5
86.2
515.4
(INR Billion)
2014E
2015E
2.4
2.4
162.1
165.8
164.5
168.2
415.4
423.9
13.4
20.9
594.8
614.2
631.3
691.3
217.9
251.8
413.4
439.5
76.0
56.0
1.6
1.6
168.1
181.0
79.4
80.5
19.8
20.1
37.3
48.8
31.6
31.6
64.3
63.9
60.8
60.4
3.5
3.5
103.8
117.1
594.8
614.2
E: MOSL Estimates
Cash flow statement
Y/E March
OP/(Loss) before Tax
Depreciation
Others
Interest
Direct Taxes Paid
(Inc)/Dec in Wkg Cap
CF from Op. Activity
(Inc)/Dec in FA & CWIP
(Pur)/Sale of Invt
Others
CF from Inv. Activity
Inc/(Dec) in Net Worth
Inc / (Dec) in Debt
Interest Paid
Divd Paid (incl Tax)
CF from Fin. Activity
Inc/(Dec) in Cash
Add: Opening Balance
Closing Balance
2012
27.4
19.3
-0.8
14.3
-4.1
-10.6
34.1
-40.8
0.8
-1.2
-41.1
0.0
21.9
-11.4
-3.5
7.7
0.7
31.8
32.5
2013
23.0
22.4
-0.7
19.7
-5.1
5.9
57.2
-56.3
0.8
1.1
-54.5
0.0
9.5
-15.2
-2.3
-7.2
-4.5
22.5
18.0
(INR Billion)
2014E
23.6
32.0
-1.8
30.1
-1.1
-13.6
69.2
-40.0
0.0
1.8
-38.2
0.0
19.7
-30.1
-3.1
-11.7
19.3
18.0
37.3
2015E
23.1
33.9
-2.3
31.5
-1.9
-1.8
82.6
-40.0
0.0
2.3
-37.7
0.0
-1.1
-31.5
-3.1
-33.4
11.4
37.3
48.8
29 October 2013
6

Disclosures
This report is for personal information of the authorized recipient and does not construe to be any investment, legal or taxation advice to you. This research report does not constitute an offer, invitation or
inducement to invest in securities or other investments and Motilal Oswal Securities Limited (hereinafter referred as MOSt) is not soliciting any action based upon it. This report is not for public distribution
and has been furnished to you solely for your information and should not be reproduced or redistributed to any other person in any form.
Unauthorized disclosure, use, dissemination or copying (either whole or partial) of this information, is prohibited. The person accessing this information specifically agrees to exempt MOSt or any of its
affiliates or employees from, any and all responsibility/liability arising from such misuse and agrees not to hold MOSt or any of its affiliates or employees responsible for any such misuse and further agrees
to hold MOSt or any of its affiliates or employees free and harmless from all losses, costs, damages, expenses that may be suffered by the person accessing this information due to any errors and delays.
The information contained herein is based on publicly available data or other sources believed to be reliable. While we would endeavour to update the information herein on reasonable basis, MOSt and/or
its affiliates are under no obligation to update the information. Also there may be regulatory, compliance, or other reasons that may prevent MOSt and/or its affiliates from doing so. MOSt or any of its
affiliates or employees shall not be in any way responsible and liable for any loss or damage that may arise to any person from any inadvertent error in the information contained in this report. MOSt or any
of its affiliates or employees do not provide, at any time, any express or implied warranty of any kind, regarding any matter pertaining to this report, including without limitation the implied warranties of
merchantability, fitness for a particular purpose, and non-infringement. The recipients of this report should rely on their own investigations.
This report is intended for distribution to institutional investors. Recipients who are not institutional investors should seek advice of their independent financial advisor prior to taking any investment decision
based on this report or for any necessary explanation of its contents.
MOSt and/or its affiliates and/or employees may have interests/positions, financial or otherwise in the securities mentioned in this report. To enhance transparency, MOSt has incorporated a Disclosure of
Interest Statement in this document. This should, however, not be treated as endorsement of the views expressed in the report.
Disclosure of Interest Statement
1. Analyst ownership of the stock
2. Group/Directors ownership of the stock
3. Broking relationship with company covered
4. Investment Banking relationship with company covered
JSW STEEL LTD
No
No
No
No
JSW Steel
Analyst Certification
The views expressed in this research report accurately reflect the personal views of the analyst(s) about the subject securities or issues, and no part of the compensation of the research analyst(s) was, is,
or will be directly or indirectly related to the specific recommendations and views expressed by research analyst(s) in this report. The research analysts, strategists, or research associates principally
responsible for preparation of MOSt research receive compensation based upon various factors, including quality of research, investor client feedback, stock picking, competitive factors and firm revenues.
This report is not directed or intended for distribution to or use by any person or entity resident in a state, country or any jurisdiction, where such distribution, publication, availability or use would be contrary
to law, regulation or which would subject MOSt & its group companies to registration or licensing requirements within such jurisdictions.
Regional Disclosures (outside India)
This report is intended for distribution only to persons having professional experience in matters relating to investments as described in Article 19 of the Financial Services and Markets Act 2000 (Financial
Promotion) Order 2005 (referred to as "investment professionals"). This document must not be acted on or relied on by persons who are not investment professionals. Any investment or investment activity
to which this document relates is only available to investment professionals and will be engaged in only with such persons.
For U.K.
Motilal Oswal Securities Limited (MOSL) is not a registered broker - dealer under the U.S. Securities Exchange Act of 1934, as amended (the"1934 act") and under applicable state laws in the United
States. In addition MOSL is not a registered investment adviser under the U.S. Investment Advisers Act of 1940, as amended (the "Advisers Act" and together with the 1934 Act, the "Acts), and under
applicable state laws in the United States. Accordingly, in the absence of specific exemption under the Acts, any brokerage and investment services provided by MOSL, including the products and services
described herein are not available to or intended for U.S. persons.
This report is intended for distribution only to "Major Institutional Investors" as defined by Rule 15a-6(b)(4) of the Exchange Act and interpretations thereof by SEC (henceforth referred to as "major
institutional investors"). This document must not be acted on or relied on by persons who are not major institutional investors. Any investment or investment activity to which this document relates is only
available to major institutional investors and will be engaged in only with major institutional investors. In reliance on the exemption from registration provided by Rule 15a-6 of the U.S. Securities Exchange
Act of 1934, as amended (the "Exchange Act") and interpretations thereof by the U.S. Securities and Exchange Commission ("SEC") in order to conduct business with Institutional Investors based in the
U.S., MOSL has entered into a chaperoning agreement with a U.S. registered broker-dealer, Motilal Oswal Securities International Private Limited. ("MOSIPL"). Any business interaction pursuant to this
report will have to be executed within the provisions of this chaperoning agreement.
The Research Analysts contributing to the report may not be registered /qualified as research analyst with FINRA. Such research analyst may not be associated persons of the U.S. registered broker-
dealer, MOSIPL, and therefore, may not be subject to NASD rule 2711 and NYSE Rule 472 restrictions on communication with a subject company, public appearances and trading securities held by a
research analyst account.
For U.S.
Motilal Oswal Capital Markets Singapore Pte Limited is acting as an exempt financial advisor under section 23(1)(f) of the Financial Advisers Act(FAA) read with regulation 17(1)(d) of the Financial
Advisors Regulations and is a subsidiary of Motilal Oswal Securities Limited in India. This research is distributed in Singapore by Motilal Oswal Capital Markets Singapore Pte Limited and it is only directed
in Singapore to accredited investors, as defined in the Financial Advisers Regulations and the Securities and Futures Act (Chapter 289), as amended from time to time.
In respect of any matter arising from or in connection with the research you could contact the following representatives of Motilal Oswal Capital Markets Singapore Pte Limited:
Kadambari Balachandran
Email : kadambari.balachandran@motilaloswal.com
Contact: (+65) 68189233 / 65249115
Office address: 21 (Suite 31), 16 Collyer Quay, Singapore 049318
For Singapore
Motilal Oswal Securities Ltd
29 October 2013
Motilal Oswal Tower, Level 9, Sayani Road, Prabhadevi, Mumbai 400 025
Phone: +91 22 3982 5500 E-mail: reports@motilaloswal.com
7