6 November 2013
2QFY14 Results Update | Sector:
Capital Goods
BHEL
BSE SENSEX
20,895
Bloomberg
Equity Shares (m)
52-Week Range (INR)
1, 6, 12 Rel. Per (%)
S&P CNX
6,215
BHEL IN
2,447.6
248/100
-9/-33/-51
CMP: INR141
TP: INR148
Neutral
M.Cap. (INR b) / (USD b) 343.8/5.5
Financials & Valuation (INR b)
Y/E MAR
Net Sales
EBITDA
Adj PAT
EPS (INR)
2013
484.2
93.9
65.5
2014E 2015E
395.1
47.1
35.0
14.3
(46.5)
133.3
11.1
11.4
9.8
1.1
319.9
36.1
24.1
9.9
(31.1)
139.7
7.2
7.5
14.2
1.0
26.8
EPS Gr. (%) (4.9)
( 9)
BV/Sh.
124.4
(INR)
RoE (%)
23.5
RoCE (%)
P/E (x)
P/BV (x)
24.5
5.2
1.1
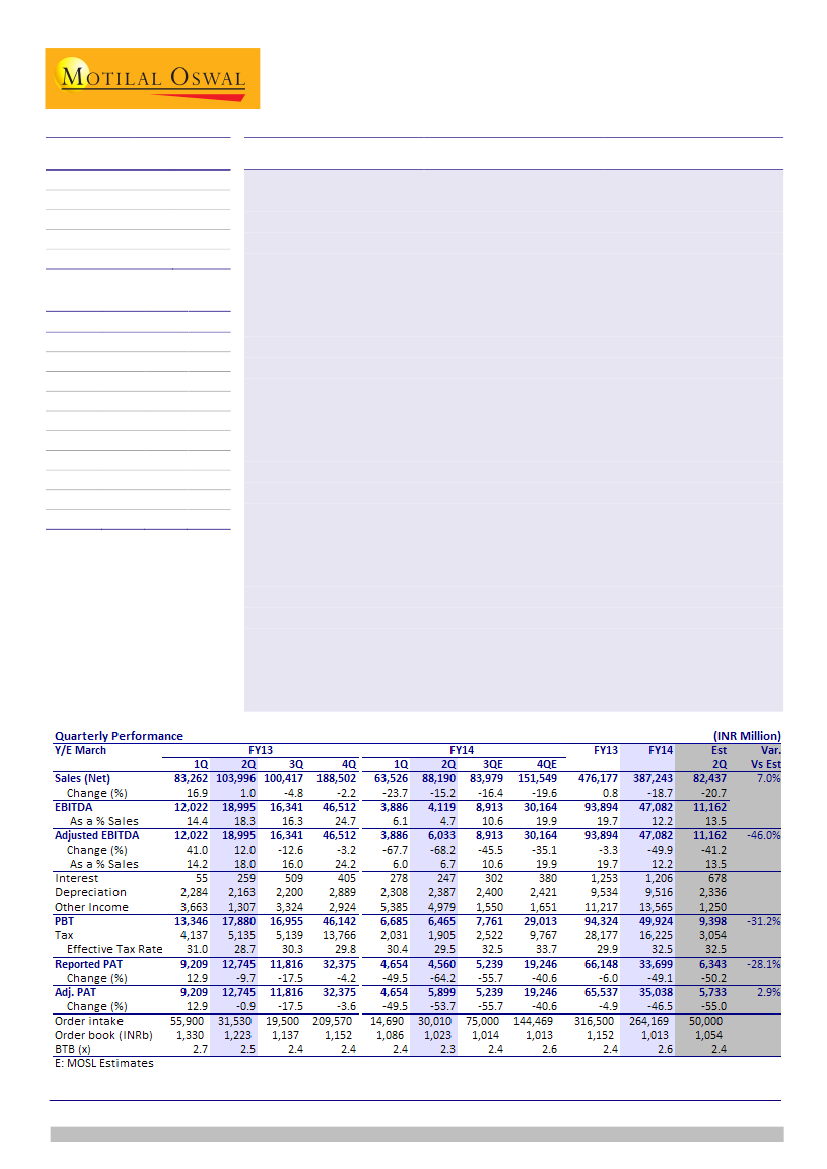
BHEL’s 2QFY14 revenues were significantly above est. at INR88.2b (down 15%
YoY) vs est. of INR82.4b (down 21% YoY) and adjusted EBIDTA margins at 6.7%
(down 1130bps). Adjusted PAT at INR5.9b (down 53.7% YoY) was in-line with
estimates of INR5.7b (down 55%) and is supported by increased other income at
INR5b (which includes INR3.7b as forex gains on receivables). Adj. to EBIDTA /
PAT pertains to PBT loss of INR1.9b on merger of BHPV, and is largely related to
readjustment of staff costs of INR1.4b (based on BHEL’s norms for actuarial
valuations, etc) and is thus one-time in nature.
Margins declined steeply in 2QFY14 given poor fixed cost absorption with
adjusted staff costs at 16.3% (up 231 bps) and SGA expenses at 18.1% (up 819
bps), while RM costs as % of revenues also increased to 59.3% (up 128bps). We
are perplexed by the sharp increase in SG&A expenses to 18.1% of revenues, and
is partly explained by provisions of INR4.3b pertaining to bad and doubtful debts /
liquidated damages, etc.
Gross order inflow was just INR30b (power sector INR8.8b, Industry INR16.5b,
international sector INR4.7b). The management stated that BHEL is favorably
positioned in ~5GW of projects to be awarded in 2HFY14.
Working capital situation continues to be stretched and debtors at the end of
2QFY14 stood at INR386b (including INR208b of retention money to be released
on project completion). Net Cash balance at the end of 2QFY14 declined to
INR54b, down 15% since March 2013.
To factor in the constrained macro environment, we are cutting FY14 / FY15
estimates by 18% and 9% respectively. We now expect BHEL to report EPS of
INR14.3/sh (down 47%) in FY14 and INR9.9/sh (down 31.1%) in FY15. At the CMP
of INR141, BHEL trades 9.8x / 14.2x its FY14E / FY15E EPS. We maintain
Neutral
rating on BHEL with a revised target of INR148 (15x FY15 EPS).
Satyam Agarwal
(AgarwalS@MotilalOswal.com); +91 22 3982 5410
Nirav Vasa
(Nirav.Vasa@MotilalOswal.com); +91 22 3982 5422
Investors are advised to refer through disclosures made at the end of the Research Report.

BHEL
2QFY14 revenues above est; adj EBITDA margins drop to 6.7% given poor
cost absorption
BHEL’s 2QFY14 revenues were significantly above estimates at INR88.2b (down
15% YoY) vs estimates of INR82.4b (down 21% YoY) and adjusted EBIDTA
margins at 6.7% (down 1130bps). Adjusted PAT at INR5.9b (down 53.7% YoY)
was in-line with estimates of INR5.7b (down 55%) and is supported by increased
other income at INR5b (which includes INR3.7b as forex gains on receivables).
Adjustments to EBIDTA / PAT pertains to PBT loss of INR1.9b on merger of
BHPV, and is largely related to readjustment of staff costs of INR1.4b (based on
BHEL’s norms for actuarial valuations, etc) and is thus one-time in nature.
Revenues were impacted given slow moving orders from private sector, while
execution across the public sector orders was constrained due to lack of
regulatory clearances and local issues. While the management stated that the
Cabinet Committee on Investments clearances should support execution on the
ground for specific projects, the benefits will accrue with a time lag. Margins
declined steeply in 2QFY14 given poor fixed cost absorption with adjusted staff
costs at 16.3% (up 231 bps) and SGA expenses at 18.1% (up 819 bps), while RM
costs as % of revenues also increased to 59.3% (up 128bps). We are perplexed
by the sharp increase in SG&A expenses to 18.1% of revenues, and is partly
explained by provisions of INR4.3b pertaining to bad and doubtful debts /
liquidated damages, etc.
EBITDA margin dips given poor fixed cost absorption
2QFY14 Revenue de-grows by 15% YoY
Source: MOSL, Company
Segmental performance: Industry business impacted by BHPV merger
2QFY14 Power sector revenues declined 15% YoY at INR75.8b, while Industry
revenues were also down 15% YoY at INR17.4b. Power sector EBIT margins
stood at 14.5% vs 19.7% YoY, while Industry segment EBIT declined sharply to
loss INR42m, given the impact of BHPV merger (INR1.9b). Adjusting for the
same, industry business EBIT margins stood at 11%, similar to 1QY14 levels of
10.1%.
Both power and industry business adjusted EBIT margins have remained stable
QoQ, despite 40% increase in revenues QoQ; and thus the benefits of operating
leverage have been offset by incremental provisions and other expenses.
The Industry business has failed to provide support, given the dependence on
captive power (50%+ of revenues). FY13 order intake in Industrial segment was
6 November 2013
2

BHEL
just INR41b, vs revenues of INR106b; and we expect revenues to decline to
INR65b in FY14 (down 35% YoY).
Also, in the power business, as we understand, the list of slow-moving orders
continues to be substantial with 7.5GW of capacity, contributing 20% to BHEL's
power sector order book (management stated that Bajaj Lalitpur and Monnet
Ispat projects have started seeing execution, which were earlier slow moving).
This will continue to impact execution in the medium term and we model FY14
revenues at INR333b (down 16% YoY).
Segmental Performance (INR m)
INR m
Revenues
Power
Growth (%)
Industry
Growth (%)
EBIT
Power
Growth (%)
Industry
Growth (%)
EBIT margin (%)
Power
Industry
1Q
87,409
67,693
17.1
19,717
19.3
16,198
12,064
26.7
4,134
10.7
18.5
17.8
21.0
FY13
2Q
3Q
110,129
105,441
89,581
83,076
14.9
(4.6)
20,549
22,365
(30.6)
(5.5)
22,070
19,313
17,690
15,224
34.4
(8.1)
4,380
4,088
(45.3)
(45.4)
20.0
18.3
19.7
18.3
21.3
18.3
4Q
198,668
155,259
(0.3)
43,409
(7.2)
49,979
40,616
(4.7)
9,363
(34.1)
25.2
26.2
21.6
FY14
1Q
2Q
66,712
93,156
53,786
75,764
(20.5)
(15.4)
12,926
17,392
(34.4)
(15.4)
8,899
10,942
7,589
10,984
(37.1)
(37.9)
1,311
-42
(68.3)
(101.0)
13.3
11.7
14.1
14.5
10.1
-0.2
Source: Company, MOSL
BHEL favorably positioned in 5GW projects
Order backlog at the end of 2QFY14 declined to INR1trn, down 16% YoY & 6%
QoQ. Power sector order book was at INR829b, down 7.3% QoQ while Industry
sector witnessed 3.4% YoY increase to INR113b. Gross order inflow was just
INR30b (power sector INR8.8b, Industry INR16.5b, international sector INR4.7b).
The management stated that BHEL is favorably positioned in ~5GW of projects
to be awarded in 2HFY14, which includes 500MW NTPC Unchahar, 1.6GW NTPC
Darlipalli, 6X116MW Pranhita Lift Irrigation Project, 206MW PSPCL hydro power
project, 3 projects of 2.4GW where customers are awaiting clearances, etc. In
addition, the company is submitting bids for another 3GW of projects in Nov
2013 and the management expects 15GW in total to be awarded in 2HFY14. We
model order inflow of 6GW in FY14 with average per MW pricing of INR27m for
power segment. BHEL had tied up with REC to bid for TANGENCO’s (660x2) MW
Udangudi and Ennore project, which entails suppliers credit under “EPC cum
debt financing contract” and the management stated in the past that the
financing risk is being undertaken by REC.
6 November 2013
3

BHEL
Order book declines to INR1t, BTB at 2.2x
Order intake has remained muted (INR b)
Source: Company, MOSL
Working capital remains at elevated levels
Working capital situation continues to be stretched and debtors at the end of
2QFY14 stood at INR386b (including INR208b of retention money to be released
on project completion). Debtor days at the end of 2QFY14 stand at 320 days (vs
306 days at 4QFY13) led by increased delay in pace of project execution.
Net Cash balance at the end of 2QFY14 declined to INR54b, down 15% since
March 2013.
Retention money at elevated levels (INR B)
Source: Company, MOSL
Net Working capital continues to remain stretched
Inventories
Sundry Debtors
Other Current Assets
Loans and Advances
Creditors
Current Liabilities
Provisions
Net Working Capital
2QFY11
110
227
3
40
304
41
35
FY11
95
241
3
29
71
205
67
25
2QFY12
109
253
3
28
271
57
64
FY12
104
277
1
23
79
181
59
86
2QFY13
FY13 2QFY14
106
90
97
276
306
320
2
2
2
29
22
30
61
74
70
171
151
153
56
69
74
124
127
151
Source: Company, MOSL
Valuations and View
To factor in the constrained macro environment, we are cutting FY14 / FY15
estimates by 18% and 9% respectively. We now expect BHEL to report EPS of
INR14.3/sh (down 47%) in FY14 and INR9.9/sh (down 31.1%) in FY15.
At the CMP of INR141, BHEL trades 9.8x / 14.2x its FY14E / FY15E EPS. We
maintain
Neutral
rating on BHEL with a revised target of INR148 (15x FY15 EPS).
6 November 2013
4

BHEL
BHEL: an investment profile
Company description
BHEL is India’s dominant producer of power and
industrial machinery and a leading EPC company,
established in the late 1950s as the government’s
wholly-owned subsidiary. Post divestment, the
government currently has an equity stake of 67.7%.
BHEL has 14 manufacturing divisions, 8 service centers,
4 power sector regional centers, besides project sites
spread across India and abroad. It has formed a tie-up
with Alstom and an alliance with Siemens for the
manufacture of super-critical 800MW boilers and
turbines, respectively.
Key investment risks
The key challenge is to meet execution deadlines
and improve cost efficiencies.
Intensified competition from Indian players like
L&T, BGR – Hitachi JV, Themrax – Babcock Willcox
JV.
In the recent conference call, management stated
that BHEL is favorably positioned in ~5GW of
projects to be awarded in 2HFY14.
Working capital situation continues to be
stretched. Debtor days at the end of 2QFY14 stand
at 320 days (vs 306 days at 4QFY13) led by
increased delay in pace of project execution
We have reduced FY14 / FY15 estimates by 18%
and 9% respectively. We now expect BHEL to
report EPS of INR14.3/sh (down 47%) in FY14 and
INR9.9/sh (down 31.1%) in FY15.
We maintain
Neutral
rating on the stock with a
revised TP of INR 148.
We have a neutral view on the sector.
Recent developments
Key investment arguments
Order backlog at the end of 2FY14 stands at
INR1trn, with a book to bill ratio of 2.2x TTM
revenue.
BHEL’s manufacturing capacity is of 20 GW, at par
with its Chinese and Korean counterparts, giving
BHEL sizeable muscle to compete, execute and
deliver on time.
Diminishing competition from Chinese players
because of currency depreciation.
Valuation and view
Sector view
Comparative valuations
P/E (x)
P/BV (x)
EV/Sales (x)
EV/EBITDA (x)
FY13E
FY14E
FY13E
FY14E
FY13E
FY14E
FY13E
FY14E
BHEL
5.2
9.8
1.1
1.1
0.6
0.8
2.9
6.4
L&T
18.3
19.9
3.1
2.5
1.5
1.3
14.4
12.7
Crompton
29.7
15.8
1.6
1.5
0.5
0.5
16.9
9.3
EPS: MOSL forecast v/s consensus (INR)
MOSL
Forecast
FY14
FY15
14.3
9.9
Consensus
Forecast
18.5
16.5
Variation
(%)
-22.5
-39.9
Target price and recommendation
Current
Price (INR)
141
Target
Price (INR)
148
Upside
(%)
5.0
Reco.
Neutral
Shareholding pattern (%)
Promoter
Domestic Inst
Foreign
Others
Sep-13
67.7
12.0
15.5
4.8
Jun-13
67.7
12.2
15.2
4.8
Sep-12
67.7
12.7
14.6
5.0
Stock performance (1-year)
6 November 2013
5

BHEL
Financials and valuation
Income statement
Y/E March
Revenues
Change (%)
EBITDA
EBITDA Margin (%)
Depreciation
EBIT
Interest
Other Income
Extraordinary items
PBT
Tax
Tax Rate (%)
Reported PAT
Adjusted PAT
Change (%)
(INR Million)
2012
2013
2014E
2015E
472,278 476,177 387,243 311,934
19
1
-19
-19
99,076 93,898 47,082 36,065
20.6
19.4
11.9
11.3
8,000
91,076
513
12,656
-193
103,026
32,623
31.7
70,403
68,922
22
9,534
84,364
1,253
11,217
-4
94,324
28,177
29.9
66,148
65,540
-5
9,516
37,566
1,206
13,565
0
49,924
16,225
32.5
33,699
35,038
-47
10,664
25,401
1,155
10,754
0
35,000
10,850
31.0
24,150
24,150
-31
Ratios
Y/E March
Basic (INR)
EPS
Cash EPS
Book Value
DPS
Payout (incl. Div. Tax.)
Valuation(x)
P/E
Cash P/E
Price / Book Value
EV/EBITDA
Dividend Yield (%)
Profitability Ratios (%)
RoE
RoCE
Turnover Ratios (%)
Asset Turnover (x)
Debtors (No. of Days)
Inventory (No. of Days)
Creditors (No. of Days)
Leverage Ratios (%)
Net Debt/Equity (x)
2012
28.2
31.4
103.7
6.4
22.3
2013
26.8
30.7
124.4
5.4
20.0
2014E
14.3
18.2
133.3
4.1
30.0
2015E
9.9
14.2
139.7
3.0
30.0
5.2
4.6
1.1
3.0
3.8
30.9
43.3
2.3
271.9
103.1
98.3
-0.3
23.7
31.1
1.8
300.7
88.7
90.5
-0.2
9.8
7.7
1.1
6.5
2.9
10.7
12.0
1.3
382.6
107.3
73.4
-0.1
14.2
9.9
1.0
5.3
2.1
7.2
7.6
1.0
355.5
106.8
66.4
-0.4
Balance sheet
Y/E March
Share Capital
Reserves
Net Worth
Debt
Deferred Tax
Total Capital Employed
Gross Fixed Assets
Less: Acc Depreciation
Net Fixed Assets
Capital WIP
Investments
Current Assets
Inventory
Debtors
Cash & Bank
Loans & Adv, Others
Curr Liabs & Provns
Curr. Liabilities
Provisions
Net Current Assets
Total Assets
2012
4,895
248,837
253,732
1,234
-15,462
239,504
97,066
54,098
42,968
13,476
4,617
591,237
135,487
357,405
66,720
31,624
412,794
336,380
76,414
178,443
239,504
2013
4,895
299,546
304,441
14,152
-15,507
303,086
107,832
63,248
44,585
11,716
4,292
625,185
117,638
398,882
77,321
31,344
382,692
293,270
89,421
242,493
303,086
(INR Million)
2014E
2015E
4,895
4,895
321,416 337,090
326,312 341,985
14,094 14,094
-15,507 -15,507
324,899 340,572
117,634 129,424
72,005 82,669
45,630 46,755
5,000
5,000
4,292
4,292
608,477 594,661
116,173 93,580
414,111 311,566
51,651 165,984
26,543 23,530
338,500 310,136
241,647 208,845
96,853 101,291
269,977 284,525
324,899 340,572
E: MOSL Estimates
Cash flow statement
Y/E March
OP/(Loss) before Tax
Depreciation
Others
Interest
Direct Taxes Paid
(Inc)/Dec in Wkg Cap
CF from Op. Activity
(Inc)/Dec in FA & CWIP
(Pur)/Sale of Invt
Others
CF from Inv. Activity
Inc/(Dec) in Net Worth
Inc / (Dec) in Debt
Interest Paid
Divd Paid (incl Tax)
CF from Fin. Activity
Inc/(Dec) in Cash
Add: Opening Balance
Closing Balance
2012
103,218
8,000
0
513
32,623
-85,648
-11,438
-13,097
-225
0
-13,322
6,169
213
513
11,302
-5,434
-30,194
96,302
66,108
2013
94,329
9,534
0
1,253
28,177
-8,217
31,108
-9,390
325
0
-9,065
-43
12,918
1,253
23,064
-11,442
10,601
66,720
77,321
(INR Million)
2014E
49,924
9,516
0
1,206
16,225
-29,727
-5,746
-3,846
0
0
-3,846
0
-58
1,206
14,815
-16,078
-25,670
77,321
51,650
2015E
35,000
10,664
0
1,155
10,850
108,649
137,187
-11,790
0
0
-11,790
0
0
1,155
9,909
-11,064
114,333
51,651
165,984
6 November 2013
6

BHEL
NOTES
6 November 2013
7

Disclosures
This report is for personal information of the authorized recipient and does not construe to be any investment, legal or taxation advice to you. This research report does not constitute an offer, invitation or
inducement to invest in securities or other investments and Motilal Oswal Securities Limited (hereinafter referred as MOSt) is not soliciting any action based upon it. This report is not for public distribution
and has been furnished to you solely for your information and should not be reproduced or redistributed to any other person in any form.
Unauthorized disclosure, use, dissemination or copying (either whole or partial) of this information, is prohibited. The person accessing this information specifically agrees to exempt MOSt or any of its
affiliates or employees from, any and all responsibility/liability arising from such misuse and agrees not to hold MOSt or any of its affiliates or employees responsible for any such misuse and further agrees
to hold MOSt or any of its affiliates or employees free and harmless from all losses, costs, damages, expenses that may be suffered by the person accessing this information due to any errors and delays.
The information contained herein is based on publicly available data or other sources believed to be reliable. While we would endeavour to update the information herein on reasonable basis, MOSt and/or
its affiliates are under no obligation to update the information. Also there may be regulatory, compliance, or other reasons that may prevent MOSt and/or its affiliates from doing so. MOSt or any of its
affiliates or employees shall not be in any way responsible and liable for any loss or damage that may arise to any person from any inadvertent error in the information contained in this report. MOSt or any
of its affiliates or employees do not provide, at any time, any express or implied warranty of any kind, regarding any matter pertaining to this report, including without limitation the implied warranties of
merchantability, fitness for a particular purpose, and non-infringement. The recipients of this report should rely on their own investigations.
BHEL
This report is intended for distribution to institutional investors. Recipients who are not institutional investors should seek advice of their independent financial advisor prior to taking any investment decision
based on this report or for any necessary explanation of its contents.
MOSt and/or its affiliates and/or employees may have interests/positions, financial or otherwise in the securities mentioned in this report. To enhance transparency, MOSt has incorporated a Disclosure of
Interest Statement in this document. This should, however, not be treated as endorsement of the views expressed in the report.
Disclosure of Interest Statement
1. Analyst ownership of the stock
2. Group/Directors ownership of the stock
3. Broking relationship with company covered
4. Investment Banking relationship with company covered
BHARAT HEAVY ELECTRICALS
No
No
No
No
Analyst Certification
The views expressed in this research report accurately reflect the personal views of the analyst(s) about the subject securities or issues, and no part of the compensation of the research analyst(s) was, is,
or will be directly or indirectly related to the specific recommendations and views expressed by research analyst(s) in this report. The research analysts, strategists, or research associates principally
responsible for preparation of MOSt research receive compensation based upon various factors, including quality of research, investor client feedback, stock picking, competitive factors and firm revenues.
This report is not directed or intended for distribution to or use by any person or entity resident in a state, country or any jurisdiction, where such distribution, publication, availability or use would be contrary
to law, regulation or which would subject MOSt & its group companies to registration or licensing requirements within such jurisdictions.
Regional Disclosures (outside India)
This report is intended for distribution only to persons having professional experience in matters relating to investments as described in Article 19 of the Financial Services and Markets Act 2000 (Financial
Promotion) Order 2005 (referred to as "investment professionals"). This document must not be acted on or relied on by persons who are not investment professionals. Any investment or investment activity
to which this document relates is only available to investment professionals and will be engaged in only with such persons.
For U.K.
Motilal Oswal Securities Limited (MOSL) is not a registered broker - dealer under the U.S. Securities Exchange Act of 1934, as amended (the"1934 act") and under applicable state laws in the United
States. In addition MOSL is not a registered investment adviser under the U.S. Investment Advisers Act of 1940, as amended (the "Advisers Act" and together with the 1934 Act, the "Acts), and under
applicable state laws in the United States. Accordingly, in the absence of specific exemption under the Acts, any brokerage and investment services provided by MOSL, including the products and services
described herein are not available to or intended for U.S. persons.
This report is intended for distribution only to "Major Institutional Investors" as defined by Rule 15a-6(b)(4) of the Exchange Act and interpretations thereof by SEC (henceforth referred to as "major
institutional investors"). This document must not be acted on or relied on by persons who are not major institutional investors. Any investment or investment activity to which this document relates is only
available to major institutional investors and will be engaged in only with major institutional investors. In reliance on the exemption from registration provided by Rule 15a-6 of the U.S. Securities Exchange
Act of 1934, as amended (the "Exchange Act") and interpretations thereof by the U.S. Securities and Exchange Commission ("SEC") in order to conduct business with Institutional Investors based in the
U.S., MOSL has entered into a chaperoning agreement with a U.S. registered broker-dealer, Motilal Oswal Securities International Private Limited. ("MOSIPL"). Any business interaction pursuant to this
report will have to be executed within the provisions of this chaperoning agreement.
The Research Analysts contributing to the report may not be registered /qualified as research analyst with FINRA. Such research analyst may not be associated persons of the U.S. registered broker-
dealer, MOSIPL, and therefore, may not be subject to NASD rule 2711 and NYSE Rule 472 restrictions on communication with a subject company, public appearances and trading securities held by a
research analyst account.
For U.S.
Motilal Oswal Capital Markets Singapore Pte Limited is acting as an exempt financial advisor under section 23(1)(f) of the Financial Advisers Act(FAA) read with regulation 17(1)(d) of the Financial
Advisors Regulations and is a subsidiary of Motilal Oswal Securities Limited in India. This research is distributed in Singapore by Motilal Oswal Capital Markets Singapore Pte Limited and it is only directed
in Singapore to accredited investors, as defined in the Financial Advisers Regulations and the Securities and Futures Act (Chapter 289), as amended from time to time.
In respect of any matter arising from or in connection with the research you could contact the following representatives of Motilal Oswal Capital Markets Singapore Pte Limited:
Anosh Koppikar
Kadambari Balachandran
Email : anosh.koppikar@motilaloswal.com
Email : kadambari.balachandran@motilaloswal.com
Contact: (+65) 68189232
Contact: (+65) 68189233 / 65249115
Office address: 21 (Suite 31), 16 Collyer Quay, Singapore 049318
For Singapore
Motilal Oswal Securities Ltd
6 November 2013
Motilal Oswal Tower, Level 9, Sayani Road, Prabhadevi, Mumbai 400 025
Phone: +91 22 3982 5500 E-mail: reports@motilaloswal.com
8