8 November 2013
2QFY14 Results Update | Sector:
Technology
Tech Mahindra
BSE SENSEX
20,823
Bloomberg
Equity Shares (m)
M.Cap. (INR b)/(USD b)
52-Week Range (INR)
1, 6, 12 Rel. Per (%)
S&P CNX
6,187
TECHM IN
231.9
368.7/5.9
1,605/865
6/58/53
CMP: INR1,580
TP: INR1,84
Buy
Financials & Valuation (INR b)
Y/E MAR
Net Sales
EBITDA
Adj PAT
Adj.EPS
(INR)
Gr. (%)
2013 2014E 2015E
143
30.6
19.8
93.0
32.1
186
40.8
26.6
124.6
34.0
204
42.6
30.2
141.5
13.6
537.9
30.8
30.1
11.2
3.0
BV/Sh(INR) 321.3 408.0
RoE (%)
32.6 34.7
RoCE (%)
35.3 34.6
P/E (x)
P/BV (X)
17.1
4.9
12.8
3.9
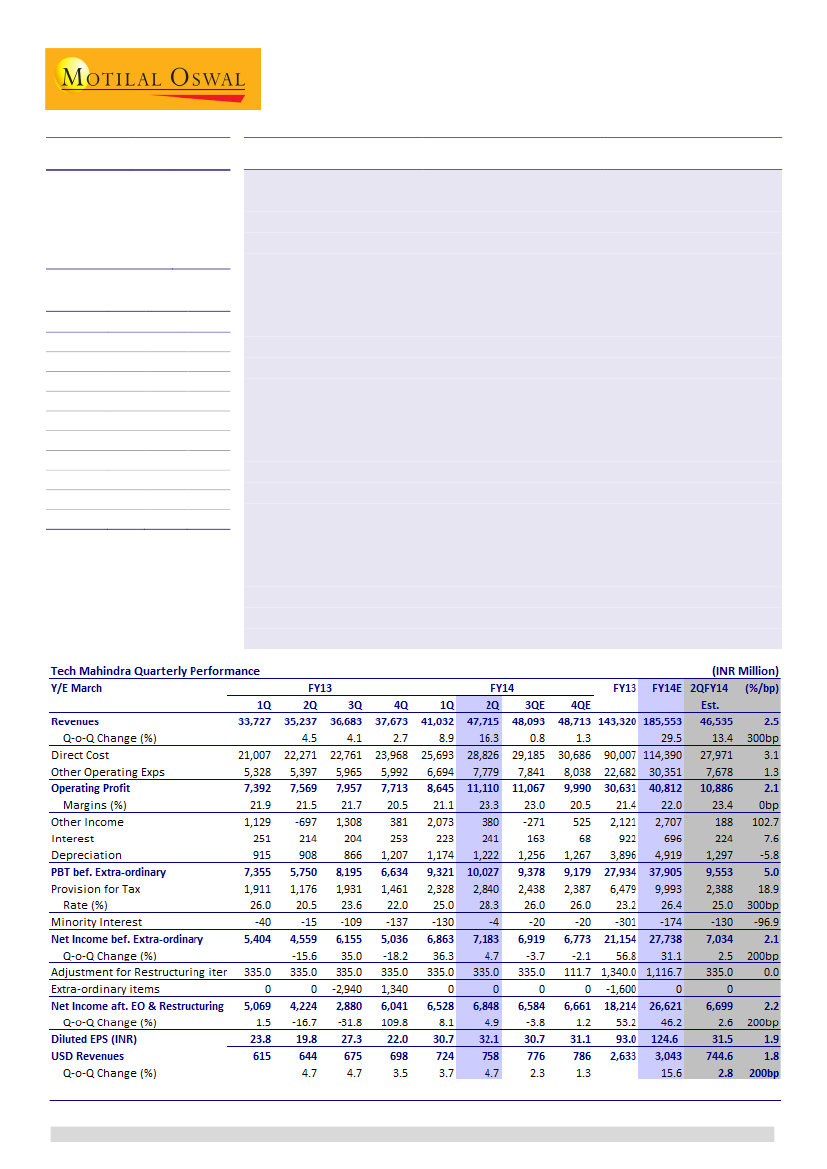
2QFY14 results beat expectations:
TECHM’s 2QFY14 revenue grew 4.7% QoQ (and
5% QoQ CC) to USD758m, above our estimate of USD745m. EBITDA margin
expanded 220bp QoQ to 23.3%, in line with our estimate. PAT after adjusting for
restructuring fees was INR6.85b, marginally ahead of our estimate of INR6.7b.
Healthy deal wins:
TECHM announced 13 significant deal wins during the quarter,
with a total TCV of ~USD500m, much higher than three large wins of USD50m-
75m TCV each announced in the previous quarter. Notably, the wins announced
are new businesses won with new clients.
Comfortable balance sheet:
TECHM continued to repay debt, which has now been
brought down to INR3.35b from INR11.6b two quarters ago. Cash position at
INR32.7b remains healthy.
Tightening in BT continues:
TECHM has discontinued disclosing top client revenue
contribution and only shares revenue contribution from top-5 client onwards.
There has been no change in gradual declining revenue trend from the account.
However, it remains a significant customer from TECHM’s perspective and its
wallet share is inching up in BT.
Revising estimates, target price:
We have raised our USD revenue estimates for
FY14/FY15 by 1.6%/2.8% on the back of multiple positives. We expect TECHM to
grow its USD revenue at a CAGR of 13.6% and EPS at a CAGR of 23.4% over FY13-
15. In 2QFY14, TECHM demonstrated improving prowess in winning deals to hive
off any impact from a weak BT account in particular, and Telecom in general. Our
revised target price of INR1,840 discounts FY15E EPS by 13x (v/s 12x earlier).
Maintain
Buy.
Ashish Chopra
(Ashish.Chopra@MotilalOswal.com); +91 22 3982 5424
Siddharth Vora
(Siddharth.Vora@MotilalOswal.com); +91 22 3982 5585
Investors are advised to refer through disclosures made at the end of the Research Report.

Tech Mahindra
Revenue growth above estimate
TECHM reported revenues of USD758m 4.7% QoQ above our estimates of
USD745m, +2.8% QoQ. Organic growth during the quarter was 4.2% QoQ, while
acquisition of Complex IT contributed another 0.5%. Complex IT revenue was
merged as on 2
nd
May, 2013 thus this quarter had one month of extra revenues.
USD revenue growth was above our estimate, driven by broad based traction
Source: MOSL, Company
In constant currency terms, revenue growth during the quarter was 5% QoQ,
which implies a cross currency impact of 0.3% during the quarter.
In rupee terms, revenue was INR47.1b, above our estimate of INR46.5b.
Average currency realization was INR62.9/USD (v/s our assumption of INR62.5).
EBITDA margin in line, up 220bp QoQ led by better currency; only marginal
PAT beat due to higher tax rate
EBITDA margin expanded 220bp QoQ to 23.3%, in line with our estimate of
23.4%. Improvement in EBITDA margin was entirely driven by a more favorable
currency realization and partly offset by 1pp decline in utilization.
OPM was marginally ahead of our estimates, partly driven by better currency realization
Source: MOSL, Company
PAT after adjusting for restructuring fees was INR6.85b, only marginal beat to
our estimate of INR6.7b, in spite of higher revenue and lower forex losses due to
one-time taxation of USD3m on integration with Mahindra Satyam, which led to
tax rate of 28.3% v/s est. of 25%.
8 November 2013
2

Tech Mahindra
Large deal wins - a key feature of the 2Q performance
TECHM reported 13 large deals wins during the quarter which have a combine
TCV of USD500m, one of the best quarters for the company in terms of deal
signings. Impressively, the deals announced are with new clients, hence will be
contributing to incremental revenues going forward.
TECHM had won 3 large deals between USD50-75m in the last quarter; this
quarter large deal wins on the back of the same suggests improvement in win
ratios in an improving demand environment. TECHM continues to chase large
deals it has a healthy pipeline of 5-6 deals currently, in Telecom and Enterprise
combined.
Segmental Results: Broad-based growth among verticals, Europe drives
growth among geographies
Growth was broad based across verticals with Retail|Transport|Logistics vertical
leading growth at 22.1%. Momentum in this vertical will continue to remain
strong as the company continues to see increased traction in offerings like
analytics. Telecom vertical (+2.5% QoQ) grew below company average(4.7%
QoQ) as the gradual decline in BT continues.
Growth was broad based across verticals led by Retail | Transport | Logistics
Verticals
Telecom
Manufacturing
Tech | Media | Entertainment
BFSI
Retail | Transport | Logistics
Others
Total
Contr to
Rev. (%)
47.0
19.0
12.0
9.0
7.0
6.0
100
Growth –
QoQ (%)
2.5
4.7
4.7
4.7
22.1
4.7
4.7
Contr to
4-Qtr
incr. rev (%)
CQGR (%)
25.6
5.3
19.0
4.1
12.0
2.1
9.0
-0.9
28.4
4.1
6.0
9.0
100.0
4.1
Source: MOSL, Company
Among geographies, growth was driven by Europe (+8% QoQ) and the outlook
for coming quarters remains healthy. RoW grew by 4.7% QoQ which also had
0.5% inorganic revenue contribution from Complex IT in Brazil.
Growth was driven by Europe among geographies
Geographies
Americas
Europe
ROW
Total
Contr to
Rev. (%)
44.0
33.0
23.0
100
Growth –
QoQ (%)
2.4
8.0
4.7
4.7
Contr to
4Qtr
incr. rev (%)
CQGR (%)
22.6
3.6
54.4
3.4
23.0
6.5
100.0
4.1
Source: MOSL, Company
Among clients, growth was driven by Top 11-20 Clients which grew 23.7% QoQ,
while Top 5 clients grew the lowest by 1.9% QoQ driven by BT. TECHM has
discontinued disclosing Top client revenue contribution and only shares revenue
contribution from Top-5 client onwards.
8 November 2013
3

Tech Mahindra
Growth driven by top 11-20 Clients
Client concentration (QoQ)
Top 5 clients
Top 6-10 clients
Top 11-20 clients
Contr to
Rev. (%)
36.0
12.0
13.0
Growth –
QoQ (%)
1.9
4.7
23.7
Contr to
4Qtr
incr. rev (%)
CQGR (%)
14.6
0.8
12.0
9.0
55.7
4.1
Source: Company, MOSL
Takeaways from Management Commentary
Macro environment strong:
Conditions clearly improved in US and Europe. In
UK, the economy grew at faster pace than it has over past 3 years. Confidence
has returned in rest of Europe too. Strengthening in domestic demand is
underpinning the recovery. Higher customer confidence is driving uptick in IT
spending. Customers are looking at ways to invest in the future. This augurs well
and should continue going forward.
BT update:
Continues to see tightening of spend. There has been no change in
gradual declining revenue trend from the account. However, it remains a
significant customer from TECHM’s perspective and its wallet share is inching up
slightly in BT.
Telecom outlook:
Pipeline continues to be very healthy. Differentiated approach
to Telecom business has been driving growth outside BT. The company has been
increasing the addressable market to grow. Still there are a lot of customers
with whom TECHM is not doing business.
Enterprise Segment outlook:
Pipeline seeing healthy growth. Traction is seen
across all major verticals. Execution is the key to convert some of this business.
Large deals are typically USD50m over 3 years. Win rates have seen a significant
improvement.
Margins:
Two headwinds to margins in the next couple of quarters are: [1]
amortization discontinuation (USD6-7m impact on top-line and operating profit
in 4Q and balance in 1Q) [2] and wage hikes from January 1
st
(<200bp impact).
Utilization will be a mitigating lever and also some additional efficiencies in a
few projects.
Change in estimates: Upgrading revenue and EPS estimates on the back of
strong deal wins and an improving outlook
We have increased are USD revenue estimates for FY14/FY15 by 1.6%/2.8% on
the back of multiple factors: [1] beat to our 2QFY14 estimate; [2] healthy deal
signings during the quarter, expected to ramp up in coming months and [3]
further improvement in pipeline at both Telecom and Enterprise segment,
coupled with improvement in TECHM’s win rates. We now expect FY14E/FY15E
USD revenue growth of 15.6%/11.6%, after factoring 14.5% decline in BT
revenues in FY14 and a further 3% decline in FY15.
Our EBITDA margin estimates are unchanged post the result. While TECHM’s
EBITDA margin in 2Q was 23.3%, our FY15 margin estimate is 20.9%, due to
discontinuation of restructuring fees from a portion of BT account (~80bp
impact to margins) and wage hikes effective from July 1
st
. Consequently, our EPS
estimates for FY14E/FY15E are up by 1.5%/7.9%.
4
8 November 2013

Tech Mahindra
Change in Estimates
Revised
FY14E
FY15E
61.0
60.0
3,043
3,397
15.6%
11.6%
22.0%
20.9%
124.6
141.5
Earlier
FY14E
60.8
2,996
13.8%
22.1%
122.8
FY15E
60.0
3,305
10.3%
20.7%
131.1
Change
FY14E
FY15E
0.25%
0.00%
1.6%
2.8%
180bp
130bp
-12bp
17bp
1.5%
7.9%
Source: Company, MOSL
INR/USD
USD Revenue - m
USD rev Gr.
EBIDTA Margin
EPS - INR
Valuation and view
TECHM appears to be well placed in order to address the demand trends
shaping the future, with unique advantages compared to peers in areas like
Network, communication and Analytics. Its traction in Run-the-business (RTB)
segments in both Telecom and Enterprise too continues to be strong.
We expect TECHM to grow its USD revenues at a CAGR of 13.6% over FY13-15
and EPS at a CAGR of 23.4% during this period. Gradual improvement in the
portfolio (higher proportion of BFSI revenues, lower proportion from BT)
accompanied with improvement in cash generation (once acquisition spree
takes a breather), will augur well for valuations.
The stock trades at 12.7 FY14E and 11.2x FY15E EPS (ex treasury stock). 2QFY14
was an encouraging indicator of TECHM’s improving prowess in winning deals to
hive off any impacts from a weak BT account in particular, and Telecom in
general. As a result, our revised Target Price of INR1,840 discounts FY15E EPS by
13x (v/s 12x earlier). Any unforeseen sharper than anticipated decline in BT is a
key risk to our estimates.
Other result highlights
Net headcount increased by 2,171 to 85,234 led by increase in Software
professionals by 2,095; BPO reduced by 44 and sales support increased by 120.
Revenue proportion from Onsite/Offshore remained flat at 51%/49%
Utilization including and excluding trainees both was down 1pp QoQ to 75% /
77% respectively.
LTM attrition rate during the quarter was 16%, up 1pp from 15% in 1QFY14
Number of USD5m+/USD10m+/USD20m+ clients increased to 77/48/26 (v/s
74/46/25 1QFY14)
Capex during the quarter was INR1,497m (INR2,333m in 1QFY14).
Receivable days including unbilled increased by 5 to 102.
Net debt decreased by INR4.1b to INR3.35b
The company has USD899.3m hedges at a strike rate of INR58.9 and GBP244.2m
at a strike rate of INR92.4
8 November 2013
5

Tech Mahindra
Operating Metrics
Revenue by geography (%)
Americas
Europe
Rest of World
Vertical Split (%)
Telecom
Manufacturing
Tech | Media | Entertainment
BFSI
Retail | Transport | Logistics
Others
Onsite-offshore mix (%)
Onsite
Offshore
Client Metrics
No. of active clients
% of repeat business
No. of Million $ clients
USD1m+
USD5m+
USD10m+
USD20m+
USD50m+
Client concentration (%)
Top client
Top 2-5
Top 6-10
Top 11-20
Headcount (end of period)
Software professionals
BPO
Sales and Support
Total
IT Attrition (LTM) (%)
IT Utilization (%)
IT Utilziation (excluding trainees) (%)
Receivable Days (DSO)-Including Unbilled
Borrowings (USD m)
Cash and Cash Equivalent (USD m)
Capital Expenditure (USD m)
1QFY13
46
33
21
44
19
13
11
6
7
47.6
52.4
484
96
188
73
39
21
7
17
23
10
12
52,416
18,229
5,647
76,292
17
75
80
98
164.4
572.7
18.8
2QFY13
45
34
21
45
19
13
11
7
5
48.2
51.8
475
95
200
74
43
21
9
15
26
10
13
52,375
28,611
5,920
86,906
16
74
78
96
201.7
628.1
16.2
3QFY13
43
35
22
46
18
12
11
7
6
48.3
51.7
475
92
206
77
48
22
9
14
25
11
12
53,072
26,379
6,195
85,646
16
76
78
98
199.2
676
15.5
4QFY13
42
33
25
48
19
12
10
6
5
48.4
51.6
516
94
205
70
42
24
9
13
24
13
11
52,126
24,699
6,284
83,109
16
77
79
96
213.6
673.9
41.9
1QFY14
45
32
23
48
19
12
9
6
6
51.0
49.0
567
97
215
74
46
25
10
12
25
12
11
2QFY14
44
33
23
47
19
12
9
7
6
51.0
49.0
576
95
223
77
48
26
10
36
12
13
53,337
55,432
23,269
23,225
6,457
6,577
83,063
85,234
15
16
76
75
78
77
97
102
125.7
53.5
615.4
522.7
41.2
23.8
Source: Company, MOSL
8 November 2013
6

Tech Mahindra
Operating Metrics
Rupee USD Rate
Period closing rate
Period average Rate
Proportion of Revenues From Major Currencies
USD
GBP
EURO
AUD
Others
Consolidated Hedge Position
GBP In Mn
Strike rate (INR)
USD In Mn
Strike rate (INR)
Verticals (QoQ)
Telecom
Manufacturing
Tech | Media | Entertainment
BFSI
Retail | Transport | Logistics
Others
Total
Revenue by geography (QoQ)
Americas
Europe
Rest of World
Total
Client concentration (QoQ)
Top 5
Top 6-10
Top 11-20
Net additions
Software professionals
BPO
Sales and Support
Total
1QFY13
55.61
54.81
51
22
6
8
13
285.7
84.12
666.5
53.02
2QFY13
52.86
54.69
50
22
6
8
14
278.4
86.25
747.9
54.39
7.1
4.7
4.7
4.7
22.2
-25.2
4.7
2.4
7.9
4.7
4.7
7.3
4.7
13.4
-41
10,382
273
10,614
3QFY13
55
54.36
47
24
7
9
14
276.6
88.04
910.3
55.64
7.1
-0.8
-3.3
4.7
4.7
25.7
4.7
0.1
7.8
9.7
4.7
-0.4
15.2
-3.3
697
-2,232
275
-1,260
4QFY13
54.29
53.96
47
23
7
8
14
262.8
89.89
911
56.93
8.0
9.2
3.5
-6.0
-11.3
-13.8
3.5
1.0
-2.5
17.6
3.5
-1.9
22.3
-5.2
-946
-1,680
89
-2,537
1QFY14
59.39
56.57
50
19
8
7
15
267.9
91.58
1081.6
58.22
3.7
3.7
3.7
-6.7
3.7
24.5
3.7
11.1
0.6
-4.6
3.7
3.7
-4.3
3.7
2QFY14
62.61
62.91
48
20
9
7
17
244.2
92.4
899.3
58.9
2.5
4.7
4.7
4.7
22.1
4.7
4.7
2.4
8.0
4.7
4.7
1.9
4.7
23.7
1,211
2,095
-1,430
-44
173
120
-46
2,171
Source: Company, MOSL
8 November 2013
7

Tech Mahindra
Tech Mahindra: an investment profile
Company description
Tech Mahindra represents the connected world,
offering innovative and customer-centric information
technology services and solutions, enabling Enterprises,
Associates and the Society to Rise™. It is a USD2.85b
company with ~85,000 professionals across 49
countries, helping over 500 global customers including
Fortune 500 companies. It is a part of the USD 16.2
billion Mahindra Group that employs more than
155,000 people in over 100 countries.
Recent developments
Won 13 large deals with a TCV of USD500m
TECHM Announced Strategic Alliance with Juniper
Networks. This alliance brings formidable joint
solutions for Mobile4G Networks, SDN, Next
Generation Enterprise Networks and Data Centres
Valuation and view
Key investment arguments
Satyam’s acquisition will help Tech Mahindra to
diversify its client base and industry focus.
Large deals like those of KPN and a gradual revival in
the Telecom vertical will help volume growth.
Deals have kept growth coming (outside the BT
account) despite challenged IT budgets in the
Telecom vertical.
The company is dependent on a single vertical,
Telecom for 48% of its revenues
Revenues from BT are expected to continue
declining going forward, which could be a drag on
growth.
Growth is skewed towards lower margin services
like new telco rollouts and domestic BPOs.
Tech Mahindra
FY14E
12.7
FY15E
11.2
FY14E
FY15E
FY14E
FY15E
FY14E
FY15E
3.9
3.0
3.9
3.0
7.0
6.2
HCLT#
13.8
12.1
4.0
3.2
2.1
1.8
8.6
7.8
Mphasis*
11.8
11.1
1.8
1.7
1.2
1.0
6.7
5.9
We expect Tech Mahindra to post USD revenue
CAGR of 13.6% over FY13-15 and an EPS CAGR of
23.4% during this period.
Stock trades at 12.7x FY14E and 11.2x FY15E EPS.
Buy
with a TP of INR1,840, based on 13x FY15E EPS.
Sector view
Key investment risks
Uptick in demand environment in the US combined
with favorable currency are expected to drive
robust financial performance
Overhang from immigration bill, political uncertainty
in the US remain, which could be potential
detractors to healthy fundamentals over near-to-
medium term.
We prefer companies in the top-tier v/s tier-II, as we
see the former better guarded to sail through any
unforeseen headwinds over the near-to-medium
term to undergo, if the immigration bill is passed in
current form.
Comparative valuations
P/E (x)
P/BV (x)
EV/Sales (x)
EV/EBITDA (x)
* YE Oct; # YE Jun
EPS: MOSL forecast v/s consensus (INR)
MOSL
Forecast
128.0
145.7
Consensus
Forecast
121.4
132.0
Variation
(%)
5.4
10.4
FY14
FY15
Target price and recommendation
Current
Price (INR)
1,580
Target
Price (INR)
1,840
Upside
(%)
15.7
Reco.
Buy
Stock performance (1-year)
Shareholding pattern (%)
Sep-13
Promoter
Domestic Inst
Foreign
Others
36.6
15.0
33.7
14.7
Jun-13
47.2
15.8
27.3
9.7
Sep-12
56.7
18.7
15.5
9.2
8 November 2013
8

Tech Mahindra
Financials and valuation
8 November 2013
9

Tech Mahindra
This report is for personal information of the authorized recipient and does not construe to be any investment, legal or taxation advice to you. This research report does not constitute an offer, invitation or
inducement to invest in securities or other investments and Motilal Oswal Securities Limited (hereinafter referred as MOSt) is not soliciting any action based upon it. This report is not for public distribution
and has been furnished to you solely for your information and should not be reproduced or redistributed to any other person in any form.
Unauthorized disclosure, use, dissemination or copying (either whole or partial) of this information, is prohibited. The person accessing this information specifically agrees to exempt MOSt or any of its
affiliates or employees from, any and all responsibility/liability arising from such misuse and agrees not to hold MOSt or any of its affiliates or employees responsible for any such misuse and further agrees
to hold MOSt or any of its affiliates or employees free and harmless from all losses, costs, damages, expenses that may be suffered by the person accessing this information due to any errors and delays.
The information contained herein is based on publicly available data or other sources believed to be reliable. While we would endeavour to update the information herein on reasonable basis, MOSt and/or
its affiliates are under no obligation to update the information. Also there may be regulatory, compliance, or other reasons that may prevent MOSt and/or its affiliates from doing so. MOSt or any of its
affiliates or employees shall not be in any way responsible and liable for any loss or damage that may arise to any person from any inadvertent error in the information contained in this report. MOSt or any
of its affiliates or employees do not provide, at any time, any express or implied warranty of any kind, regarding any matter pertaining to this report, including without limitation the implied warranties of
merchantability, fitness for a particular purpose, and non-infringement. The recipients of this report should rely on their own investigations.
This report is intended for distribution to institutional investors. Recipients who are not institutional investors should seek advice of their independent financial advisor prior to taking any investment decision
based on this report or for any necessary explanation of its contents.
MOSt and/or its affiliates and/or employees may have interests/positions, financial or otherwise in the securities mentioned in this report. To enhance transparency, MOSt has incorporated a Disclosure of
Interest Statement in this document. This should, however, not be treated as endorsement of the views expressed in the report.
Disclosure of Interest Statement
1. Analyst ownership of the stock
2. Group/Directors ownership of the stock
3. Broking relationship with company covered
4. Investment Banking relationship with company covered
TECH MAHINDRA LTD
No
No
No
No
Disclosures
Analyst Certification
The views expressed in this research report accurately reflect the personal views of the analyst(s) about the subject securities or issues, and no part of the compensation of the research analyst(s) was, is,
or will be directly or indirectly related to the specific recommendations and views expressed by research analyst(s) in this report. The research analysts, strategists, or research associates principally
responsible for preparation of MOSt research receive compensation based upon various factors, including quality of research, investor client feedback, stock picking, competitive factors and firm revenues.
This report is not directed or intended for distribution to or use by any person or entity resident in a state, country or any jurisdiction, where such distribution, publication, availability or use would be contrary
to law, regulation or which would subject MOSt & its group companies to registration or licensing requirements within such jurisdictions.
Regional Disclosures (outside India)
This report is intended for distribution only to persons having professional experience in matters relating to investments as described in Article 19 of the Financial Services and Markets Act 2000 (Financial
Promotion) Order 2005 (referred to as "investment professionals"). This document must not be acted on or relied on by persons who are not investment professionals. Any investment or investment activity
to which this document relates is only available to investment professionals and will be engaged in only with such persons.
For U.K.
Motilal Oswal Securities Limited (MOSL) is not a registered broker - dealer under the U.S. Securities Exchange Act of 1934, as amended (the"1934 act") and under applicable state laws in the United
States. In addition MOSL is not a registered investment adviser under the U.S. Investment Advisers Act of 1940, as amended (the "Advisers Act" and together with the 1934 Act, the "Acts), and under
applicable state laws in the United States. Accordingly, in the absence of specific exemption under the Acts, any brokerage and investment services provided by MOSL, including the products and services
described herein are not available to or intended for U.S. persons.
This report is intended for distribution only to "Major Institutional Investors" as defined by Rule 15a-6(b)(4) of the Exchange Act and interpretations thereof by SEC (henceforth referred to as "major
institutional investors"). This document must not be acted on or relied on by persons who are not major institutional investors. Any investment or investment activity to which this document relates is only
available to major institutional investors and will be engaged in only with major institutional investors. In reliance on the exemption from registration provided by Rule 15a-6 of the U.S. Securities Exchange
Act of 1934, as amended (the "Exchange Act") and interpretations thereof by the U.S. Securities and Exchange Commission ("SEC") in order to conduct business with Institutional Investors based in the
U.S., MOSL has entered into a chaperoning agreement with a U.S. registered broker-dealer, Motilal Oswal Securities International Private Limited. ("MOSIPL"). Any business interaction pursuant to this
report will have to be executed within the provisions of this chaperoning agreement.
The Research Analysts contributing to the report may not be registered /qualified as research analyst with FINRA. Such research analyst may not be associated persons of the U.S. registered broker-
dealer, MOSIPL, and therefore, may not be subject to NASD rule 2711 and NYSE Rule 472 restrictions on communication with a subject company, public appearances and trading securities held by a
research analyst account.
For U.S.
Motilal Oswal Capital Markets Singapore Pte Limited is acting as an exempt financial advisor under section 23(1)(f) of the Financial Advisers Act(FAA) read with regulation 17(1)(d) of the Financial
Advisors Regulations and is a subsidiary of Motilal Oswal Securities Limited in India. This research is distributed in Singapore by Motilal Oswal Capital Markets Singapore Pte Limited and it is only directed
in Singapore to accredited investors, as defined in the Financial Advisers Regulations and the Securities and Futures Act (Chapter 289), as amended from time to time.
In respect of any matter arising from or in connection with the research you could contact the following representatives of Motilal Oswal Capital Markets Singapore Pte Limited:
Anosh Koppikar
Kadambari Balachandran
Email : anosh.koppikar@motilaloswal.com
Email : kadambari.balachandran@motilaloswal.com
Contact: (+65) 68189232
Contact: (+65) 68189233 / 65249115
Office address: 21 (Suite 31), 16 Collyer Quay, Singapore 049318
For Singapore
8 November 2013
Motilal Oswal Securities Ltd
Motilal Oswal Tower, Level 9, Sayani Road, Prabhadevi, Mumbai 400 025
Phone: +91 22 3982 5500 E-mail: reports@motilaloswal.com
10