12 November 2013
2QFY14 Results Update | Sector:
Metals
Hindalco
BSE SENSEX
20,282
Bloomberg
Equity Shares (m)
52-Week Range (INR)
1, 6, 12 Rel. Per (%)
S&P CNX
6,018
HNDL IN
2,064.6
137/83
-1/2/-10
n
n
n
CMP: INR111
TP: INR154
Buy
Below estimate; copper rebounds; operational issues affected
Indian aluminum; deleveraging at Novelis has begun
n
M.Cap. (INR b) / (USD b) 229.6/3.6
Financials & Valuation (INR Billion)
Y/E MAR
Net Sales
EBITDA
Adj PAT
Adj.EPS
(INR)
Growth(%)
BV/Share
(INR)
RoE (%)
RoCE (%)
P/E (x)
P/BV (X)
2013
801.9
80.6
32.5
17.0
-4.4
100.7
18.0
5.8
6.6
1.1
2014E 2015E
872.6
87.5
25.3
12.2
-27.8
110.6
11.6
5.1
9.1
1.0
991.4
112.5
28.4
13.8
12.3
122.7
11.8
6.5
8.1
0.9
n
n
n
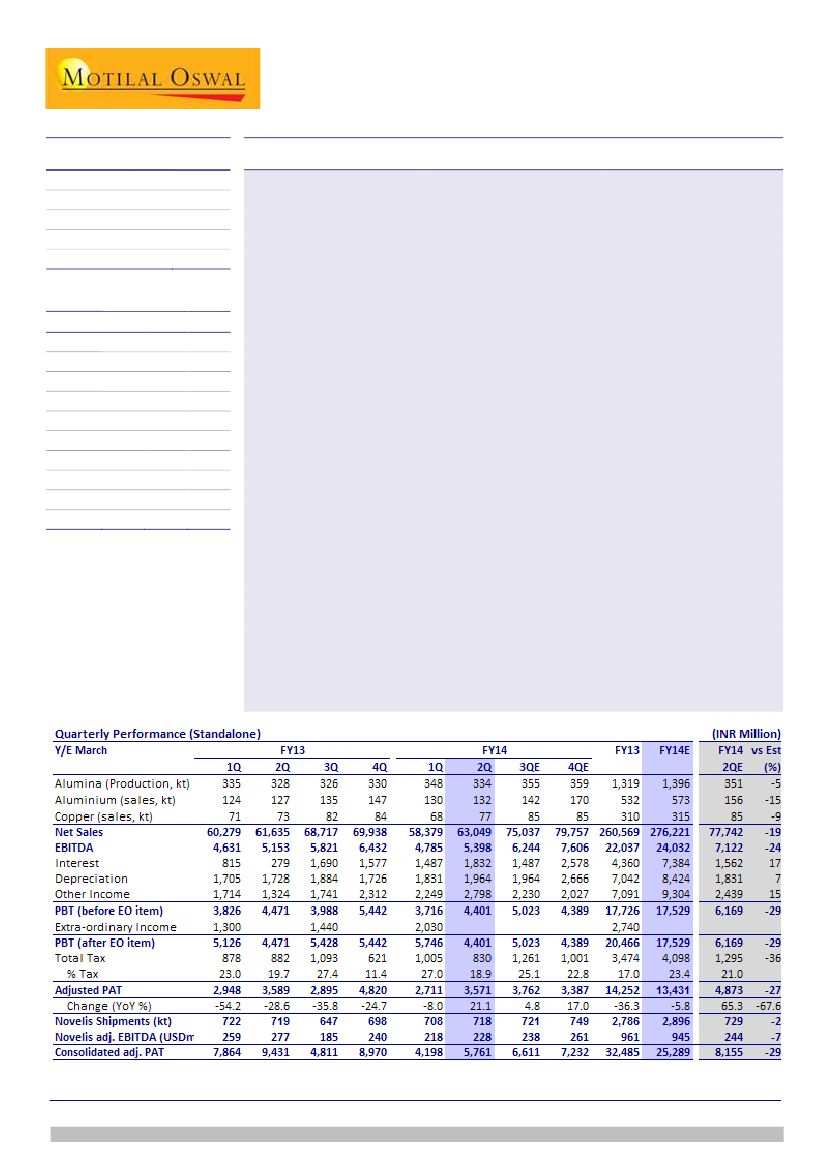
Standalone adjusted PAT flat YoY at INR3.57b (v/s est. of INR4.9b). EBITDA
increased 5% YoY (+13% QoQ) to INR5.4b (v/s est. of INR7.1b).
The operating performance of Indian aluminum business is improving slower-
than-expected due to slower growth in production and certain operational issues.
Indian copper EBIT rebounds to USDc23/lb (flat YoY) post a shutdown in 1QFY14.
Currency depreciation and 5% higher volumes led to an EBIT growth of 15%.
Novelis adj. EBITDA increased 5% QoQ to USD228m on 1% higher volumes.
EBITDA/ton was up 3% QoQ to USD318 as the benefits of expansion in S. America
have started to kick in, with strong volumes growth of 14% YoY. Although results
for the quarter are below our estimates, yet earnings are improving. Management
guided for stronger 2HFY14 (despite seasonally weak 3Q) driven by volumes and
margin expansion. We believe this is the beginning of earnings upcycle.
As Novelis is exiting the heavy investment phase, benefits of (1) volume growth,
(2) superior share of high margin auto business and (3) end of margin pressure in
N. American can business etc will drive earnings and deleveraging.
We cut LME est by USD100/t to USD1,800/t for 3Q and by USD50/t to USD1,900/t
for 4Q FY14E. LME assumptions for FY15E are kept unchanged at USD2,000/t
(INR/USD 60). Further, we increase the cost of production of aluminum to factor
certain issues highlighted in the results. Mahan smelter’s commercial production
too is pushed back to 4QFY14. Thus, FY14E/15E EPS is cut 13%/8% to
INR12.2/13.8, while SOTP-based target price is cut to INR154/share (v/s INR165).
We continue to believe that peaking of capex and improving cash flows will lead
to deleveraging, which will drive equity value. HNDL trades at attractive cons.
EV/EBITDA of 6.5x (not adj. for CWIP) and P/BV of 0.9x (BV adj. for goodwill).
Buy.
Sanjay Jain
(SanjayJain@MotilalOswal.com); +91 22 3982 5412
Pavas Pethia
(Pavas.Pethia@MotilalOswal.com); +91 22 3982 5413
Investors are advised to refer through disclosures made at the end of the Research Report.

Hindalco
STANDALONE: Copper rebounds after shut down; aluminum below
estimates as operational issues pushed up costs
n
n
n
n
n
Adjusted PAT was flat YoY at INR3.57b (vs. est. of INR4.9b). EBITDA increased 5%
YoY (+13% QoQ) to INR5.4b (vs. est. of INR7.1b).
The operating performance is improving slower than expected due to slower
than expected growth in aluminum production and issues in sourcing bauxite
(for Belgaum). Increase in coal cost and unabsorbed fixed costs at new Hirakud
FRP unit too affected cost of production of aluminum.
Copper business improved on expected lines after shut down in previous
quarter.
Mahan smelter is ramping up but at slower pace. The capitalization of capex is
now pushed back to 4QFY14.
Utkal alumina is ramping up gradually, but this doesn’t get reported in
standalone results.
Copper: operating performance rebounds after shutdown in 1QFY14;
benefits from USD/INR depreciation
n
n
Copper production increased 13% QoQ to 77kt after shut down in 1st quarter,
which led to significant improvement in operating performance.
EBIT increased 15% YoY to INR2.4b due to 5% growth in volumes and currency
depreciation. EBIT/lb was flat YoY at 23 US cents.
Aluminum: production ramp up slower; costs increased due to operational
issues; currency upside capped due to forward selling
n
n
n
n
n
n
Aluminum sales increased 2% QoQ (+4% YoY) to 132kt. Alumina production
declined 4% QoQ (+2% YoY) to 334kt due to issues in sourcing and quality of 3rd
party bauxite for Belgaum refinery.
Hirakud smelter’s performance too was affected due to issues in sourcing coal
from captive mines due to problem with transporter. New FRP unit for
producing can body too had unabsorbed fixed costs.
Higher energy costs due to increase in prices by coal India and disruption at
Hirakud captive mine supply affected costs. Some of the input costs e.g. caustic
soda and furnace oil has started easing.
MTM loss of INR350m also had an impact on the segment profit.
Segmental EBIT declined 33% QoQ to INR1.7b. EBIT per ton was down 41% QoQ
to USD201/t. Segmental EBITDA is estimated at INR2.6b. EBITDA per ton was
down 36% QoQ to USD309/t.
Average realization was up only 3% QoQ against expectation of 9% (INR/USD
rate depreciated by 12% offset by 3% lower LME). Partial forward selling of
aluminum and currency eroded part of expected gain on realization. Cost of
production of aluminum is estimated at USD1766/ton (+8% QoQ and -5% YoY).
Projects
n
n
Utkal alumina refinery ramp up is under way. Alumina production was 41kt
during the quarter.
Mahan smelter too is ramping up. Metal production during the quarter was
7.4kt.
2
12 November 2013

Hindalco
n
Aditya is in advance stages of completion. First metal is expected to be tapped
by end of November.
Hindalco Aluminium Business (INR m)
1QFY13 2QFY13 3QFY13 4QFY13 1QFY14 2QFY14 3QFY14 4QFY14
Segmental Revenue
20,626 21,049 22,155 23,961 22,111 23,427 24,412 29,811
l es s : Al umi na
2,930
2,160
2,170
2,360
2,000
2,360
2,360
2,360
(a ) Revenue (onl y Al umi ni um products )
17,696 18,889 19,985 21,601 20,111 21,067 22,052 27,451
Sa l es (000 tons )
124
127
135
147
130
132
142
170
Rea l i za ti on (INR/ton)
142,862 148,732 148,584 146,845 155,181 159,595 155,294 161,665
EBITDA
3,415
2,609
3,110
3,388
3,515
2,550
3,512
4,873
Les s : Al umi na EBITDA (50% ma rgi n a s s umed 1,465
1,080
1,085
1,180
1,000
1,180
1,180
1,180
(b) EBITDA (onl y Al umi ni um products )
1,950
1,529
2,025
2,208
2,515
1,370
2,332
3,693
Cos ts (a - b)
15,745 17,360 17,960 19,393 17,597 19,697 19,720 23,757
Al umi ni um cos ts (INR/ton)
127,116 136,692 133,528 131,835 135,778 149,216 138,873 139,914
USD/INR
54.2
55.2
54.2
54.3
56.0
62.5
62.0
62.0
LME (USD/ton)
1,978
1,918
1,997
2,002
1,834
1,782
1,800
1,900
Aluminium costs (USD/ton)
2,345
2,476
2,464
2,430
2,425
2,387
2,240
2,257
Rea l i za ti on (USD/ton)
2,636
2,694
2,741
2,707
2,771
2,554
2,505
2,608
Product premi um over LME
658
776
744
705
937
772
705
708
EBITDA per ton (USD)
291
218
278
277
346
166
265
351
~ COP (LME - EBITDA/t +150) USD
1,837
1,850
1,869
1,875
1,638
1,766
1,685
1,699
Source: MOSL, Company
NOVELIS: Below est. but improving; earnings up cycle beginning;
deleveraging too has started
n
n
n
n
Adjusted EBITDA increased 5% QoQ to USD228m on 1% higher volumes. EBITDA
per ton improved 3% QoQ to USD318 as the benefits of expansion in South
America have started to kick in with strong volumes growth of 14% YoY.
Although the results for the quarter are lower than our estimates, yet earnings
are improving. Management guided for stronger 2HFY14 (despite seasonally
weaker 3Q) driven by both volumes and margin expansion. We believe this is
the beginning of earnings up cycle.
FY14 volumes are expected to increase by net 110kt YoY on account of benefit
of 65kt volumes from South America expansion and the remaining growth in
volumes will be driven by strong auto demand and FRP expansion in Asia. We
are increasing volumes in 2nd Half, which will make up for lower than estimated
volumes in 2Q thereby keeping the full year volumes unchanged. 3QFY14 is
special this year due to strong demand from auto in N. America and Europe,
where customers are asking Novelis to keep the plants running during winter.
Net debt declined USD161m QoQ to USD4.76b despite capex of USD164m. Net
working capital declined by USD136m. Despite USD350-400m capex, further
deleveraging is expected to be driven by EBITDA expansion and working capital
release in 2HFY14.
Encouraged by the strong demand from auto sector, Novelis is already
evaluating additional investment. FY15 Capex will be 30% lower at USD500-
550m (inclusive of expected new capex announcements), while margin
expansion and volume growth (+ 8% YoY) will drive EBITDA and operating cash
flows higher. As a result of free cash flows, further deleveraging is expected.
3
12 November 2013

Hindalco
n
As Novelis is exiting heavy investment phase, the benefits of (1) volume growth
(2) superior share of high margin auto business (3) end of margin pressure in N.
American can business etc, will drive earnings and deleveraging.
NET DEBT (USD m) has peaked
EBITDA (USD m) Up cycle has begun
Source: MOSL, Company
Management’s Quotes are bullish
n
n
n
“We are nearing an inflection point in the transition of our business from
investment to growth”
“In fact, with the contribution from our expansions in South America and Asia,
we expect results in the second half of fiscal 2014 to be stronger than the first
half."
“Two North American finishing lines are on track to produce commercial
product by the end of this fiscal year and we are already evaluating additional
investments."
Conference Call Takeaways
n
n
n
n
n
Strong EBITDA and working capital release will turn Free Cash Flow (after capex)
positive 2HFY14.
Novelis is targeting to achieve 50% recycling by 2015.
Novelis expects FRP demand to grow at 5% CAGR from 18m tons to 28m tons
over 2012-2020 driven by CAGR growth of (1) 30% in Auto (2)6% in Specialties
and (3) 4-5% in beverage can. Auto sheet currently accounts for only 6% of total
shipments.
Capex guidance of USD700-750m for FY14.
Novelis expects EBITD/ton to improve in 2HFY14 over current levels of
~USD320/t.
South America: going north; volume growingly strongly; EBITDA up 37% YoY
n
n
Volumes growing strongly (+14% YoY and 18% QoQ). EBITDA increased 37% YoY
(+33% QoQ) to USD56m.
Expect shipments to increase by 65kt YoY to 460kt. This will contribute 60% to
the volume growth of 110kt for Novelis in FY14.
12 November 2013
4

Hindalco
North America: volumes were flat QoQ (-12% YoY); EBITDA up 52% QoQ;
margin and volume outlook stronger for FY15
n
n
n
Adjusted EBITDA increased 52% QoQ (-43% YoY) to USD70m benefitting from
stronger demand from auto. Volumes were flat QoQ (declined 12% YoY).
The margins in beverage can business still remain under pressure due to over
capacity and last contract negotiations. The margins in the can business are
expected to improve over 12-18months as some of FRP capacities in the region
are re-allocated to auto lines. Novelis is already seeing some impact in recent
discussions with customers.
Auto lines at Oswego are expected to achieve 70% capacity utilization in FY15,
which implies additional volumes of 168kt. Novelis has recently announced price
hike for auto products.
Europe: EBITDA declined 18% YoY; auto demand remains strong
n
n
n
Adjusted EBITDA declined 18% YoY (-13% QoQ) to USD61m.
Can shipments were flat, while specialties’ demand was weak. Volumes were
flat YoY (-4% QoQ).
Auto demand has strong traction, which will keep driving volumes and margins.
Asia: New LME rules should cool feedstock MJP premiums and benefit
margins
n
n
n
n
EBITDA up 5% YoY (-11% QoQ) to USD41m. Stronger can demand continue to
drive volumes (+9% YoY, -1% QoQ), while recycling is benefitting margins.
Local competition and higher feedstock spot premiums (at MJP) continue to
affect performance.
Novelis is optimistic that new LME rules will result in some softening of
premiums.
New China Auto line is expected to contribute 20kt volumes in FY15.
(USD Million)
FY14
2Q
3QE
718
721
-0.1
11.4
2,427
2,278
-0.6
-1.8
228
238
9.4
10.4
318
330
74
74
79
77
75
87
(26)
-
49
87
26
26
53.1
30.0
23
61
23
61
53
64
FY13
4QE
749
7.3
2,442
-2.3
261
10.7
348
74
78
109
-
109
33
30.0
76
76
80
2,786
-1.8
9,812
-11.3
961
9.8
345
292
292
377
(91)
286
83
29.0
203
202
267
FY14 vs Est
2QE
(%)
729
-2
1.4
2,290
6
-6.2
244
-7
10.7
335
-5
75
-1
76
4
93
-20
-
93
-47
28
30.0
65
-65
65
-65
70
-24
Quarterly Performance (Novelis)
Y/E March
Sales (000 tons)
Cha nge (YoY %)
Net Sales
Cha nge (YoY %)
EBITDA (adjusted)
As % of Net Sa l es
EBITDA per ton (USD)
Interes t
Depreci a ti on
PBT (before EO item)
Extra -ordi na ry Income
PBT (after EO item)
Tota l Ta x
% Ta x
PAT before minority
Reported PAT
Adjusted PAT
1Q
722
-5.9
2,550
-18.1
259
10.2
359
73
73
113
(1)
112
21
18.8
91
91
80
FY13
2Q
3Q
719
647
-0.1
-0.2
2,441
2,321
-15.2
-5.7
277
185
11.3
8.0
385
286
72
74
69
76
136
35
(49)
(21)
87
14
37
11
42.5
78.6
50
3
49
3
96
25
FY14E
2,896
3.9
9,556
-2.6
945
9.9
326
297
311
337
4Q
698
-0.7
2,500
-4.1
240
9.6
344
73
74
93
(20)
73
14
19.2
59
59
66
1Q
708
-1.9
2,408
-5.6
218
9.1
308
75
77
66
(49)
17
3
17.6
14
14
47
(75)
262
88
33.5
174
174
249
Source: MOSL, Company
12 November 2013
5

Hindalco
Improving cash flows will lead to deleveraging; Maintain buy
n
n
We are cutting LME estimates by USD100/t to USD1800/t for 3QFY14 and by
USD50/t to USD1900/t for 4QFY14. LME assumptions for FY15 are kept
unchanged at USD2000/t (INR/USD rate at 60). Further, we are increasing cost
of production of aluminum to factor some of issues highlighted in the results.
Mahan smelter’s commercial production too is pushed back to 4QFY14. As a
result, FY14/15 EPS is cut 13%/8% to INR12.2/13.8. SOTP is cut by INR154/share
(vs 165).
We continue to believe that peaking of capex and improving cash flows will lead
to deleveraging, which will drive equity value. Stock is trading at attractive cons.
EV/EBTIDA of 6.5x (not adj. for CWIP) and P/BV of 0.9x (BV adj. for goodwill).
Buy
Target price calculations
EBITDA
EV/EBTIDAx
Target EV
Net Debt
EQ = (EV-net Debt)
A. INR/share(EQ)
CWIP
B. INR/share (CWIP)
C. discount factor (%)
D. Investments (quoted)
E. INR/share (investments)
F.discount factor (%)
TP (A+B*(1-C%)+E*(1-F%))
FY12
81,897
6.0
491,384
346,851
144,533
75
227,981
119
FY13
80,584
6.0
483,503
479,505
3,998
2
338,311
177
FY14E
FY15E
87,546
112,510
5.5
5.5
481,502
618,807
485,725
497,892
-4,223
120,915
-2
59
279,417
180,415
135
87
12
12
47,630
47,630
23
23
20
20
135
154
Source: Company, MOSL
12 November 2013
6

Hindalco
Hindalco: an investment profile
Company description
Hindalco Industries (HNDL) is the largest aluminum
producer in India and has captive bauxite mines from
which it sources ~67% of requirements for its 1.5mtpa
alumina refinery. Company also has a 0.54mtpa melting
capacity and is the largest maker of flat rolled aluminum
products in India. After turning Novelis around in 2010,
HNDL is focusing on tripling its aluminum production
capacity in India in the next three years through
brownfield and greenfield projects. Its copper smelting
capacity of 500ktpa is the largest in Asia.
Key investment risks
n
An unexpected fall in aluminum prices, sluggish
growth in developed countries and further delays
in expansion activities could adversely impact
earnings.
Recent developments
n
HNDL has issued 150m equity shares at
INR144.35/shares on 20
th
September, 2013 against
warrants allotted on a preferential basis to
promoter group companies.
Key investment arguments
n
Valuation and view
n
n
Company's new smelting capacities are coming up
near energy sources and alumina facilities are near
bauxite mines, thus ensuring low cost of
production.
We expect Novelis to deliver strong earnings
growth, given its focus on high margin business,
expansions in key markets and continued efforts to
improve operating efficiencies across locations.
We continue to believe that peaking of capex and
improving cash flows will lead to deleveraging,
which will drive equity value. Stock is trading at
attractive cons. EV/EBTIDA of 6.5x (not adj. for
CWIP) and P/BV of 0.9x (BV adj. for goodwill).
Buy.
Sector view
n
We believe that aluminum demand will continue
to outperform, with a CAGR of 4-5% over the next
5-20 years. Notwithstanding oversupply, we
expect aluminum prices to outperform other base
metals due to rising cost of production and
choking of investment in the sector.
Comparative valuations
P/E (x)
P/BV (x)
EV/Sales (x)
EV/EBITDA (x)
FY14E
FY15E
FY14E
FY15E
FY14E
FY15E
FY14E
FY15E
Sep-13
9.1
8.1
1.0
0.9
0.8
0.7
8.2
6.5
Jun-13
10.1
5.9
0.9
0.8
1.6
1.6
6.2
5.0
Sep-12
14.5
12.4
0.8
0.8
0.9
0.7
6.3
4.7
EPS: MOSL forecast v/s consensus (INR)
MOSL
Forecast
FY14
FY15
12.2
13.8
Consensus
Forecast
12.6
14.1
Variation
(%)
-3.1
-2.2
Target price and recommendation
Current
Price (INR)
111
Target
Price (INR)
154
Upside
(%)
38.7
Reco.
Buy
Shareholding pattern (%)
Promoter
Domestic Inst
Foreign
Others
Sep-13
37.0
14.4
34.6
14.0
Jun-13
32.1
15.6
37.1
15.3
Sep-12
32.1
14.8
37.3
15.9
Stock performance (1-year)
12 November 2013
7

Hindalco
Financials and valuation
Income statement
Y/E March
Net Sales
Change (%)
EBITDA
EBITDA Margin (%)
Depreciation
EBIT
Interest
Other Income
Extraordinary items
PBT
Tax
Tax Rate (%)
Reported PAT
Adjusted PAT
Change (%)
Min. Int. & Assoc. Share
Adj Cons PAT
2012
808.2
12.1
81.9
10.1
28.7
53.2
17.6
7.8
0.0
43.4
7.9
18.1
35.6
35.6
-7.9
-1.6
34.0
2013
801.9
-0.8
80.6
10.0
28.6
52.0
20.8
10.1
-2.2
39.1
8.9
22.7
30.2
32.4
-8.8
0.0
32.5
(INR Billion)
2014E
872.6
8.8
87.5
10.0
36.0
51.6
29.5
11.7
-2.5
31.2
8.4
26.8
22.9
25.4
-21.7
-0.1
25.3
2015E
991.4
13.6
112.5
11.3
44.4
68.1
38.3
9.1
0.0
38.9
10.4
26.7
28.5
28.5
12.2
-0.1
28.4
Ratios
Y/E March
Basic (INR)
EPS
Cash EPS
Book Value
DPS
Payout (incl. Div. Tax.)
Valuation(x)
P/E
Cash P/E
Price / Book Value
EV/Sales
EV/EBITDA
Dividend Yield (%)
Profitability Ratios (%)
RoE
RoCE
Turnover Ratios (%)
Asset Turnover (x)
Debtors (No. of Days)
Inventory (No. of Days)
Creditors (No. of Days)
Leverage Ratios (%)
Net Debt/Equity (x)
2012
17.7
32.7
88.3
1.5
10.1
6.3
3.4
1.3
0.7
6.8
1.3
20.3
7.3
1.1
36.2
59.8
55.5
2.1
2013
17.0
31.9
100.7
1.4
10.6
6.6
3.5
1.1
0.9
8.6
1.3
18.0
5.8
0.9
40.7
65.2
48.6
2.5
2014E
12.2
29.7
110.6
1.4
13.6
9.1
3.7
1.0
0.8
8.2
1.3
11.6
5.1
0.9
37.1
58.6
55.2
2.1
2015E
13.8
35.2
122.7
1.4
12.1
8.1
3.2
0.9
0.7
6.5
1.3
11.8
6.5
1.0
36.8
59.3
56.3
2.0
Balance sheet
Y/E March
Share Capital
Reserves
Net Worth
Debt
Deferred Tax
Total Capital Employed
Gross Fixed Assets
Less: Acc Depreciation
Net Fixed Assets
Capital WIP
Investments
Current Assets
Inventory
Debtors
Cash & Bank
Loans & Adv, Others
Curr Liabs & Provns
Curr. Liabilities
Provisions
Net Current Assets
Total Assets
2012
1.9
317.2
319.1
428.4
36.1
800.7
428.9
186.6
242.3
228.0
17.5
354.5
132.5
80.2
81.6
60.4
191.8
110.5
81.3
162.8
800.7
2013
1.9
351.4
353.3
585.3
34.7
990.8
447.5
186.6
260.9
338.3
16.0
397.7
143.3
89.5
105.8
59.1
182.5
96.1
86.3
215.2
990.8
(INR Billion)
2014E
2015E
2.1
2.1
386.9
411.9
388.9
413.9
592.6
577.6
34.7
36.8
1,034.0 1,046.5
611.1
778.3
222.6
267.0
388.5
511.3
279.4
180.4
16.1
16.3
394.6
399.8
140.0
161.1
88.7
100.0
106.8
79.7
59.1
59.1
205.1
221.9
118.7
135.5
86.3
86.3
189.5
177.9
1,034.0 1,046.5
E: MOSL Estimates
Cash flow statement
Y/E March
EBITDA
Direct Taxes Paid
(Inc)/Dec in Wkg Cap
CF from Op. Activity
(Inc)/Dec in FA & CWIP
(Pur)/Sale of Invt
Others
CF from Inv. Activity
Inc/(Dec) in Net Worth
Inc / (Dec) in Debt
Interest Paid
Divd Paid (incl Tax)
CF from Fin. Activity
Inc/(Dec) in Cash
Add: Opening Balance
Closing Balance
2012
81.9
-10.9
-9.3
76.1
-125.1
-11.8
-0.6
-137.6
5.5
89.5
-28.5
-4.1
62.4
0.9
80.7
81.6
2013
80.6
-13.5
-38.7
29.8
-118.7
10.7
-0.4
-108.3
0.1
143.4
-36.7
-4.0
102.8
24.2
81.6
105.8
(INR Billion)
2014E
87.5
-8.4
26.8
103.4
-97.4
11.7
0.0
-85.7
16.2
0.0
-29.5
-3.4
-16.7
1.1
105.8
106.8
2015E
112.5
-8.2
-15.6
88.7
-68.2
9.1
0.0
-59.2
0.0
-15.0
-38.3
-3.4
-56.7
-27.2
106.8
79.7
12 November 2013
8

Hindalco
NOTES
12 November 2013
9

Disclosures
This report is for personal information of the authorized recipient and does not construe to be any investment, legal or taxation advice to you. This research report does not constitute an offer, invitation or
inducement to invest in securities or other investments and Motilal Oswal Securities Limited (hereinafter referred as MOSt) is not soliciting any action based upon it. This report is not for public distribution
and has been furnished to you solely for your information and should not be reproduced or redistributed to any other person in any form.
Unauthorized disclosure, use, dissemination or copying (either whole or partial) of this information, is prohibited. The person accessing this information specifically agrees to exempt MOSt or any of its
affiliates or employees from, any and all responsibility/liability arising from such misuse and agrees not to hold MOSt or any of its affiliates or employees responsible for any such misuse and further agrees
to hold MOSt or any of its affiliates or employees free and harmless from all losses, costs, damages, expenses that may be suffered by the person accessing this information due to any errors and delays.
The information contained herein is based on publicly available data or other sources believed to be reliable. While we would endeavour to update the information herein on reasonable basis, MOSt and/or
its affiliates are under no obligation to update the information. Also there may be regulatory, compliance, or other reasons that may prevent MOSt and/or its affiliates from doing so. MOSt or any of its
affiliates or employees shall not be in any way responsible and liable for any loss or damage that may arise to any person from any inadvertent error in the information contained in this report. MOSt or any
of its affiliates or employees do not provide, at any time, any express or implied warranty of any kind, regarding any matter pertaining to this report, including without limitation the implied warranties of
merchantability, fitness for a particular purpose, and non-infringement. The recipients of this report should rely on their own investigations.
Hindalco
This report is intended for distribution to institutional investors. Recipients who are not institutional investors should seek advice of their independent financial advisor prior to taking any investment decision
based on this report or for any necessary explanation of its contents.
MOSt and/or its affiliates and/or employees may have interests/positions, financial or otherwise in the securities mentioned in this report. To enhance transparency, MOSt has incorporated a Disclosure of
Interest Statement in this document. This should, however, not be treated as endorsement of the views expressed in the report.
Disclosure of Interest Statement
1. Analyst ownership of the stock
2. Group/Directors ownership of the stock
3. Broking relationship with company covered
4. Investment Banking relationship with company covered
HINDALCO INDUSTRIES LTD
No
No
No
No
Analyst Certification
The views expressed in this research report accurately reflect the personal views of the analyst(s) about the subject securities or issues, and no part of the compensation of the research analyst(s) was, is,
or will be directly or indirectly related to the specific recommendations and views expressed by research analyst(s) in this report. The research analysts, strategists, or research associates principally
responsible for preparation of MOSt research receive compensation based upon various factors, including quality of research, investor client feedback, stock picking, competitive factors and firm revenues.
This report is not directed or intended for distribution to or use by any person or entity resident in a state, country or any jurisdiction, where such distribution, publication, availability or use would be contrary
to law, regulation or which would subject MOSt & its group companies to registration or licensing requirements within such jurisdictions.
Regional Disclosures (outside India)
This report is intended for distribution only to persons having professional experience in matters relating to investments as described in Article 19 of the Financial Services and Markets Act 2000 (Financial
Promotion) Order 2005 (referred to as "investment professionals"). This document must not be acted on or relied on by persons who are not investment professionals. Any investment or investment activity
to which this document relates is only available to investment professionals and will be engaged in only with such persons.
For U.K.
Motilal Oswal Securities Limited (MOSL) is not a registered broker - dealer under the U.S. Securities Exchange Act of 1934, as amended (the"1934 act") and under applicable state laws in the United
States. In addition MOSL is not a registered investment adviser under the U.S. Investment Advisers Act of 1940, as amended (the "Advisers Act" and together with the 1934 Act, the "Acts), and under
applicable state laws in the United States. Accordingly, in the absence of specific exemption under the Acts, any brokerage and investment services provided by MOSL, including the products and services
described herein are not available to or intended for U.S. persons.
This report is intended for distribution only to "Major Institutional Investors" as defined by Rule 15a-6(b)(4) of the Exchange Act and interpretations thereof by SEC (henceforth referred to as "major
institutional investors"). This document must not be acted on or relied on by persons who are not major institutional investors. Any investment or investment activity to which this document relates is only
available to major institutional investors and will be engaged in only with major institutional investors. In reliance on the exemption from registration provided by Rule 15a-6 of the U.S. Securities Exchange
Act of 1934, as amended (the "Exchange Act") and interpretations thereof by the U.S. Securities and Exchange Commission ("SEC") in order to conduct business with Institutional Investors based in the
U.S., MOSL has entered into a chaperoning agreement with a U.S. registered broker-dealer, Motilal Oswal Securities International Private Limited. ("MOSIPL"). Any business interaction pursuant to this
report will have to be executed within the provisions of this chaperoning agreement.
The Research Analysts contributing to the report may not be registered /qualified as research analyst with FINRA. Such research analyst may not be associated persons of the U.S. registered broker-
dealer, MOSIPL, and therefore, may not be subject to NASD rule 2711 and NYSE Rule 472 restrictions on communication with a subject company, public appearances and trading securities held by a
research analyst account.
For U.S.
Motilal Oswal Capital Markets Singapore Pte Limited is acting as an exempt financial advisor under section 23(1)(f) of the Financial Advisers Act(FAA) read with regulation 17(1)(d) of the Financial
Advisors Regulations and is a subsidiary of Motilal Oswal Securities Limited in India. This research is distributed in Singapore by Motilal Oswal Capital Markets Singapore Pte Limited and it is only directed
in Singapore to accredited investors, as defined in the Financial Advisers Regulations and the Securities and Futures Act (Chapter 289), as amended from time to time.
In respect of any matter arising from or in connection with the research you could contact the following representatives of Motilal Oswal Capital Markets Singapore Pte Limited:
Anosh Koppikar
Kadambari Balachandran
Email : anosh.koppikar@motilaloswal.com
Email : kadambari.balachandran@motilaloswal.com
Contact: (+65) 68189232
Contact: (+65) 68189233 / 65249115
Office address: 21 (Suite 31), 16 Collyer Quay, Singapore 049318
For Singapore
Motilal Oswal Securities Ltd
12 November 2013
Motilal Oswal Tower, Level 9, Sayani Road, Prabhadevi, Mumbai 400 025
Phone: +91 22 3982 5500 E-mail: reports@motilaloswal.com
10