13 November 2013
2QFY14 Results Update | Sector:
Metals
Nalco
BSE SENSEX
20,282
Bloomberg
Equity Shares (m)
52-Week Range (INR)
1, 6, 12 Rel. Per (%)
S&P CNX
6,018
NACL IN
2,577.2
52/24
20/9/-21
CMP: INR39
TP: INR53
Buy
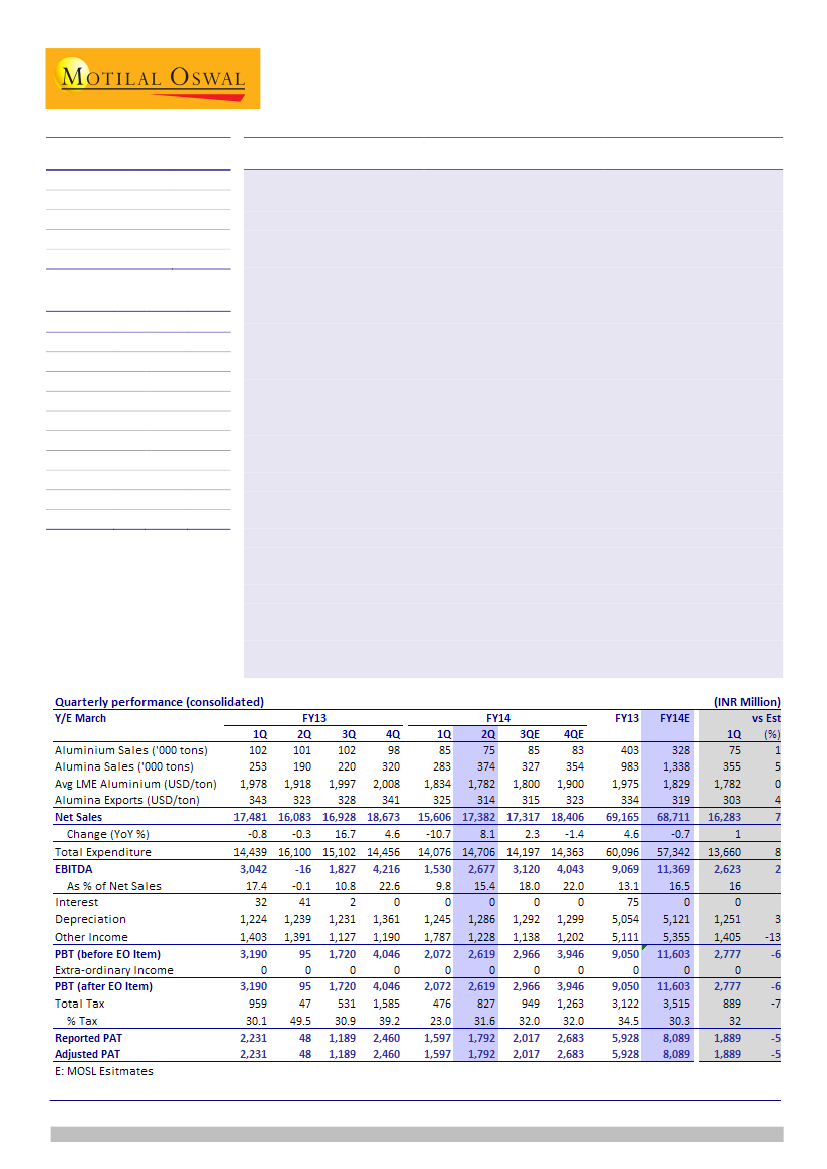
In line; higher alumina sales and realization boost margins; expect stronger
2HFY14
Reported EBITDA of INR2.7b (up 75% QoQ) was in line with our estimate of
INR2.6b. Higher alumina sales volume and better realization due to INR
depreciation against USD boosted margins. Adjusted PAT increased 12% QoQ to
INR1.8b.
Net sales increased 11% QoQ (+8% YoY) to INR17.4b. Alumina sales improved 32%
QoQ to 374kt. Aluminum sales declined 11% QoQ to 75kt due to restricted coal
supply from MCL. Smelter is operating at ~65-70% capacity utilization.
Aluminum realization increased 7% QoQ to INR130,019/t (USD2,080/t), while
alumina realization was up 8% QoQ to INR19,651/t (USD314/t). Product premium
dipped 1.1pp QoQ to 16.7% in 2QFY14.
According to our calculation, the cost of production (CoP) of metal increased 8%
QoQ to INR132,998 (USD2,128/t), while CoP for alumina increased by 1% QoQ to
INR14,164 (USD227/t).
Management has guided for stronger 2HFY14 performance due to improved
linkage coal availability and better realization in alumina.
Capex has been cut down to INR7-8b for FY14 as the NPCIL JV is still awaiting
regulatory approval. Management is open to the idea of increasing dividend.
Aluminum segment performance will remain volatile due to uncertain coal supply
from MCL. Alumina refineries however will continue to operate efficiently.
Commencement of mining operations at Utkal E coal block will be the key for
stock’s re-rating.
We build alumina production CAGR of 11% over FY13-15E, which will drive EPS
growth. EPS is expected to post 16% CAGR over FY13-15E to INR3.2/share. Stock
trades at FY15E PE of 12.4x and EV/EBITDA of 3.5x. We value NACL at INR53/share
based on EV/EBITDA of 5.5x FY15E (LME at USD2,000/t).
M.Cap. (INR b) / (USD b) 103.0/1.6
Financials & Valuation (INR Billion)
Y/E MAR
Net Sales
EBITDA
Adj PAT
Adj.EPS(INR)
Gr. (%)
BV/Share
(INR)
RoE (%)
RoCE (%)
P/E (x)
P/BV (X)
2013 2014E 2015E
69.2
9.1
5.9
2.3
-31.5
46.3
5.0
7.2
17.1
0.9
68.7
11.4
8.1
3.1
36.4
48.0
6.7
8.9
12.6
0.8
78.7
11.6
8.2
3.2
1.3
49.7
6.5
8.9
12.4
0.8
Sanjay Jain
(SanjayJain@MotilalOswal.com); +91 22 3982 5412
Pavas Pethia
(Pavas.Pethia@MotilalOswal.com); +91 22 3982 5413
Investors are advised to refer through disclosures made at the end of the Research Report.

Nalco
In-line; higher alumina sales and realization boost margins
Nalco reported EBITDA of INR2.7b (up 75% QoQ ), which was in line with our
estimate of INR2.6b. Higher alumina sales volumes and better realization due to
INR depreciation against USD boosted margins. Adjusted PAT increased 12%
QoQ to INR1.8b.
Net sales increased 11% QoQ (+8% YoY) to INR17.4b. Alumina sales improved
32% QoQ to 374kt. Aluminum sales declined 11% QoQ to 75kt due to restricted
coal supply from MCL. Smelter is operating at ~65-70% capacity utilization.
Aluminum realization increased 7% QoQ to INR130,019/t (USD2,080/t), while
alumina realization was up 8% QoQ to INR19,651/t (USD314/t). Product
premium dipped 1.1pp QoQ to 16.7% in 2QFY14.
Segmental EBIT of aluminum (full integration basis) remained negative at
INR223m (negative INR226m in 1QFY14). Segmental EBIT (external sales) of
alumina improved 78% QoQ INR2.1b in 2QFY14.
According to our calculation, the CoP (cost of production) of metal increased 8%
QoQ to INR132,998 (USD2,128/t), while CoP for alumina was increased by 1%
QoQ to INR14,164 (USD227/t).
Power and Fuel cost as percentage of sales decreased 2.9pp QoQ to 29.5% due
to lower Aluminum production.
Raw material cost pressure has been moderating in past few quarters (INR/T)
Source: MOSL, Company
EPS to grew at 11% CAGR over FY13-15 due to volume growth in Alumina;
Maintain Buy
Aluminum segment performance will remain volatile due to uncertain coal
supply from MCL. Alumina refineries however will continue to operate
efficiently. Starting of mining operations at Utkal E coal block will be the key
trigger for stock re-rating.
We are building production growth of 11% CAGR for Alumina over FY13-15,
which will drive EPS growth. However, aluminum production is expected to
decline at 11% CAGR over FY13-15 due to coal supply and costs unless LME
improves. We are not factoring captive coal availability in our FY14 and FY15
estimates. EPS is expected to increase 16% CAGR over FY13-15 to INR3.2/share.
Cash and cash equivalent has increased by INR1.9/share in 1HFY14 to
INR20.7/share. Stock trades at FY15 PE of 12.4x and EV/EBITDA of 3.5x.
We value the stock at INR53/share based on EV/EBITDA of 5.5x FY15E (LME at
USD2000/t). Maintain
Buy.
2
13 November 2013

Nalco
2QFY14 Concall Highlights
Expect stronger 2HFY14; Linkage coal availability is expected to improve in
2HFY14
Aluminum production and sales were 75kt each in the quarter. Alumina
production and sales were 479kt and 374kt respectively. Power generation was
1,180M kwh.
Management expects alumina realization to improve in 2HFY14 to ~USD320/t.
Metal realization improved INR10,000/t QoQ to INR131,000/t helped by
currency depreciation.
Coal blend contained 89% of linkage coal same as the last quarter. However
management expect linkage coal availability to improve in 2HFY14 leading to
reduction in Power and fuel cost.
Capex cut down to INR7-8b as NPCIL JV is still awaiting regulatory approval;
Open to idea of increasing dividend
NPCIL JV is still awaiting regulatory approvals. CapEx of INR9b earmarked for the
26% equity stake is unlikely to be incurred in FY14.
Total planned CapEx for FY14 is now expected to be INR7-8b.
Major projects underway: Wind Power in Rajasthan, 1mtpa refinery in JV with
GMDC, increasing smelting and refining capacity and coal block.
Capex during 1HFY14 was INR2.4b. 50% of INR2.8b wind power capex has been
spent so far. INR3b expenditure will be incurred on debottlenecking of existing
capacity.
Management has indicated that they are open to idea of increasing dividend in
case of lower outflows towards various projects.
Metal production ramp up still viable
The variable cost of incremental aluminum production (because of higher cost
of coal imports and attractive opportunity loss of alumina exports) is still higher
than incremental revenue. Hence, the metal production will not be ramped up.
Other income is on lower side due to lower gains on MF investments.
Cost of production for alumina was INR12,000/t.
Utkal E coal block is facing hurdles on land acquisition due to delay in approval
of Gram front on a patch of forest land. Gram Sabha meeting has been delayed
couple of times due to lack of quorum.
NACL expects employee cost reduction of INR1b (~8% of total Employee cost)
per year going forward as high cost employees retiring gradually.
Aluminum regional premium is around USD220/t.
13 November 2013
3

Nalco
Nalco: an investment profile
Company description
National Aluminium Company (Bloomberg: NACL) is a
fully integrated producer of aluminum and alumina.
Aluminum contributes ~70% and alumina ~30% of
revenues. Its aluminum smelter (0.46mtpa) sources
alumina and power from its captive refinery in
Damanjodi and captive power plant (CPP) located in
Angul. Coal for power generation is sourced from the
state-owned Coal India; hence, the cost of power
generated is low. The alumina refinery, which has a
capacity of 2.1mtpa, is located in Damanjodi (Orissa),
close to captive bauxite mines at Panchpatmalli. Bauxite
from these mines is of superior quality and consumes
low energy in the crushing and digestion process during
conversion to alumina.
Key investment risks
Unexpected fall in alumina or aluminum prices
may adversely impact profitability
Recent developments
Recent news item in media reported FIR against
Nalco on coal block allocation. Nalco has stated
that it has no information about any FIR filed
against the company on coal block allocation.
Valuation and view
Key investment arguments
NACL has increased its capacity for aluminum
smelting from 345ktpa to 460ktpa, for alumina
refining from 1.6mtpa to 2.1mtpa and for captive
power from 960MW to 1,200MW.
The company has been allotted a coal block, Utkal-
E, which has coal reserves of ~70m tons, and will
insulate it from input price risk.
We are building production growth of 11% CAGR
for Alumina over FY13-15, which will drive EPS
growth. EPS is expected to increase 16% CAGR
over FY13-15 to INR3.2/share. Stock trades at FY15
PE of 12.4x and EV/EBITDA of 3.5x. We value the
stock at INR53/share based on EV/EBITDA of 5.5x
FY15E (LME at USD2,000/t). Maintain
Buy.
Sector view
We believe that aluminum demand will continue
to outperform, with a CAGR of 4-5% over the next
5-20 years. Notwithstanding oversupply, we
expect aluminum prices to outperform other base
metals due to rising cost of production and
choking of investment in the sector.
Comparative valuations
P/E (x)
P/BV (x)
EV/Sales (x)
EV/EBITDA (x)
FY14E
FY15E
FY14E
FY15E
FY14E
FY15E
FY14E
FY15E
Nalco
12.6
12.4
0.8
0.8
0.7
0.5
4.2
3.5
Sesa -Sterlite
10.1
5.9
0.9
0.8
1.6
1.6
6.2
5.0
Hindalco
9.3
8.3
1.0
0.9
0.8
0.7
8.2
6.5
EPS: MOSL forecast v/s consensus (INR)
MOSL
Forecast
FY14
FY15
3.1
3.2
Consensus
Forecast
2.6
2.7
Variation
(%)
19.6
17.8
Target price and recommendation
Current
Price (INR)
39
Target
Price (INR)
53
Upside
(%)
35.9
Reco.
Buy
Shareholding pattern (%)
Promoter
Domestic Inst
Foreign
Others
Sep-13
81.1
10.1
4.2
4.6
Jun-13
81.1
10.3
4.2
4.5
Sep-12
87.2
5.2
4.0
3.7
Stock performance (1-year)
13 November 2013
4

Nalco
Financials and valuation
Income statement
Y/E March
Net Sales
Change (%)
EBITDA
EBITDA Margin (%)
Depreciation
EBIT
Interest
Other Income
Extraordinary items
PBT
Tax
Tax Rate (%)
Reported PAT
Adjusted PAT
Change (%)
2012
66.1
11.0
11.4
17.3
4.7
6.8
0.0
5.4
-0.2
12.0
3.5
29.1
8.5
8.7
-19.2
2013
69.2
4.6
9.1
13.1
5.1
4.0
0.1
5.1
0.0
9.1
3.1
34.5
5.9
5.9
-31.5
(INR Billion)
2014E
68.7
-0.7
11.4
16.5
5.1
6.2
0.0
5.4
0.0
11.6
3.5
30.3
8.1
8.1
36.4
2015E
78.7
14.5
11.6
14.8
5.1
6.6
0.0
5.5
0.0
12.0
3.9
32.0
8.2
8.2
1.3
Ratios
Y/E March
Basic (INR)
EPS
Cash EPS
Book Value
DPS
Payout (incl. Div. Tax.)
Valuation(x)
P/E
Cash P/E
Price / Book Value
EV/Sales
EV/EBITDA
Dividend Yield (%)
Profitability Ratios (%)
RoE
RoCE
Turnover Ratios (%)
Asset Turnover (x)
Debtors (No. of Days)
Inventory (No. of Days)
Leverage Ratios (%)
Net Debt/Equity (x)
2012
3.4
5.2
45.5
1.4
48.9
2013
2.3
4.3
46.3
1.3
63.6
17.1
9.2
0.9
0.7
5.7
3.2
7.6
10.0
0.5
7.6
66.9
-0.4
5.0
7.2
0.5
7.5
72.9
-0.4
2014E
3.1
5.1
48.0
1.3
46.6
12.6
7.7
0.8
0.7
4.2
3.2
6.7
8.9
0.5
8.2
61.8
-0.4
2015E
3.2
5.1
49.7
1.3
46.0
12.4
7.7
0.8
0.5
3.5
3.2
6.5
8.9
0.6
8.0
60.0
-0.5
Balance sheet
Y/E March
Share Capital
Reserves
Net Worth
Debt
Deferred Tax
Total Capital Employed
Gross Fixed Assets
Less: Acc Depreciation
Net Fixed Assets
Capital WIP
Investments
Current Assets
Inventory
Debtors
Cash & Bank
Loans & Adv, Others
Curr Liabs & Provns
Curr. Liabilities
Provisions
Net Current Assets
Total Assets
2012
12.9
104.3
117.2
0.0
8.5
125.6
136.6
70.5
66.1
6.8
7.5
74.7
12.1
1.4
41.7
19.5
26.7
26.7
0.0
48.0
128.5
2013
12.9
106.4
119.3
0.0
9.0
128.4
141.7
75.5
66.3
10.0
14.9
72.1
13.8
1.4
35.0
21.8
34.9
31.2
3.7
37.1
128.4
(INR Billion)
2014E
2015E
12.9
12.9
110.8
115.2
123.6
128.1
0.0
0.0
9.0
9.0
132.7
137.1
146.7
152.7
80.6
85.6
66.2
67.1
12.2
11.2
14.9
14.9
74.1
82.1
11.6
12.9
1.6
1.7
39.2
45.6
21.8
21.8
34.7
38.2
31.0
34.5
3.7
3.7
39.4
43.9
132.7
137.1
E: MOSL Estimates
Cash flow statement
Y/E March
OP/(Loss) before Tax
Depreciation
Others
Interest
Direct Taxes Paid
(Inc)/Dec in Wkg Cap
CF from Op. Activity
(Inc)/Dec in FA & CWIP
(Pur)/Sale of Invt
Others
CF from Inv. Activity
Inc / (Dec) in Debt
Interest Paid
Divd Paid (incl Tax)
Other Income
CF from Fin. Activity
Inc/(Dec) in Cash
Add: Opening Balance
Closing Balance
2012
12.0
4.7
-5.4
0.0
-1.9
-11.2
2.1
-5.2
5.8
0.0
0.5
-0.1
0.0
-4.2
5.4
1.1
3.7
38.0
41.7
2013
9.1
5.1
-5.1
-0.1
-2.6
2.7
7.6
-8.3
-7.4
0.0
-15.7
0.0
0.1
-3.8
5.1
1.4
-6.6
41.7
35.0
(INR Billion)
2014E
11.6
5.1
-5.4
0.0
-3.5
1.9
9.7
-7.2
0.0
0.0
-7.2
0.0
0.0
-3.8
5.4
1.6
4.1
35.0
39.2
2015E
12.0
5.1
-5.5
0.0
-3.9
2.0
9.8
-5.0
0.0
0.0
-5.0
0.0
0.0
-3.8
5.5
1.7
6.5
39.2
45.6
13 November 2013
5

Disclosures
This report is for personal information of the authorized recipient and does not construe to be any investment, legal or taxation advice to you. This research report does not constitute an offer, invitation or
inducement to invest in securities or other investments and Motilal Oswal Securities Limited (hereinafter referred as MOSt) is not soliciting any action based upon it. This report is not for public distribution
and has been furnished to you solely for your information and should not be reproduced or redistributed to any other person in any form.
Unauthorized disclosure, use, dissemination or copying (either whole or partial) of this information, is prohibited. The person accessing this information specifically agrees to exempt MOSt or any of its
affiliates or employees from, any and all responsibility/liability arising from such misuse and agrees not to hold MOSt or any of its affiliates or employees responsible for any such misuse and further agrees
to hold MOSt or any of its affiliates or employees free and harmless from all losses, costs, damages, expenses that may be suffered by the person accessing this information due to any errors and delays.
The information contained herein is based on publicly available data or other sources believed to be reliable. While we would endeavour to update the information herein on reasonable basis, MOSt and/or
its affiliates are under no obligation to update the information. Also there may be regulatory, compliance, or other reasons that may prevent MOSt and/or its affiliates from doing so. MOSt or any of its
affiliates or employees shall not be in any way responsible and liable for any loss or damage that may arise to any person from any inadvertent error in the information contained in this report. MOSt or any
of its affiliates or employees do not provide, at any time, any express or implied warranty of any kind, regarding any matter pertaining to this report, including without limitation the implied warranties of
merchantability, fitness for a particular purpose, and non-infringement. The recipients of this report should rely on their own investigations.
Nalco
This report is intended for distribution to institutional investors. Recipients who are not institutional investors should seek advice of their independent financial advisor prior to taking any investment decision
based on this report or for any necessary explanation of its contents.
MOSt and/or its affiliates and/or employees may have interests/positions, financial or otherwise in the securities mentioned in this report. To enhance transparency, MOSt has incorporated a Disclosure of
Interest Statement in this document. This should, however, not be treated as endorsement of the views expressed in the report.
Disclosure of Interest Statement
1. Analyst ownership of the stock
2. Group/Directors ownership of the stock
3. Broking relationship with company covered
4. Investment Banking relationship with company covered
NATIONAL ALUMINIUM CO LTD
No
No
No
No
Analyst Certification
The views expressed in this research report accurately reflect the personal views of the analyst(s) about the subject securities or issues, and no part of the compensation of the research analyst(s) was, is,
or will be directly or indirectly related to the specific recommendations and views expressed by research analyst(s) in this report. The research analysts, strategists, or research associates principally
responsible for preparation of MOSt research receive compensation based upon various factors, including quality of research, investor client feedback, stock picking, competitive factors and firm revenues.
This report is not directed or intended for distribution to or use by any person or entity resident in a state, country or any jurisdiction, where such distribution, publication, availability or use would be contrary
to law, regulation or which would subject MOSt & its group companies to registration or licensing requirements within such jurisdictions.
Regional Disclosures (outside India)
This report is intended for distribution only to persons having professional experience in matters relating to investments as described in Article 19 of the Financial Services and Markets Act 2000 (Financial
Promotion) Order 2005 (referred to as "investment professionals"). This document must not be acted on or relied on by persons who are not investment professionals. Any investment or investment activity
to which this document relates is only available to investment professionals and will be engaged in only with such persons.
For U.K.
Motilal Oswal Securities Limited (MOSL) is not a registered broker - dealer under the U.S. Securities Exchange Act of 1934, as amended (the"1934 act") and under applicable state laws in the United
States. In addition MOSL is not a registered investment adviser under the U.S. Investment Advisers Act of 1940, as amended (the "Advisers Act" and together with the 1934 Act, the "Acts), and under
applicable state laws in the United States. Accordingly, in the absence of specific exemption under the Acts, any brokerage and investment services provided by MOSL, including the products and services
described herein are not available to or intended for U.S. persons.
This report is intended for distribution only to "Major Institutional Investors" as defined by Rule 15a-6(b)(4) of the Exchange Act and interpretations thereof by SEC (henceforth referred to as "major
institutional investors"). This document must not be acted on or relied on by persons who are not major institutional investors. Any investment or investment activity to which this document relates is only
available to major institutional investors and will be engaged in only with major institutional investors. In reliance on the exemption from registration provided by Rule 15a-6 of the U.S. Securities Exchange
Act of 1934, as amended (the "Exchange Act") and interpretations thereof by the U.S. Securities and Exchange Commission ("SEC") in order to conduct business with Institutional Investors based in the
U.S., MOSL has entered into a chaperoning agreement with a U.S. registered broker-dealer, Motilal Oswal Securities International Private Limited. ("MOSIPL"). Any business interaction pursuant to this
report will have to be executed within the provisions of this chaperoning agreement.
The Research Analysts contributing to the report may not be registered /qualified as research analyst with FINRA. Such research analyst may not be associated persons of the U.S. registered broker-
dealer, MOSIPL, and therefore, may not be subject to NASD rule 2711 and NYSE Rule 472 restrictions on communication with a subject company, public appearances and trading securities held by a
research analyst account.
For U.S.
Motilal Oswal Capital Markets Singapore Pte Limited is acting as an exempt financial advisor under section 23(1)(f) of the Financial Advisers Act(FAA) read with regulation 17(1)(d) of the Financial
Advisors Regulations and is a subsidiary of Motilal Oswal Securities Limited in India. This research is distributed in Singapore by Motilal Oswal Capital Markets Singapore Pte Limited and it is only directed
in Singapore to accredited investors, as defined in the Financial Advisers Regulations and the Securities and Futures Act (Chapter 289), as amended from time to time.
In respect of any matter arising from or in connection with the research you could contact the following representatives of Motilal Oswal Capital Markets Singapore Pte Limited:
Anosh Koppikar
Kadambari Balachandran
Email : anosh.koppikar@motilaloswal.com
Email : kadambari.balachandran@motilaloswal.com
Contact: (+65) 68189232
Contact: (+65) 68189233 / 65249115
Office address: 21 (Suite 31), 16 Collyer Quay, Singapore 049318
For Singapore
Motilal Oswal Securities Ltd
13 November 2013
Motilal Oswal Tower, Level 9, Sayani Road, Prabhadevi, Mumbai 400 025
Phone: +91 22 3982 5500 E-mail: reports@motilaloswal.com
6